
Counties with the worst commutes in Alabama
Written by:
April 14, 2021
Canva
Counties with the worst commutes in Alabama
Commuting easily ranks as one of the least enjoyable parts of a person's day. Commuters encounter more physical health problems, and low-income commuters are less likely to gain financial stability—among a host of other negative impacts. And yet, America’s commutes keep getting longer as people move farther away from the office, according to census data.
Stacker compiled a list of counties with the worst commutes in Alabama using data from the U.S. Census Bureau. Counties are ranked by longest average commute time in 2019. Think you have a long trip to work? Read on to compare it against the worst commutes statewide.

1 / 30
Carol M. Highsmith // Wikimedia Commons
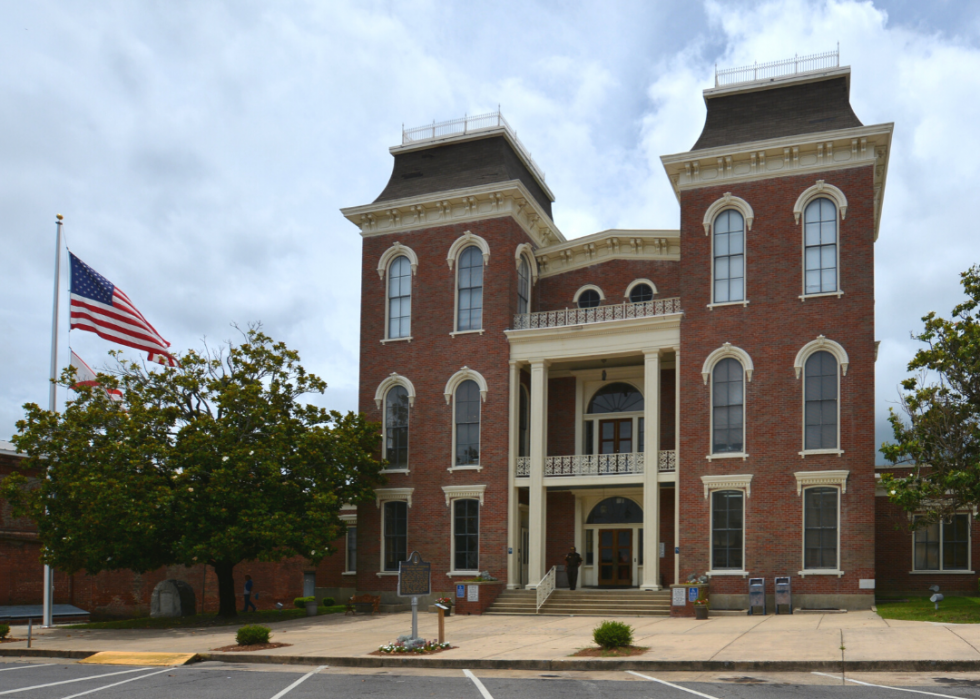
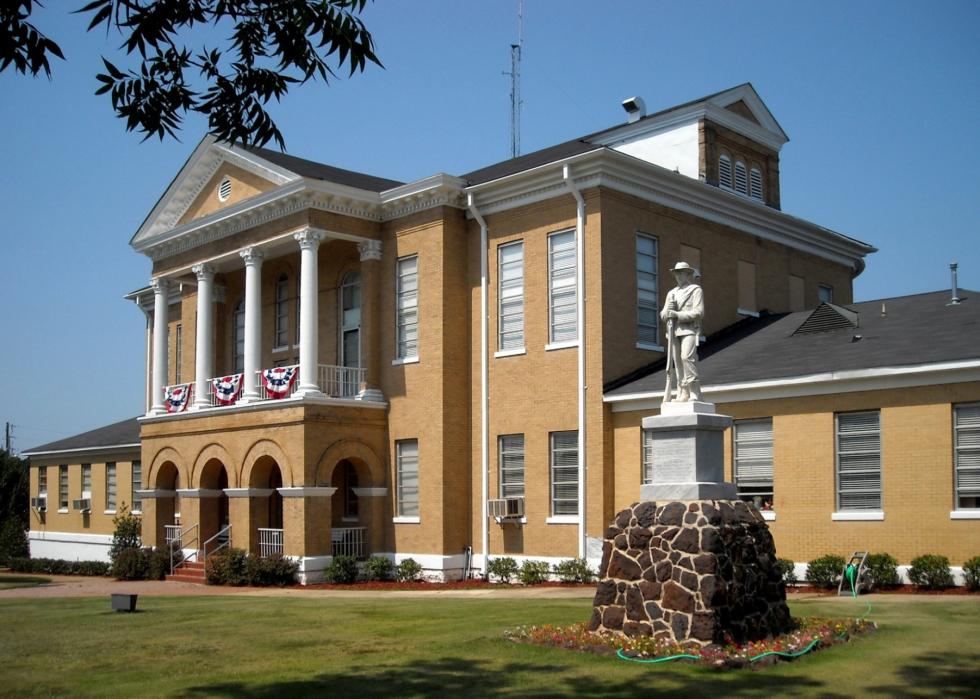
#30. Limestone County
- Average commute time: 27 minutes
--- #868 longest among all counties nationwide
--- 8.4% longer than state average
--- 2.2% shorter than national average
- Workers with 90+ minute commute: 1.43%
- Left for work from 12 a.m. to 6 a.m.: 17.6%
- Worked outside county of residence: 51.7%
- Means of transportation: drove alone (88.5%), carpooled (7.6%), walked (0.6%), public transportation (0.2%), worked from home (2.5%)

2 / 30
Canva
#29. Wilcox County
- Average commute time: 27.1 minutes
--- #846 longest among all counties nationwide
--- 8.8% longer than state average
--- 1.8% shorter than national average
- Workers with 90+ minute commute: 3.33%
- Left for work from 12 a.m. to 6 a.m.: 26.9%
- Worked outside county of residence: 37.1%
- Means of transportation: drove alone (89.2%), carpooled (7.4%), walked (0.5%), public transportation (0.3%), worked from home (2.2%)
3 / 30
Canva
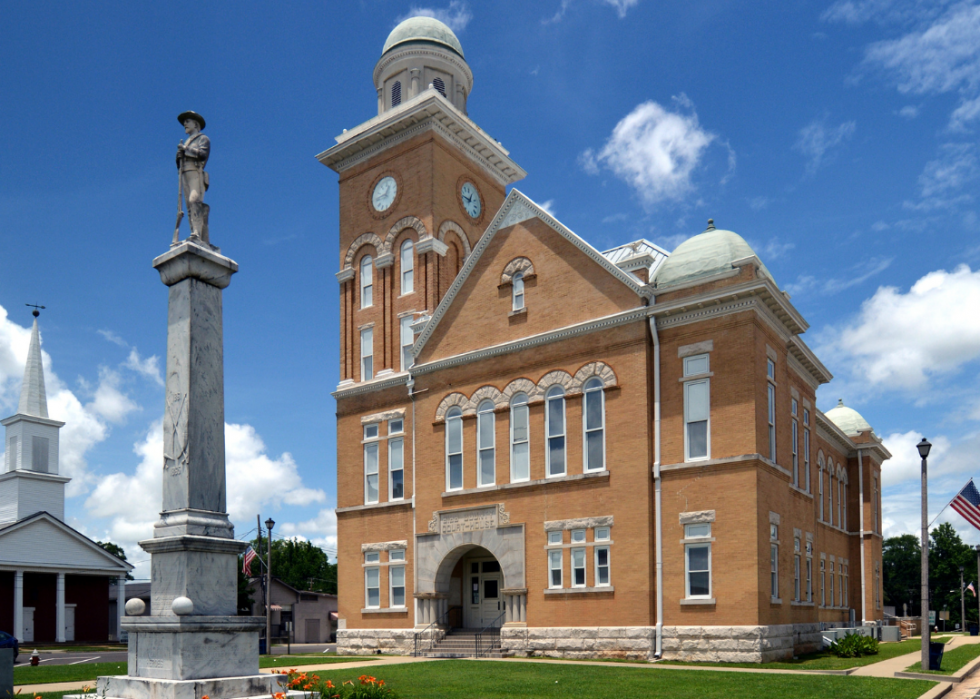
#28. Bullock County
- Average commute time: 27.2 minutes
--- #829 longest among all counties nationwide
--- 9.2% longer than state average
--- 1.4% shorter than national average
- Workers with 90+ minute commute: 2.71%
- Left for work from 12 a.m. to 6 a.m.: 24.7%
- Worked outside county of residence: 43.5%
- Means of transportation: drove alone (80.9%), carpooled (12.3%), walked (4.9%), public transportation (0%), worked from home (1.9%)

4 / 30
Myself - Nathon Morris // Wikimedia Commons
#27. Lamar County
- Average commute time: 27.8 minutes
--- #741 longest among all counties nationwide
--- 11.6% longer than state average
--- 0.7% longer than national average
- Workers with 90+ minute commute: 2.12%
- Left for work from 12 a.m. to 6 a.m.: 22.4%
- Worked outside county of residence: 25.6%
- Means of transportation: drove alone (89.7%), carpooled (8.8%), walked (0%), public transportation (0.7%), worked from home (0.9%)

5 / 30
Wmr36104 // Wikimedia Commons
#26. Geneva County
- Average commute time: 27.8 minutes
--- #741 longest among all counties nationwide
--- 11.6% longer than state average
--- 0.7% longer than national average
- Workers with 90+ minute commute: 5.26%
- Left for work from 12 a.m. to 6 a.m.: 23.0%
- Worked outside county of residence: 49.4%
- Means of transportation: drove alone (85.6%), carpooled (10.1%), walked (0.3%), public transportation (0%), worked from home (1.8%)

6 / 30
Rivers A. Langley; SaveRivers // Wikimedia Commons
#25. Randolph County
- Average commute time: 27.9 minutes
--- #724 longest among all counties nationwide
--- 12.0% longer than state average
--- 1.1% longer than national average
- Workers with 90+ minute commute: 2.90%
- Left for work from 12 a.m. to 6 a.m.: 26.4%
- Worked outside county of residence: 16%
- Means of transportation: drove alone (88.1%), carpooled (7.8%), walked (0.5%), public transportation (0.1%), worked from home (2.9%)

7 / 30
Chris Pruitt // Wikimedia Commons
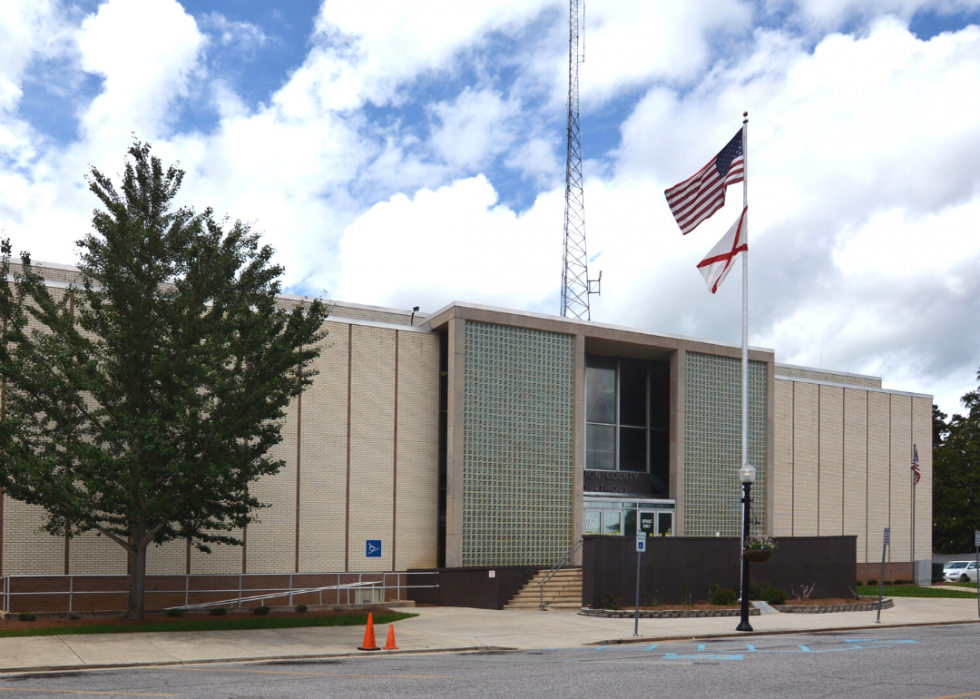
#24. Conecuh County
- Average commute time: 27.9 minutes
--- #724 longest among all counties nationwide
--- 12.0% longer than state average
--- 1.1% longer than national average
- Workers with 90+ minute commute: 4.54%
- Left for work from 12 a.m. to 6 a.m.: 20.3%
- Worked outside county of residence: 40.2%
- Means of transportation: drove alone (88.9%), carpooled (6.9%), walked (1.2%), public transportation (0.2%), worked from home (1.3%)

8 / 30
Rivers Langley; SaveRivers // Wikimedia Commons
#23. Henry County
- Average commute time: 28 minutes
--- #699 longest among all counties nationwide
--- 12.4% longer than state average
--- 1.4% longer than national average
- Workers with 90+ minute commute: 2.67%
- Left for work from 12 a.m. to 6 a.m.: 17.2%
- Worked outside county of residence: 59.8%
- Means of transportation: drove alone (87%), carpooled (7.1%), walked (0.1%), public transportation (0%), worked from home (3.2%)

9 / 30
Rivers A. Langley; SaveRivers // Wikimedia Commons
#22. Tallapoosa County
- Average commute time: 28 minutes
--- #699 longest among all counties nationwide
--- 12.4% longer than state average
--- 1.4% longer than national average
- Workers with 90+ minute commute: 3.75%
- Left for work from 12 a.m. to 6 a.m.: 21.7%
- Worked outside county of residence: 36.8%
- Means of transportation: drove alone (86%), carpooled (9.3%), walked (0.9%), public transportation (0.1%), worked from home (2.6%)
10 / 30
Canva
#21. Walker County
- Average commute time: 28.4 minutes
--- #642 longest among all counties nationwide
--- 14.1% longer than state average
--- 2.9% longer than national average
- Workers with 90+ minute commute: 2.93%
- Left for work from 12 a.m. to 6 a.m.: 22.9%
- Worked outside county of residence: 32.6%
- Means of transportation: drove alone (84.5%), carpooled (10.8%), walked (1%), public transportation (0.1%), worked from home (2.5%)

11 / 30
Rivers A. Langley; SaveRivers // Wikimedia Commons
#20. Coosa County
- Average commute time: 28.8 minutes
--- #594 longest among all counties nationwide
--- 15.7% longer than state average
--- 4.3% longer than national average
- Workers with 90+ minute commute: 2.24%
- Left for work from 12 a.m. to 6 a.m.: 29.6%
- Worked outside county of residence: 76.2%
- Means of transportation: drove alone (82.1%), carpooled (10.9%), walked (2%), public transportation (0%), worked from home (4.8%)

12 / 30
Rudi Weikard // Wikimedia Commons
#19. Franklin County
- Average commute time: 28.8 minutes
--- #594 longest among all counties nationwide
--- 15.7% longer than state average
--- 4.3% longer than national average
- Workers with 90+ minute commute: 3.43%
- Left for work from 12 a.m. to 6 a.m.: 19.4%
- Worked outside county of residence: 31.5%
- Means of transportation: drove alone (82.9%), carpooled (14.2%), walked (0.7%), public transportation (0.1%), worked from home (1%)

13 / 30
Rivers Langley; SaveRivers // Wikimedia Commons
#18. Shelby County
- Average commute time: 28.9 minutes
--- #577 longest among all counties nationwide
--- 16.1% longer than state average
--- 4.7% longer than national average
- Workers with 90+ minute commute: 1.72%
- Left for work from 12 a.m. to 6 a.m.: 12.4%
- Worked outside county of residence: 46.4%
- Means of transportation: drove alone (86.2%), carpooled (6.9%), walked (0.8%), public transportation (0%), worked from home (5.4%)

14 / 30
JNix // Shutterstock
#17. Clay County
- Average commute time: 29.1 minutes
--- #548 longest among all counties nationwide
--- 16.9% longer than state average
--- 5.4% longer than national average
- Workers with 90+ minute commute: 4.99%
- Left for work from 12 a.m. to 6 a.m.: 30.2%
- Worked outside county of residence: 32.5%
- Means of transportation: drove alone (87.4%), carpooled (6.9%), walked (0.9%), public transportation (0%), worked from home (4.4%)

15 / 30
Canva
#16. Lawrence County
- Average commute time: 29.5 minutes
--- #492 longest among all counties nationwide
--- 18.5% longer than state average
--- 6.9% longer than national average
- Workers with 90+ minute commute: 2.05%
- Left for work from 12 a.m. to 6 a.m.: 25.5%
- Worked outside county of residence: 67.9%
- Means of transportation: drove alone (87.5%), carpooled (8.7%), walked (0.8%), public transportation (0.2%), worked from home (2.4%)

16 / 30
Rudi Weikard // Wikimedia Commons
#15. Cherokee County
- Average commute time: 29.5 minutes
--- #492 longest among all counties nationwide
--- 18.5% longer than state average
--- 6.9% longer than national average
- Workers with 90+ minute commute: 3.50%
- Left for work from 12 a.m. to 6 a.m.: 31.8%
- Worked outside county of residence: 25%
- Means of transportation: drove alone (82.1%), carpooled (14.3%), walked (0.4%), public transportation (0.2%), worked from home (1.6%)

17 / 30
Rudi Weikard // Wikimedia Commons
#14. St. Clair County
- Average commute time: 29.6 minutes
--- #485 longest among all counties nationwide
--- 18.9% longer than state average
--- 7.2% longer than national average
- Workers with 90+ minute commute: 1.36%
- Left for work from 12 a.m. to 6 a.m.: 20.4%
- Worked outside county of residence: 58.8%
- Means of transportation: drove alone (87%), carpooled (9.2%), walked (0.5%), public transportation (0.2%), worked from home (2.2%)
18 / 30
Canva
#13. Bibb County
- Average commute time: 29.7 minutes
--- #477 longest among all counties nationwide
--- 19.3% longer than state average
--- 7.6% longer than national average
- Workers with 90+ minute commute: 0.80%
- Left for work from 12 a.m. to 6 a.m.: 25.1%
- Worked outside county of residence: 63.2%
- Means of transportation: drove alone (87.1%), carpooled (8.9%), walked (0.1%), public transportation (0%), worked from home (3.1%)

19 / 30
Canva
#12. Fayette County
- Average commute time: 29.8 minutes
--- #464 longest among all counties nationwide
--- 19.7% longer than state average
--- 8.0% longer than national average
- Workers with 90+ minute commute: 2.71%
- Left for work from 12 a.m. to 6 a.m.: 23.7%
- Worked outside county of residence: 50.4%
- Means of transportation: drove alone (85.8%), carpooled (9.7%), walked (1.7%), public transportation (0%), worked from home (2.3%)

20 / 30
Rivers Langley; SaveRivers // Wikimedia Commons
#11. Crenshaw County
- Average commute time: 29.9 minutes
--- #454 longest among all counties nationwide
--- 20.1% longer than state average
--- 8.3% longer than national average
- Workers with 90+ minute commute: 3.43%
- Left for work from 12 a.m. to 6 a.m.: 23.9%
- Worked outside county of residence: 45.2%
- Means of transportation: drove alone (80.1%), carpooled (11.3%), walked (2%), public transportation (0.8%), worked from home (4.9%)

21 / 30
Canva
#10. Winston County
- Average commute time: 31.4 minutes
--- #307 longest among all counties nationwide
--- 26.1% longer than state average
--- 13.8% longer than national average
- Workers with 90+ minute commute: 6.96%
- Left for work from 12 a.m. to 6 a.m.: 24.1%
- Worked outside county of residence: 43.3%
- Means of transportation: drove alone (79.8%), carpooled (15.2%), walked (0.6%), public transportation (0.3%), worked from home (3%)

22 / 30
Altairisfar // Wikimedia Commons
#9. Lowndes County
- Average commute time: 31.5 minutes
--- #298 longest among all counties nationwide
--- 26.5% longer than state average
--- 14.1% longer than national average
- Workers with 90+ minute commute: 2.37%
- Left for work from 12 a.m. to 6 a.m.: 26.5%
- Worked outside county of residence: 70.9%
- Means of transportation: drove alone (88%), carpooled (8.1%), walked (0.4%), public transportation (0.4%), worked from home (0.9%)

23 / 30
Carol M. Highsmith // Wikimedia Commons
#8. Hale County
- Average commute time: 31.6 minutes
--- #290 longest among all counties nationwide
--- 26.9% longer than state average
--- 14.5% longer than national average
- Workers with 90+ minute commute: 2.23%
- Left for work from 12 a.m. to 6 a.m.: 24.3%
- Worked outside county of residence: 63.4%
- Means of transportation: drove alone (88.9%), carpooled (7.2%), walked (0.2%), public transportation (0.2%), worked from home (2.9%)
24 / 30
Canva
#7. Chilton County
- Average commute time: 32.1 minutes
--- #257 longest among all counties nationwide
--- 28.9% longer than state average
--- 16.3% longer than national average
- Workers with 90+ minute commute: 2.03%
- Left for work from 12 a.m. to 6 a.m.: 28.7%
- Worked outside county of residence: 51.2%
- Means of transportation: drove alone (83.8%), carpooled (12.9%), walked (0.5%), public transportation (0%), worked from home (2.3%)

25 / 30
Public Domain
#6. Pickens County
- Average commute time: 33.2 minutes
--- #183 longest among all counties nationwide
--- 33.3% longer than state average
--- 20.3% longer than national average
- Workers with 90+ minute commute: 3.96%
- Left for work from 12 a.m. to 6 a.m.: 27.2%
- Worked outside county of residence: 37.5%
- Means of transportation: drove alone (82.3%), carpooled (8.9%), walked (1.8%), public transportation (0.4%), worked from home (6.4%)

26 / 30
Idawriter // Wikimedia Commons
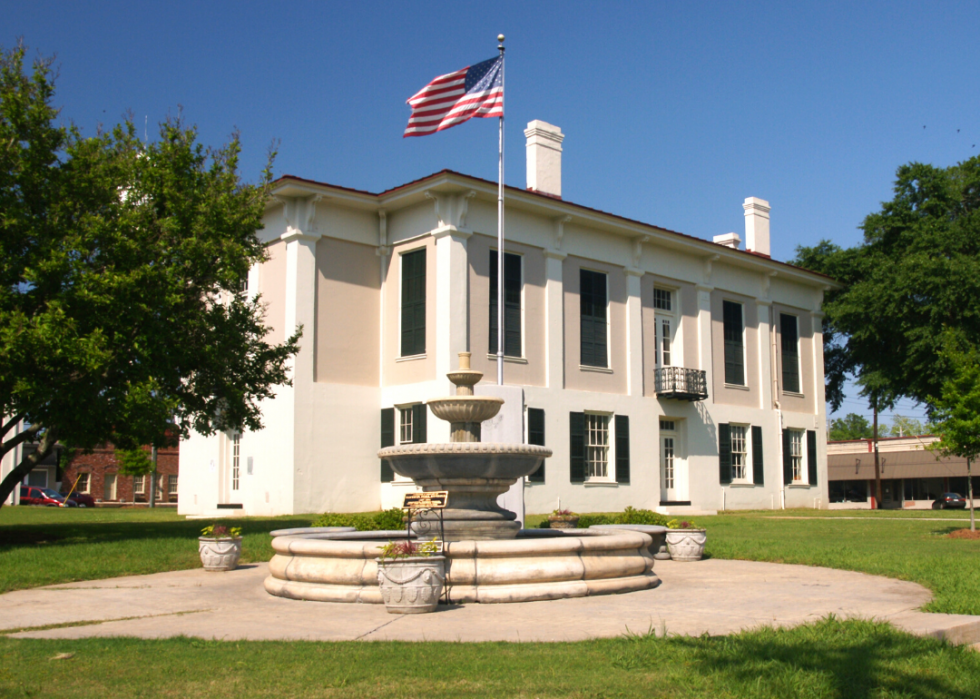
#5. Washington County
- Average commute time: 33.4 minutes
--- #171 longest among all counties nationwide
--- 34.1% longer than state average
--- 21.0% longer than national average
- Workers with 90+ minute commute: 4.67%
- Left for work from 12 a.m. to 6 a.m.: 34.9%
- Worked outside county of residence: 39.6%
- Means of transportation: drove alone (86.5%), carpooled (9.9%), walked (0.2%), public transportation (0%), worked from home (0.9%)

27 / 30
Rivers Langley; SaveRivers // Wikimedia Commons
#4. Cleburne County
- Average commute time: 34 minutes
--- #138 longest among all counties nationwide
--- 36.5% longer than state average
--- 23.2% longer than national average
- Workers with 90+ minute commute: 7.49%
- Left for work from 12 a.m. to 6 a.m.: 30.1%
- Worked outside county of residence: 26.4%
- Means of transportation: drove alone (84.6%), carpooled (11.2%), walked (0.7%), public transportation (0%), worked from home (3.4%)

28 / 30
Rudi Weikard // Wikimedia Commons
#3. Blount County
- Average commute time: 34.4 minutes
--- #122 longest among all counties nationwide
--- 38.2% longer than state average
--- 24.6% longer than national average
- Workers with 90+ minute commute: 2.65%
- Left for work from 12 a.m. to 6 a.m.: 20.6%
- Worked outside county of residence: 66.5%
- Means of transportation: drove alone (87.5%), carpooled (9.7%), walked (0.4%), public transportation (0.1%), worked from home (1.5%)
29 / 30
RuralSWAlabama (Billy Milstead) // Wikimedia Commons
#2. Choctaw County
- Average commute time: 34.5 minutes
--- #118 longest among all counties nationwide
--- 38.6% longer than state average
--- 25.0% longer than national average
- Workers with 90+ minute commute: 6.35%
- Left for work from 12 a.m. to 6 a.m.: 30.0%
- Worked outside county of residence: 14.6%
- Means of transportation: drove alone (84.6%), carpooled (10.5%), walked (1.5%), public transportation (0%), worked from home (1.9%)
30 / 30
Canva
#1. Greene County
- Average commute time: 35.2 minutes
--- #95 longest among all counties nationwide
--- 41.4% longer than state average
--- 27.5% longer than national average
- Workers with 90+ minute commute: 8.31%
- Left for work from 12 a.m. to 6 a.m.: 23.4%
- Worked outside county of residence: 58.5%
- Means of transportation: drove alone (72.7%), carpooled (23.1%), walked (0.8%), public transportation (0%), worked from home (3%)


