
Counties with the worst commutes in Arkansas
Written by:
April 14, 2021
Valis55 // Wikimedia Commons
Counties with the worst commutes in Arkansas
Commuting easily ranks as one of the least enjoyable parts of a person's day. Commuters encounter more physical health problems, and low-income commuters are less likely to gain financial stability—among a host of other negative impacts. And yet, America’s commutes keep getting longer as people move farther away from the office, according to census data.
Stacker compiled a list of counties with the worst commutes in Arkansas using data from the U.S. Census Bureau. Counties are ranked by longest average commute time in 2019. Think you have a long trip to work? Read on to compare it against the worst commutes statewide.

1 / 30
Thomas R Machnitzki (thomas@machnitzki.com) // Wikimedia Commons
#30. Poinsett County
- Average commute time: 24 minutes
--- #1,486 longest among all counties nationwide
--- 10.6% longer than state average
--- 13.0% shorter than national average
- Workers with 90+ minute commute: 2.26%
- Left for work from 12 a.m. to 6 a.m.: 20.3%
- Worked outside county of residence: 47.6%
- Means of transportation: drove alone (82.4%), carpooled (10.7%), walked (1.2%), public transportation (0%), worked from home (5.2%)

2 / 30
Brandonrush // Wikimedia Commons
#29. Dallas County
- Average commute time: 24.3 minutes
--- #1,424 longest among all counties nationwide
--- 12.0% longer than state average
--- 12.0% shorter than national average
- Workers with 90+ minute commute: 3.16%
- Left for work from 12 a.m. to 6 a.m.: 26.4%
- Worked outside county of residence: 39.7%
- Means of transportation: drove alone (83.9%), carpooled (11.9%), walked (2.4%), public transportation (0.1%), worked from home (0.4%)

3 / 30
Ronny2756 // Wikimedia Commons
#28. Faulkner County
- Average commute time: 24.4 minutes
--- #1,392 longest among all counties nationwide
--- 12.4% longer than state average
--- 11.6% shorter than national average
- Workers with 90+ minute commute: 1.54%
- Left for work from 12 a.m. to 6 a.m.: 15.6%
- Worked outside county of residence: 32%
- Means of transportation: drove alone (84.4%), carpooled (9.1%), walked (1.9%), public transportation (0.2%), worked from home (3.2%)

4 / 30
Efy96001 // Wikimedia Commons
#27. White County
- Average commute time: 24.5 minutes
--- #1,363 longest among all counties nationwide
--- 12.9% longer than state average
--- 11.2% shorter than national average
- Workers with 90+ minute commute: 2.48%
- Left for work from 12 a.m. to 6 a.m.: 19.1%
- Worked outside county of residence: 26%
- Means of transportation: drove alone (82.8%), carpooled (10.3%), walked (2.8%), public transportation (0.2%), worked from home (2.8%)

5 / 30
Brandonrush // Wikimedia Commons
#26. Scott County
- Average commute time: 24.8 minutes
--- #1,289 longest among all counties nationwide
--- 14.3% longer than state average
--- 10.1% shorter than national average
- Workers with 90+ minute commute: 2.97%
- Left for work from 12 a.m. to 6 a.m.: 24.9%
- Worked outside county of residence: 24.7%
- Means of transportation: drove alone (77.7%), carpooled (16.5%), walked (0.7%), public transportation (0.1%), worked from home (3.1%)

6 / 30
Brandonrush // Wikimedia Commons
#25. Cross County
- Average commute time: 24.8 minutes
--- #1,289 longest among all counties nationwide
--- 14.3% longer than state average
--- 10.1% shorter than national average
- Workers with 90+ minute commute: 3.42%
- Left for work from 12 a.m. to 6 a.m.: 18.3%
- Worked outside county of residence: 31.4%
- Means of transportation: drove alone (82.3%), carpooled (12.1%), walked (1.3%), public transportation (0.1%), worked from home (3.3%)

7 / 30
Cid.williams // Wikimedia Commons
#24. Conway County
- Average commute time: 25 minutes
--- #1,241 longest among all counties nationwide
--- 15.2% longer than state average
--- 9.4% shorter than national average
- Workers with 90+ minute commute: 1.36%
- Left for work from 12 a.m. to 6 a.m.: 19.2%
- Worked outside county of residence: 40.8%
- Means of transportation: drove alone (80.7%), carpooled (12.5%), walked (1.2%), public transportation (0%), worked from home (4.2%)

8 / 30
Brandonrush // Wikimedia Commons
#23. Logan County
- Average commute time: 25.5 minutes
--- #1,146 longest among all counties nationwide
--- 17.5% longer than state average
--- 7.6% shorter than national average
- Workers with 90+ minute commute: 3.27%
- Left for work from 12 a.m. to 6 a.m.: 18.7%
- Worked outside county of residence: 31.7%
- Means of transportation: drove alone (80.6%), carpooled (12.3%), walked (1.8%), public transportation (0.4%), worked from home (2.5%)
9 / 30
Canva
#22. Lafayette County
- Average commute time: 25.6 minutes
--- #1,126 longest among all counties nationwide
--- 18.0% longer than state average
--- 7.2% shorter than national average
- Workers with 90+ minute commute: 3.64%
- Left for work from 12 a.m. to 6 a.m.: 17.4%
- Worked outside county of residence: 36.1%
- Means of transportation: drove alone (81.3%), carpooled (10.2%), walked (1.4%), public transportation (0.3%), worked from home (5.1%)

10 / 30
Canva
#21. Lincoln County
- Average commute time: 25.8 minutes
--- #1,087 longest among all counties nationwide
--- 18.9% longer than state average
--- 6.5% shorter than national average
- Workers with 90+ minute commute: 0.89%
- Left for work from 12 a.m. to 6 a.m.: 19.1%
- Worked outside county of residence: 46.5%
- Means of transportation: drove alone (86.1%), carpooled (10.1%), walked (0.9%), public transportation (0.2%), worked from home (2.4%)

11 / 30
User:Rmcclen // Wikimedia Commons
#20. Saline County
- Average commute time: 25.8 minutes
--- #1,087 longest among all counties nationwide
--- 18.9% longer than state average
--- 6.5% shorter than national average
- Workers with 90+ minute commute: 1.08%
- Left for work from 12 a.m. to 6 a.m.: 12.3%
- Worked outside county of residence: 58.4%
- Means of transportation: drove alone (85.1%), carpooled (10.3%), walked (0.6%), public transportation (0.1%), worked from home (2.9%)

12 / 30
NatalieMaynor // Wikimedia Commons
#19. Randolph County
- Average commute time: 25.9 minutes
--- #1,062 longest among all counties nationwide
--- 19.4% longer than state average
--- 6.2% shorter than national average
- Workers with 90+ minute commute: 3.21%
- Left for work from 12 a.m. to 6 a.m.: 22.7%
- Worked outside county of residence: 20.6%
- Means of transportation: drove alone (81.8%), carpooled (11.5%), walked (1.4%), public transportation (0%), worked from home (4.2%)

13 / 30
Michael Barera // Wikimedia Commons
#18. Sevier County
- Average commute time: 26.4 minutes
--- #974 longest among all counties nationwide
--- 21.7% longer than state average
--- 4.3% shorter than national average
- Workers with 90+ minute commute: 2.83%
- Left for work from 12 a.m. to 6 a.m.: 25.1%
- Worked outside county of residence: 22.1%
- Means of transportation: drove alone (71.4%), carpooled (22.9%), walked (0.8%), public transportation (0.2%), worked from home (3.7%)
14 / 30
Canva
#17. Hot Spring County
- Average commute time: 26.6 minutes
--- #934 longest among all counties nationwide
--- 22.6% longer than state average
--- 3.6% shorter than national average
- Workers with 90+ minute commute: 1.90%
- Left for work from 12 a.m. to 6 a.m.: 18.9%
- Worked outside county of residence: 46.7%
- Means of transportation: drove alone (83.2%), carpooled (11.8%), walked (2.6%), public transportation (0.2%), worked from home (1.7%)

15 / 30
Photolitherland // Wikimedia Commons
#16. Lawrence County
- Average commute time: 26.7 minutes
--- #916 longest among all counties nationwide
--- 23.0% longer than state average
--- 3.3% shorter than national average
- Workers with 90+ minute commute: 4.19%
- Left for work from 12 a.m. to 6 a.m.: 19.0%
- Worked outside county of residence: 39.9%
- Means of transportation: drove alone (85.4%), carpooled (9.2%), walked (1.7%), public transportation (0.1%), worked from home (2.8%)
16 / 30
Michael Barera // Wikimedia Commons
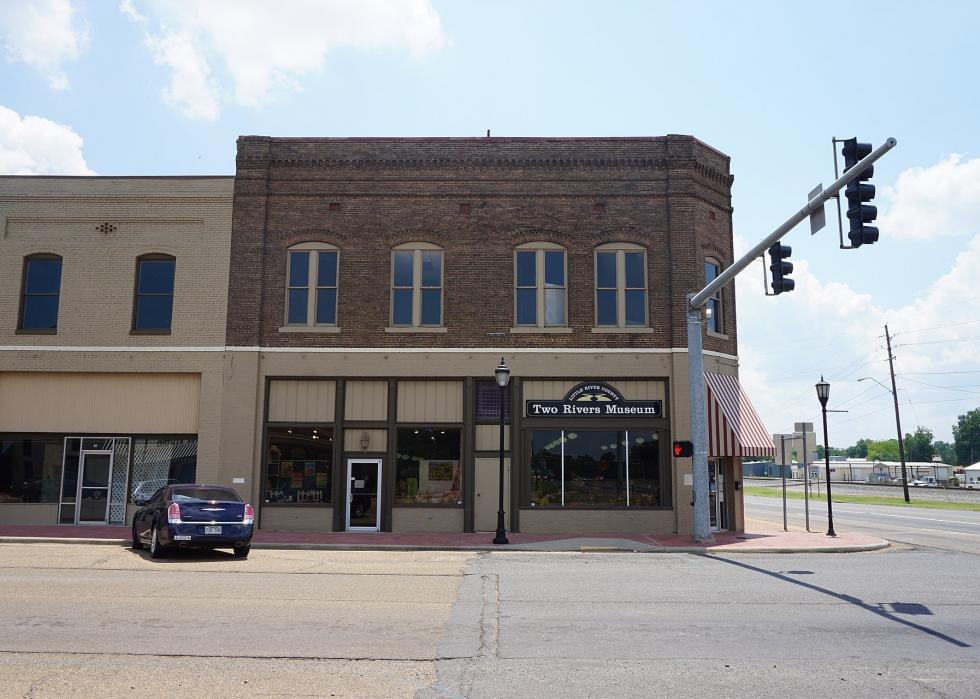
#15. Little River County
- Average commute time: 27 minutes
--- #868 longest among all counties nationwide
--- 24.4% longer than state average
--- 2.2% shorter than national average
- Workers with 90+ minute commute: 2.25%
- Left for work from 12 a.m. to 6 a.m.: 28.6%
- Worked outside county of residence: 24.4%
- Means of transportation: drove alone (87.3%), carpooled (9.7%), walked (1%), public transportation (0%), worked from home (0.5%)

17 / 30
JERRYE & ROY KLOTZ MD // Wikimedia Commons
#14. Searcy County
- Average commute time: 27 minutes
--- #868 longest among all counties nationwide
--- 24.4% longer than state average
--- 2.2% shorter than national average
- Workers with 90+ minute commute: 6.06%
- Left for work from 12 a.m. to 6 a.m.: 21.6%
- Worked outside county of residence: 35.7%
- Means of transportation: drove alone (72.8%), carpooled (17.8%), walked (2.4%), public transportation (0.6%), worked from home (5.3%)

18 / 30
Brandonrush // Wikimedia Commons
#13. Prairie County
- Average commute time: 27.1 minutes
--- #846 longest among all counties nationwide
--- 24.9% longer than state average
--- 1.8% shorter than national average
- Workers with 90+ minute commute: 3.53%
- Left for work from 12 a.m. to 6 a.m.: 22.3%
- Worked outside county of residence: 47.3%
- Means of transportation: drove alone (74.8%), carpooled (11%), walked (2.8%), public transportation (0%), worked from home (8.5%)

19 / 30
Valis55 // Wikimedia Commons
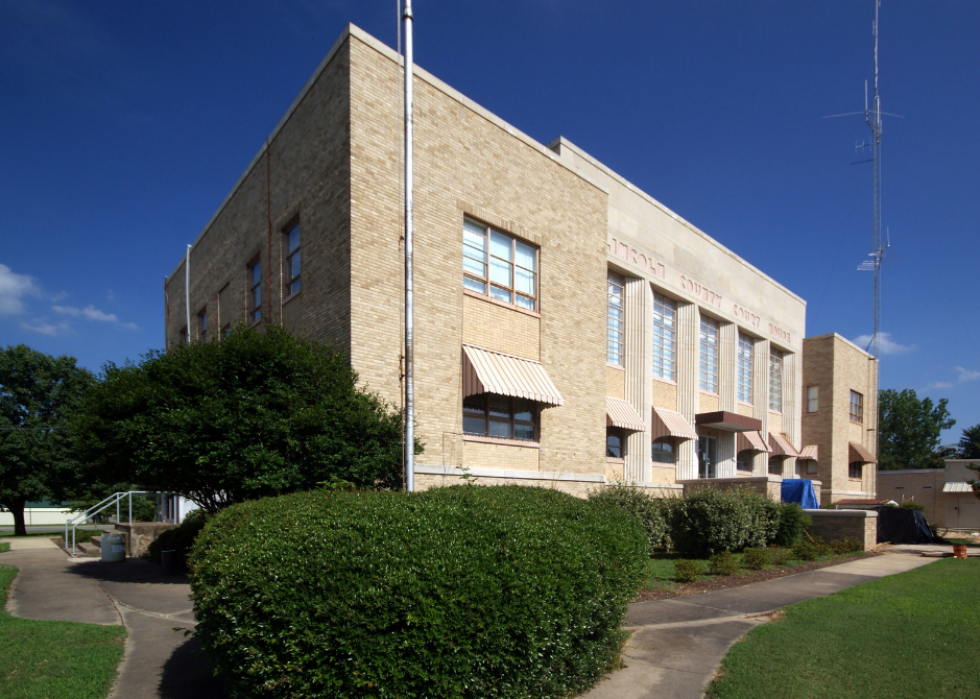
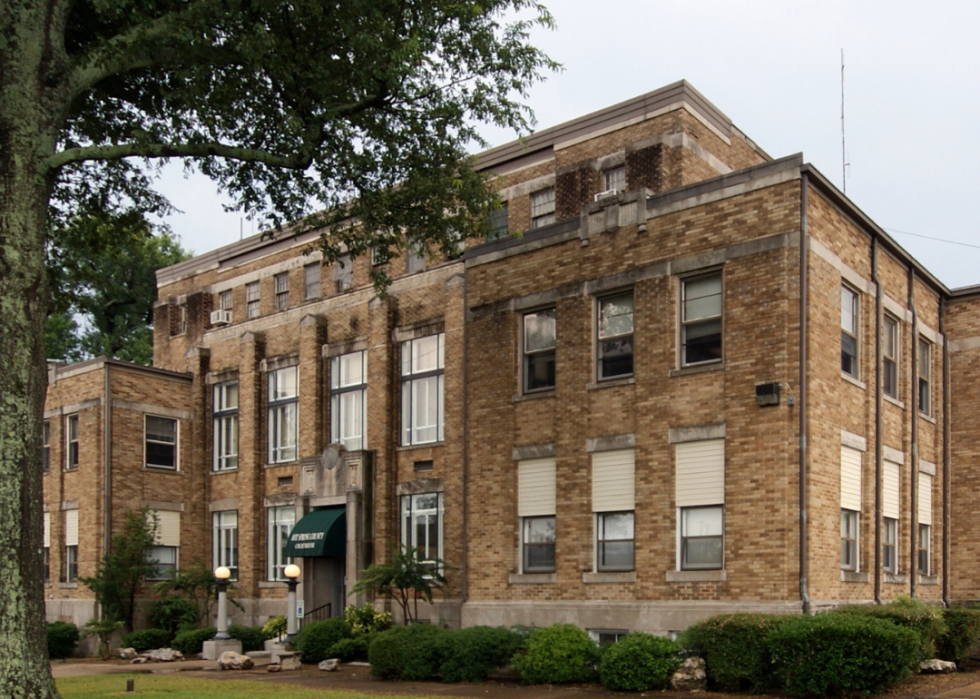
#12. Cleburne County
- Average commute time: 27.2 minutes
--- #829 longest among all counties nationwide
--- 25.3% longer than state average
--- 1.4% shorter than national average
- Workers with 90+ minute commute: 6.23%
- Left for work from 12 a.m. to 6 a.m.: 15.3%
- Worked outside county of residence: 25.8%
- Means of transportation: drove alone (81%), carpooled (11.2%), walked (1.5%), public transportation (0%), worked from home (5.7%)

20 / 30
Valis55 // Wikimedia Commons
#11. Pike County
- Average commute time: 27.7 minutes
--- #763 longest among all counties nationwide
--- 27.6% longer than state average
--- 0.4% longer than national average
- Workers with 90+ minute commute: 3.46%
- Left for work from 12 a.m. to 6 a.m.: 23.2%
- Worked outside county of residence: 47.3%
- Means of transportation: drove alone (79.7%), carpooled (13.2%), walked (2.6%), public transportation (0.1%), worked from home (2.6%)

21 / 30
Brandonrush // Wikimedia Commons
#10. Lonoke County
- Average commute time: 28 minutes
--- #699 longest among all counties nationwide
--- 29.0% longer than state average
--- 1.4% longer than national average
- Workers with 90+ minute commute: 1.21%
- Left for work from 12 a.m. to 6 a.m.: 15.2%
- Worked outside county of residence: 62.9%
- Means of transportation: drove alone (86.6%), carpooled (7.9%), walked (1.2%), public transportation (0.2%), worked from home (3.4%)

22 / 30
Brandonrush // Wikimedia Commons
#9. Nevada County
- Average commute time: 28.5 minutes
--- #631 longest among all counties nationwide
--- 31.3% longer than state average
--- 3.3% longer than national average
- Workers with 90+ minute commute: 3.65%
- Left for work from 12 a.m. to 6 a.m.: 11.9%
- Worked outside county of residence: 51.3%
- Means of transportation: drove alone (84%), carpooled (10.8%), walked (2.3%), public transportation (0.4%), worked from home (2%)

23 / 30
Brandonrush // Wikimedia Commons
#8. Franklin County
- Average commute time: 29.2 minutes
--- #536 longest among all counties nationwide
--- 34.6% longer than state average
--- 5.8% longer than national average
- Workers with 90+ minute commute: 4.43%
- Left for work from 12 a.m. to 6 a.m.: 20.1%
- Worked outside county of residence: 44.2%
- Means of transportation: drove alone (82.5%), carpooled (12.6%), walked (1.6%), public transportation (0.8%), worked from home (1.6%)
24 / 30
Fredlyfish4 // Wikimedia Commons
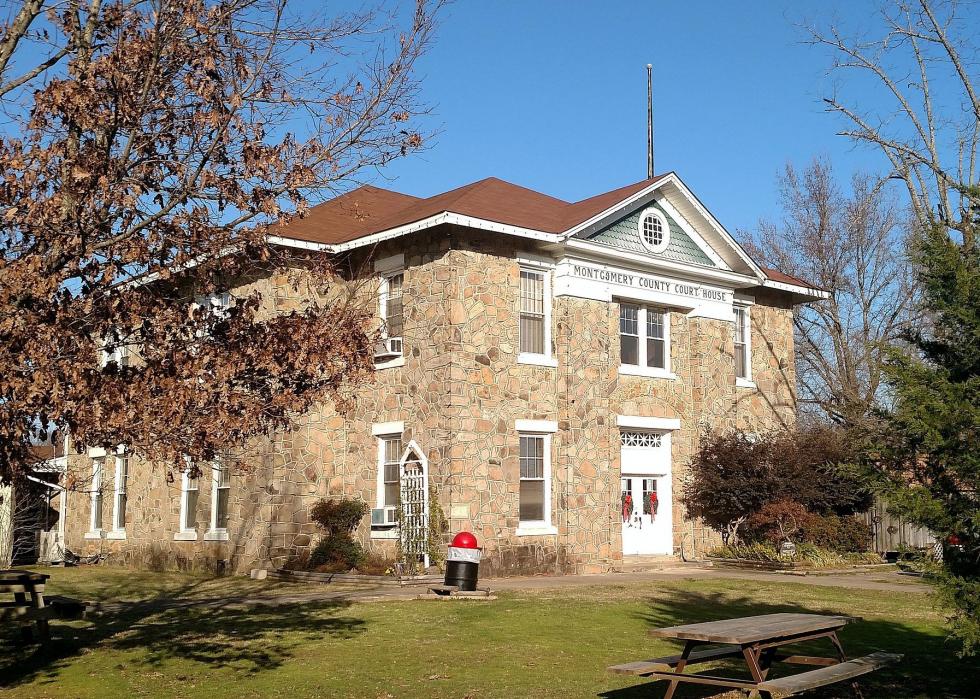
#7. Montgomery County
- Average commute time: 29.2 minutes
--- #536 longest among all counties nationwide
--- 34.6% longer than state average
--- 5.8% longer than national average
- Workers with 90+ minute commute: 5.87%
- Left for work from 12 a.m. to 6 a.m.: 23.4%
- Worked outside county of residence: 44.3%
- Means of transportation: drove alone (80.9%), carpooled (14.9%), walked (0.5%), public transportation (0.2%), worked from home (3%)

25 / 30
Brandonrush // Wikimedia Commons
#6. Grant County
- Average commute time: 30.1 minutes
--- #440 longest among all counties nationwide
--- 38.7% longer than state average
--- 9.1% longer than national average
- Workers with 90+ minute commute: 2.29%
- Left for work from 12 a.m. to 6 a.m.: 27.8%
- Worked outside county of residence: 57.1%
- Means of transportation: drove alone (85.7%), carpooled (9.8%), walked (1.1%), public transportation (0%), worked from home (3%)

26 / 30
Brandonrush // Wikimedia Commons
#5. Van Buren County
- Average commute time: 30.2 minutes
--- #427 longest among all counties nationwide
--- 39.2% longer than state average
--- 9.4% longer than national average
- Workers with 90+ minute commute: 5.39%
- Left for work from 12 a.m. to 6 a.m.: 20.8%
- Worked outside county of residence: 34.7%
- Means of transportation: drove alone (81.5%), carpooled (9.5%), walked (3.2%), public transportation (0%), worked from home (4.4%)

27 / 30
Brandonrush // Wikimedia Commons
#4. Newton County
- Average commute time: 30.7 minutes
--- #371 longest among all counties nationwide
--- 41.5% longer than state average
--- 11.2% longer than national average
- Workers with 90+ minute commute: 5.26%
- Left for work from 12 a.m. to 6 a.m.: 10.3%
- Worked outside county of residence: 45.4%
- Means of transportation: drove alone (82%), carpooled (8.3%), walked (2.8%), public transportation (0%), worked from home (5.6%)
28 / 30
Canva
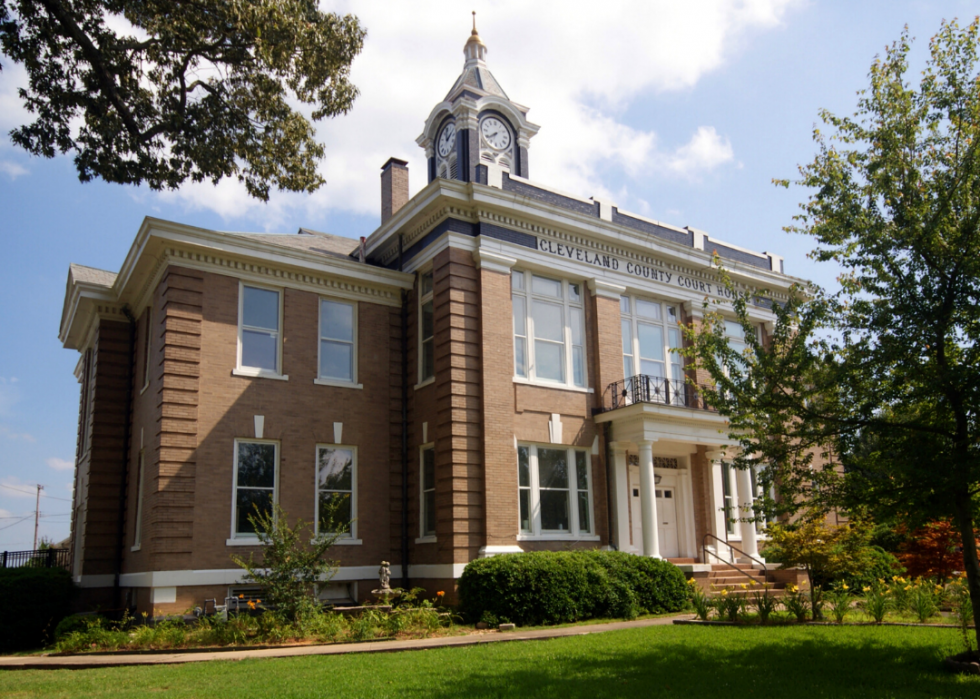
#3. Cleveland County
- Average commute time: 31.2 minutes
--- #327 longest among all counties nationwide
--- 43.8% longer than state average
--- 13.0% longer than national average
- Workers with 90+ minute commute: 4.63%
- Left for work from 12 a.m. to 6 a.m.: 25.7%
- Worked outside county of residence: 72%
- Means of transportation: drove alone (88.5%), carpooled (5%), walked (3.5%), public transportation (0.1%), worked from home (1.5%)

29 / 30
Brandonrush // Wikimedia Commons
#2. Madison County
- Average commute time: 33.9 minutes
--- #144 longest among all counties nationwide
--- 56.2% longer than state average
--- 22.8% longer than national average
- Workers with 90+ minute commute: 2.25%
- Left for work from 12 a.m. to 6 a.m.: 23.0%
- Worked outside county of residence: 51.6%
- Means of transportation: drove alone (83.6%), carpooled (9.7%), walked (0.8%), public transportation (0%), worked from home (4.8%)

30 / 30
Valis55 // Wikimedia Commons
#1. Perry County
- Average commute time: 35.4 minutes
--- #91 longest among all counties nationwide
--- 63.1% longer than state average
--- 28.3% longer than national average
- Workers with 90+ minute commute: 3.29%
- Left for work from 12 a.m. to 6 a.m.: 21.4%
- Worked outside county of residence: 71.2%
- Means of transportation: drove alone (81.9%), carpooled (9.3%), walked (0.6%), public transportation (0%), worked from home (7.5%)


