
Counties with the worst commutes in Georgia
Written by:
April 14, 2021
Canva
Counties with the worst commutes in Georgia
Commuting easily ranks as one of the least enjoyable parts of a person's day. Commuters encounter more physical health problems, and low-income commuters are less likely to gain financial stability—among a host of other negative impacts. And yet, America’s commutes keep getting longer as people move farther away from the office, according to census data.
Stacker compiled a list of counties with the worst commutes in Georgia using data from the U.S. Census Bureau. Counties are ranked by longest average commute time in 2019. Think you have a long trip to work? Read on to compare it against the worst commutes statewide.

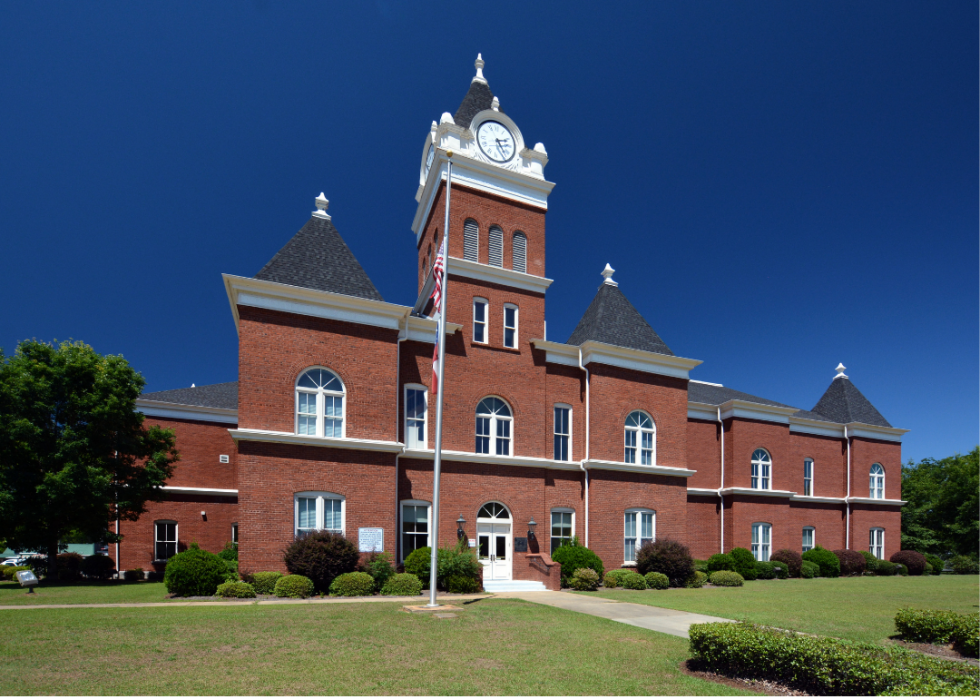
1 / 30
Bubba73 (Jud McCranie) // Wikimedia Commons
#30. Bryan County
- Average commute time: 31.9 minutes
--- #269 longest among all counties nationwide
--- 10.8% longer than state average
--- 15.6% longer than national average
- Workers with 90+ minute commute: 1.53%
- Left for work from 12 a.m. to 6 a.m.: 19.9%
- Worked outside county of residence: 69.7%
- Means of transportation: drove alone (84.5%), carpooled (7.9%), walked (1.3%), public transportation (0%), worked from home (3.7%)

2 / 30
Thomson200 // Wikimedia Commons
#29. Cobb County
- Average commute time: 31.9 minutes
--- #269 longest among all counties nationwide
--- 10.8% longer than state average
--- 15.6% longer than national average
- Workers with 90+ minute commute: 2.80%
- Left for work from 12 a.m. to 6 a.m.: 9.7%
- Worked outside county of residence: 40.9%
- Means of transportation: drove alone (79.3%), carpooled (7.9%), walked (1.1%), public transportation (1%), worked from home (8.7%)

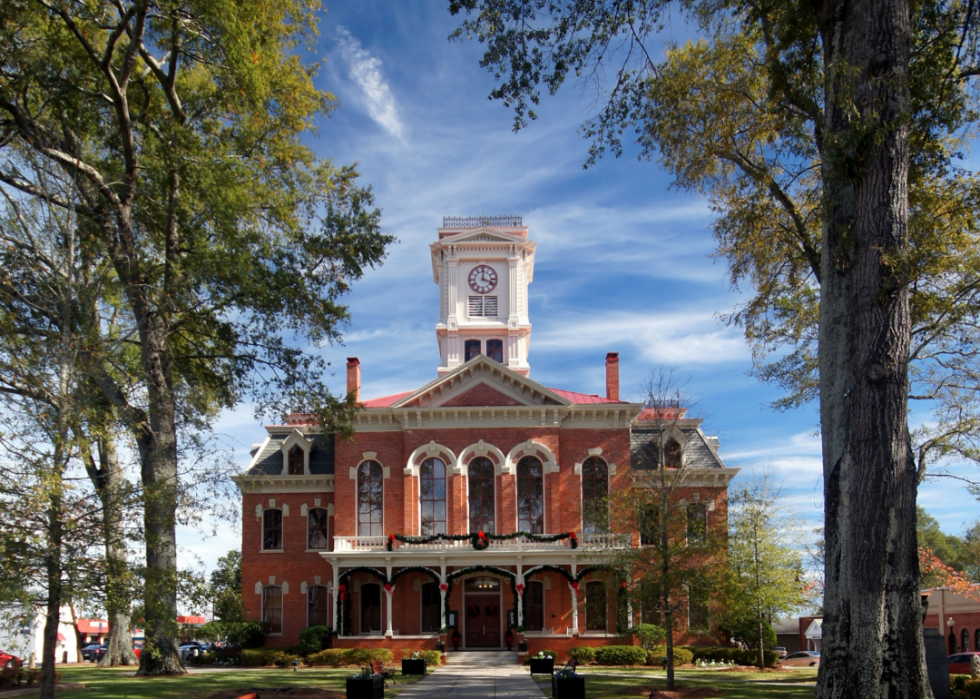
3 / 30
Richardelainechambers // Wikimedia Commons
#28. Banks County
- Average commute time: 31.9 minutes
--- #269 longest among all counties nationwide
--- 10.8% longer than state average
--- 15.6% longer than national average
- Workers with 90+ minute commute: 6.04%
- Left for work from 12 a.m. to 6 a.m.: 17.3%
- Worked outside county of residence: 68%
- Means of transportation: drove alone (80.6%), carpooled (12.3%), walked (1.2%), public transportation (0.1%), worked from home (5.5%)

4 / 30
Canva
#27. Jasper County
- Average commute time: 31.9 minutes
--- #269 longest among all counties nationwide
--- 10.8% longer than state average
--- 15.6% longer than national average
- Workers with 90+ minute commute: 6.29%
- Left for work from 12 a.m. to 6 a.m.: 16.0%
- Worked outside county of residence: 61%
- Means of transportation: drove alone (85.5%), carpooled (8%), walked (0.8%), public transportation (0.1%), worked from home (2.8%)

5 / 30
Farrargirl // Wikimedia Commons
#26. Charlton County
- Average commute time: 32 minutes
--- #263 longest among all counties nationwide
--- 11.1% longer than state average
--- 15.9% longer than national average
- Workers with 90+ minute commute: 2.89%
- Left for work from 12 a.m. to 6 a.m.: 26.5%
- Worked outside county of residence: 26%
- Means of transportation: drove alone (86.7%), carpooled (8.6%), walked (0.1%), public transportation (0.5%), worked from home (2.3%)

6 / 30
PTCdude // Wikimedia Commons
#25. Fayette County
- Average commute time: 32 minutes
--- #263 longest among all counties nationwide
--- 11.1% longer than state average
--- 15.9% longer than national average
- Workers with 90+ minute commute: 4.12%
- Left for work from 12 a.m. to 6 a.m.: 12.7%
- Worked outside county of residence: 47.9%
- Means of transportation: drove alone (78.8%), carpooled (7.9%), walked (0.5%), public transportation (0.9%), worked from home (9.4%)

7 / 30
Rivers Langley; SaveRivers // Wikimedia Commons
#24. Talbot County
- Average commute time: 32.2 minutes
--- #247 longest among all counties nationwide
--- 11.8% longer than state average
--- 16.7% longer than national average
- Workers with 90+ minute commute: 2.07%
- Left for work from 12 a.m. to 6 a.m.: 20.0%
- Worked outside county of residence: 87.7%
- Means of transportation: drove alone (85%), carpooled (10.3%), walked (0.8%), public transportation (0.3%), worked from home (1.4%)

8 / 30
Canva
#23. Taliaferro County
- Average commute time: 32.2 minutes
--- #247 longest among all counties nationwide
--- 11.8% longer than state average
--- 16.7% longer than national average
- Workers with 90+ minute commute: 5.51%
- Left for work from 12 a.m. to 6 a.m.: 29.0%
- Worked outside county of residence: 75%
- Means of transportation: drove alone (75.2%), carpooled (17%), walked (1%), public transportation (0%), worked from home (6.2%)

9 / 30
Truth Falcon // Wikimedia Commons
#22. DeKalb County
- Average commute time: 32.3 minutes
--- #240 longest among all counties nationwide
--- 12.2% longer than state average
--- 17.0% longer than national average
- Workers with 90+ minute commute: 3.55%
- Left for work from 12 a.m. to 6 a.m.: 10.7%
- Worked outside county of residence: 53.3%
- Means of transportation: drove alone (71.6%), carpooled (10.5%), walked (1.6%), public transportation (7.4%), worked from home (7.2%)

10 / 30
Thomson200 // Wikimedia Commons
#21. Clayton County
- Average commute time: 32.3 minutes
--- #240 longest among all counties nationwide
--- 12.2% longer than state average
--- 17.0% longer than national average
- Workers with 90+ minute commute: 3.84%
- Left for work from 12 a.m. to 6 a.m.: 19.4%
- Worked outside county of residence: 60.4%
- Means of transportation: drove alone (76.7%), carpooled (12.2%), walked (1.2%), public transportation (3.3%), worked from home (4.2%)
11 / 30
Canva
#20. Twiggs County
- Average commute time: 32.4 minutes
--- #233 longest among all counties nationwide
--- 12.5% longer than state average
--- 17.4% longer than national average
- Workers with 90+ minute commute: 5.01%
- Left for work from 12 a.m. to 6 a.m.: 17.8%
- Worked outside county of residence: 79.3%
- Means of transportation: drove alone (85.9%), carpooled (5.7%), walked (1%), public transportation (0.4%), worked from home (5.9%)

12 / 30
Michael Rivera // Wikimedia Commons
#19. Butts County
- Average commute time: 32.7 minutes
--- #213 longest among all counties nationwide
--- 13.5% longer than state average
--- 18.5% longer than national average
- Workers with 90+ minute commute: 4.59%
- Left for work from 12 a.m. to 6 a.m.: 17.6%
- Worked outside county of residence: 57.5%
- Means of transportation: drove alone (87.3%), carpooled (5.7%), walked (0.6%), public transportation (0%), worked from home (5.3%)

13 / 30
Upstateherd // Wikimedia Commons
#18. Glascock County
- Average commute time: 32.7 minutes
--- #213 longest among all counties nationwide
--- 13.5% longer than state average
--- 18.5% longer than national average
- Workers with 90+ minute commute: 4.75%
- Left for work from 12 a.m. to 6 a.m.: 16.2%
- Worked outside county of residence: 75.5%
- Means of transportation: drove alone (90%), carpooled (8%), walked (0.2%), public transportation (0%), worked from home (1%)

14 / 30
Thomson200 // Wikimedia Commons
#17. Pickens County
- Average commute time: 32.8 minutes
--- #208 longest among all counties nationwide
--- 13.9% longer than state average
--- 18.8% longer than national average
- Workers with 90+ minute commute: 6.65%
- Left for work from 12 a.m. to 6 a.m.: 19.8%
- Worked outside county of residence: 48.3%
- Means of transportation: drove alone (77.7%), carpooled (11.5%), walked (1%), public transportation (0.5%), worked from home (8.2%)

15 / 30
Canva
#16. Newton County
- Average commute time: 32.9 minutes
--- #202 longest among all counties nationwide
--- 14.2% longer than state average
--- 19.2% longer than national average
- Workers with 90+ minute commute: 4.92%
- Left for work from 12 a.m. to 6 a.m.: 21.8%
- Worked outside county of residence: 59.6%
- Means of transportation: drove alone (81.1%), carpooled (10.4%), walked (0.8%), public transportation (0.7%), worked from home (4.7%)

16 / 30
Skarg // Wikimedia Commons
#15. Rockdale County
- Average commute time: 32.9 minutes
--- #202 longest among all counties nationwide
--- 14.2% longer than state average
--- 19.2% longer than national average
- Workers with 90+ minute commute: 5.15%
- Left for work from 12 a.m. to 6 a.m.: 18.9%
- Worked outside county of residence: 53.6%
- Means of transportation: drove alone (79.1%), carpooled (11%), walked (0.5%), public transportation (1%), worked from home (6.6%)

17 / 30
Kåre Thor Olsen // Wikimedia Commons
#14. Douglas County
- Average commute time: 33 minutes
--- #195 longest among all counties nationwide
--- 14.6% longer than state average
--- 19.6% longer than national average
- Workers with 90+ minute commute: 3.79%
- Left for work from 12 a.m. to 6 a.m.: 18.3%
- Worked outside county of residence: 61.3%
- Means of transportation: drove alone (82.1%), carpooled (8.9%), walked (0.6%), public transportation (0.8%), worked from home (5.8%)
18 / 30
Canva
#13. Walton County
- Average commute time: 33.3 minutes
--- #180 longest among all counties nationwide
--- 15.6% longer than state average
--- 20.7% longer than national average
- Workers with 90+ minute commute: 4.84%
- Left for work from 12 a.m. to 6 a.m.: 17.7%
- Worked outside county of residence: 58.3%
- Means of transportation: drove alone (81.8%), carpooled (10.8%), walked (1.3%), public transportation (0.1%), worked from home (4.6%)

19 / 30
Michael Rivera // Wikimedia Commons
#12. Pike County
- Average commute time: 33.4 minutes
--- #171 longest among all counties nationwide
--- 16.0% longer than state average
--- 21.0% longer than national average
- Workers with 90+ minute commute: 4.10%
- Left for work from 12 a.m. to 6 a.m.: 19.3%
- Worked outside county of residence: 75.4%
- Means of transportation: drove alone (88%), carpooled (8.7%), walked (0.3%), public transportation (0.2%), worked from home (2.7%)

20 / 30
Thomson200 // Wikimedia Commons
#11. Forsyth County
- Average commute time: 33.6 minutes
--- #160 longest among all counties nationwide
--- 16.7% longer than state average
--- 21.7% longer than national average
- Workers with 90+ minute commute: 4.55%
- Left for work from 12 a.m. to 6 a.m.: 10.6%
- Worked outside county of residence: 50.8%
- Means of transportation: drove alone (77.7%), carpooled (8.1%), walked (0.5%), public transportation (0.6%), worked from home (11.9%)

21 / 30
csmith/dbb1 // Wikimedia Commons
#10. Henry County
- Average commute time: 33.9 minutes
--- #144 longest among all counties nationwide
--- 17.7% longer than state average
--- 22.8% longer than national average
- Workers with 90+ minute commute: 4.26%
- Left for work from 12 a.m. to 6 a.m.: 18.4%
- Worked outside county of residence: 54.7%
- Means of transportation: drove alone (81.6%), carpooled (8.8%), walked (0.4%), public transportation (1%), worked from home (7.2%)

22 / 30
Thomson200 // Wikimedia Commons
#9. Dawson County
- Average commute time: 33.9 minutes
--- #144 longest among all counties nationwide
--- 17.7% longer than state average
--- 22.8% longer than national average
- Workers with 90+ minute commute: 5.08%
- Left for work from 12 a.m. to 6 a.m.: 17.8%
- Worked outside county of residence: 60.4%
- Means of transportation: drove alone (79.7%), carpooled (9.5%), walked (0.9%), public transportation (0%), worked from home (9.4%)

23 / 30
John Trainor // Wikimedia Commons
#8. Gwinnett County
- Average commute time: 34.1 minutes
--- #136 longest among all counties nationwide
--- 18.4% longer than state average
--- 23.6% longer than national average
- Workers with 90+ minute commute: 3.83%
- Left for work from 12 a.m. to 6 a.m.: 12.0%
- Worked outside county of residence: 40.9%
- Means of transportation: drove alone (78.9%), carpooled (11.4%), walked (0.9%), public transportation (1.1%), worked from home (6.4%)

24 / 30
Ashley.farrow // Wikimedia Commons
#7. Barrow County
- Average commute time: 34.7 minutes
--- #114 longest among all counties nationwide
--- 20.5% longer than state average
--- 25.7% longer than national average
- Workers with 90+ minute commute: 5.65%
- Left for work from 12 a.m. to 6 a.m.: 19.4%
- Worked outside county of residence: 67.2%
- Means of transportation: drove alone (83%), carpooled (11.4%), walked (0.5%), public transportation (0.3%), worked from home (3.9%)

25 / 30
JERRYE & ROY KLOTZ MD // Wikimedia Commons
#6. Lincoln County
- Average commute time: 35 minutes
--- #101 longest among all counties nationwide
--- 21.5% longer than state average
--- 26.8% longer than national average
- Workers with 90+ minute commute: 6.17%
- Left for work from 12 a.m. to 6 a.m.: 19.1%
- Worked outside county of residence: 49.6%
- Means of transportation: drove alone (88.5%), carpooled (5.7%), walked (0.6%), public transportation (0.3%), worked from home (2.9%)

26 / 30
Thomson M // Wikimedia Commons
#5. Cherokee County
- Average commute time: 35.4 minutes
--- #91 longest among all counties nationwide
--- 22.9% longer than state average
--- 28.3% longer than national average
- Workers with 90+ minute commute: 5.06%
- Left for work from 12 a.m. to 6 a.m.: 13.4%
- Worked outside county of residence: 54.9%
- Means of transportation: drove alone (79.5%), carpooled (8.5%), walked (0.8%), public transportation (0.5%), worked from home (9.5%)
27 / 30
Canva
#4. Heard County
- Average commute time: 35.4 minutes
--- #91 longest among all counties nationwide
--- 22.9% longer than state average
--- 28.3% longer than national average
- Workers with 90+ minute commute: 8.33%
- Left for work from 12 a.m. to 6 a.m.: 26.2%
- Worked outside county of residence: 67.4%
- Means of transportation: drove alone (83.5%), carpooled (13.1%), walked (0.4%), public transportation (0.2%), worked from home (1.9%)

28 / 30
SaveRivers // Wikimedia Commons
#3. Meriwether County
- Average commute time: 35.9 minutes
--- #77 longest among all counties nationwide
--- 24.7% longer than state average
--- 30.1% longer than national average
- Workers with 90+ minute commute: 5.62%
- Left for work from 12 a.m. to 6 a.m.: 21.5%
- Worked outside county of residence: 70%
- Means of transportation: drove alone (81.9%), carpooled (11.9%), walked (2.8%), public transportation (0.4%), worked from home (1.8%)

29 / 30
Rivers Langley; SaveRivers // Wikimedia Commons
#2. Marion County
- Average commute time: 36.4 minutes
--- #69 longest among all counties nationwide
--- 26.4% longer than state average
--- 31.9% longer than national average
- Workers with 90+ minute commute: 6.54%
- Left for work from 12 a.m. to 6 a.m.: 17.9%
- Worked outside county of residence: 64.2%
- Means of transportation: drove alone (82.1%), carpooled (9.8%), walked (0.5%), public transportation (1.3%), worked from home (4.2%)

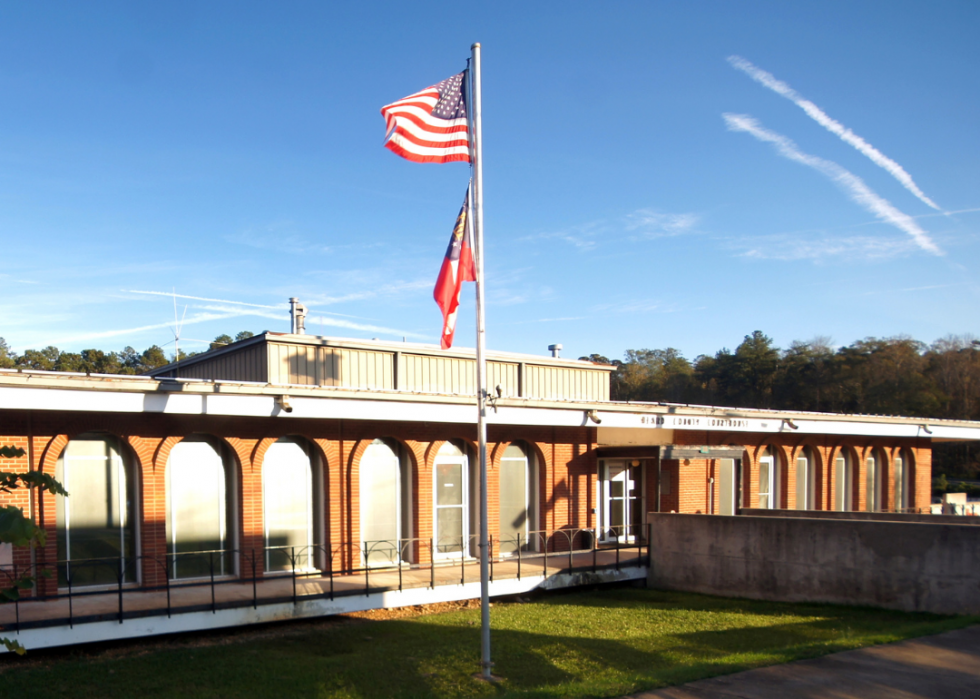
30 / 30
Canva
#1. Paulding County
- Average commute time: 38.6 minutes
--- #35 longest among all counties nationwide
--- 34.0% longer than state average
--- 39.9% longer than national average
- Workers with 90+ minute commute: 6.68%
- Left for work from 12 a.m. to 6 a.m.: 18.8%
- Worked outside county of residence: 65.7%
- Means of transportation: drove alone (83.8%), carpooled (7.6%), walked (0.5%), public transportation (0.4%), worked from home (7%)


