
Counties with the worst commutes in Indiana
Written by:
April 14, 2021
Warren LeMay from Cullowhee, NC, United States // Wikimedia Commons
Counties with the worst commutes in Indiana
Commuting easily ranks as one of the least enjoyable parts of a person's day. Commuters encounter more physical health problems, and low-income commuters are less likely to gain financial stability—among a host of other negative impacts. And yet, America’s commutes keep getting longer as people move farther away from the office, according to census data.
Stacker compiled a list of counties with the worst commutes in Indiana using data from the U.S. Census Bureau. Counties are ranked by longest average commute time in 2019. Think you have a long trip to work? Read on to compare it against the worst commutes statewide.

1 / 30
Nyttend // Wikimedia Commons
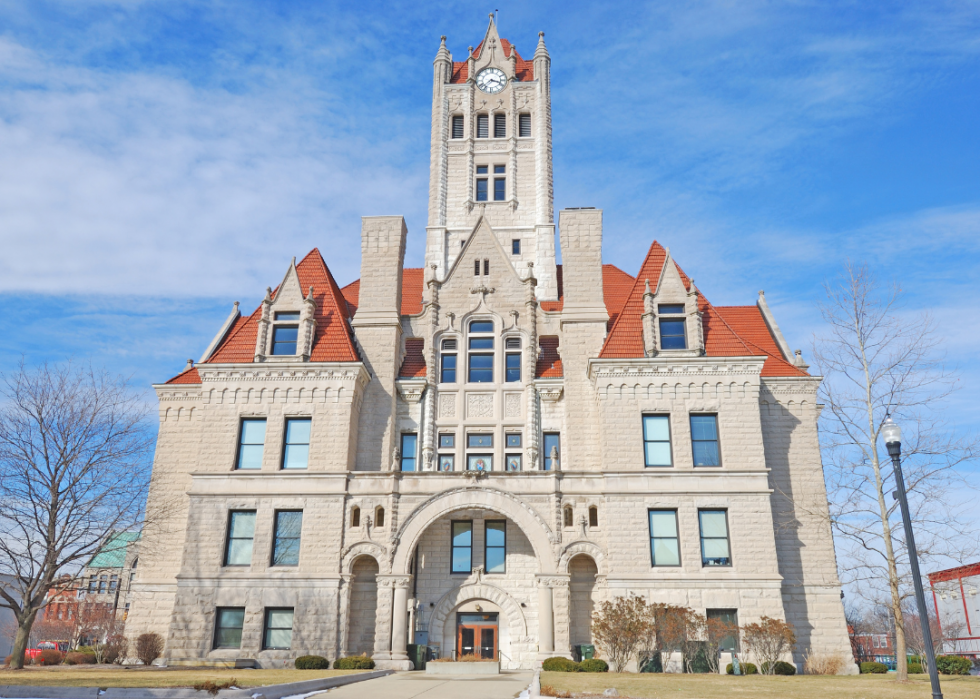
#30. Putnam County
- Average commute time: 26 minutes
--- #1,044 longest among all counties nationwide
--- 9.2% longer than state average
--- 5.8% shorter than national average
- Workers with 90+ minute commute: 2.45%
- Left for work from 12 a.m. to 6 a.m.: 18.1%
- Worked outside county of residence: 33.5%
- Means of transportation: drove alone (81%), carpooled (8.2%), walked (4.9%), public transportation (0%), worked from home (4.8%)

2 / 30
Nyttend // Wikimedia Commons
#29. Daviess County
- Average commute time: 26 minutes
--- #1,044 longest among all counties nationwide
--- 9.2% longer than state average
--- 5.8% shorter than national average
- Workers with 90+ minute commute: 5.00%
- Left for work from 12 a.m. to 6 a.m.: 22.3%
- Worked outside county of residence: 31.5%
- Means of transportation: drove alone (73.1%), carpooled (18%), walked (2.8%), public transportation (0.2%), worked from home (2.6%)

3 / 30
Nyttend // Wikimedia Commons
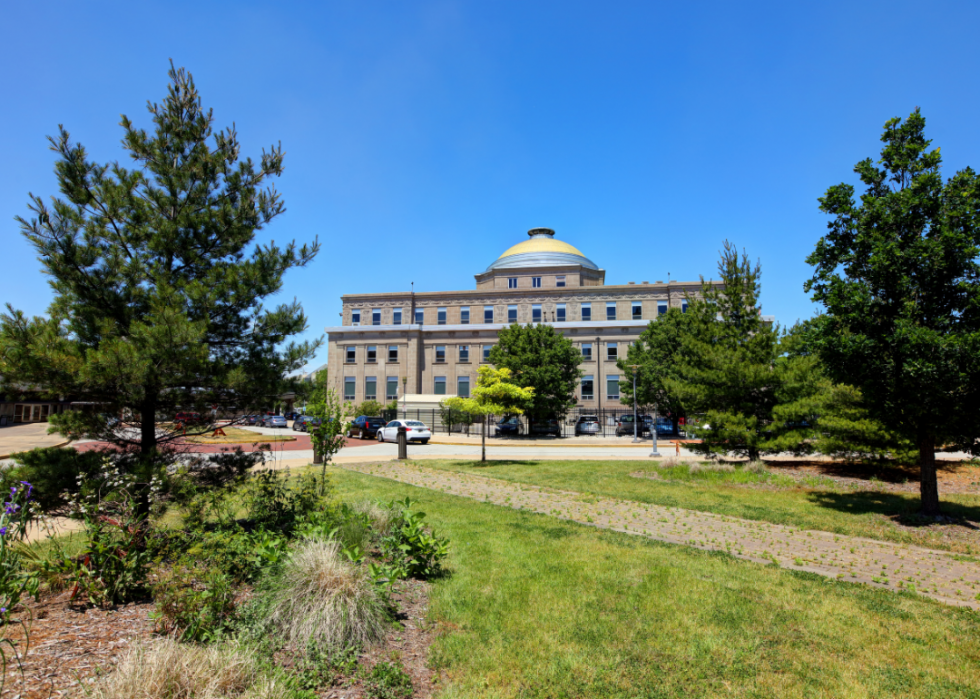
#28. Madison County
- Average commute time: 26.2 minutes
--- #1,012 longest among all counties nationwide
--- 10.1% longer than state average
--- 5.1% shorter than national average
- Workers with 90+ minute commute: 1.92%
- Left for work from 12 a.m. to 6 a.m.: 14.9%
- Worked outside county of residence: 41.7%
- Means of transportation: drove alone (81.4%), carpooled (11.1%), walked (2.1%), public transportation (0.3%), worked from home (4%)

4 / 30
Nyttend // Wikimedia Commons
#27. Spencer County
- Average commute time: 26.3 minutes
--- #992 longest among all counties nationwide
--- 10.5% longer than state average
--- 4.7% shorter than national average
- Workers with 90+ minute commute: 1.84%
- Left for work from 12 a.m. to 6 a.m.: 25.4%
- Worked outside county of residence: 44.4%
- Means of transportation: drove alone (85.9%), carpooled (6.4%), walked (0.9%), public transportation (0.1%), worked from home (5.9%)
5 / 30
Canva
#26. Hancock County
- Average commute time: 26.7 minutes
--- #916 longest among all counties nationwide
--- 12.2% longer than state average
--- 3.3% shorter than national average
- Workers with 90+ minute commute: 1.43%
- Left for work from 12 a.m. to 6 a.m.: 11.8%
- Worked outside county of residence: 61.1%
- Means of transportation: drove alone (88.4%), carpooled (6.1%), walked (1%), public transportation (0.1%), worked from home (3.9%)

6 / 30
Paul J Everett // Wikimedia Commons
#25. Hendricks County
- Average commute time: 26.8 minutes
--- #903 longest among all counties nationwide
--- 12.6% longer than state average
--- 2.9% shorter than national average
- Workers with 90+ minute commute: 1.66%
- Left for work from 12 a.m. to 6 a.m.: 11.8%
- Worked outside county of residence: 55.5%
- Means of transportation: drove alone (85%), carpooled (7%), walked (0.8%), public transportation (0.1%), worked from home (5.8%)

7 / 30
Warren LeMay from Cullowhee, NC, United States // Wikimedia Commons
#24. Fayette County
- Average commute time: 26.8 minutes
--- #903 longest among all counties nationwide
--- 12.6% longer than state average
--- 2.9% shorter than national average
- Workers with 90+ minute commute: 3.39%
- Left for work from 12 a.m. to 6 a.m.: 22.6%
- Worked outside county of residence: 39.3%
- Means of transportation: drove alone (86.6%), carpooled (6.9%), walked (1.5%), public transportation (0.2%), worked from home (3.2%)

8 / 30
User:Mingusboodle // Wikimedia Commons
#23. Johnson County
- Average commute time: 26.9 minutes
--- #886 longest among all counties nationwide
--- 13.0% longer than state average
--- 2.5% shorter than national average
- Workers with 90+ minute commute: 1.31%
- Left for work from 12 a.m. to 6 a.m.: 13.5%
- Worked outside county of residence: 55%
- Means of transportation: drove alone (85.2%), carpooled (7.8%), walked (1.1%), public transportation (0.5%), worked from home (4.8%)

9 / 30
Publichall // Wikimedia Commons
#22. Henry County
- Average commute time: 27.3 minutes
--- #815 longest among all counties nationwide
--- 14.7% longer than state average
--- 1.1% shorter than national average
- Workers with 90+ minute commute: 2.63%
- Left for work from 12 a.m. to 6 a.m.: 17.7%
- Worked outside county of residence: 46.8%
- Means of transportation: drove alone (84.9%), carpooled (9.4%), walked (1%), public transportation (0.1%), worked from home (3.8%)

10 / 30
Nyttend // Wikimedia Commons
#21. Benton County
- Average commute time: 27.6 minutes
--- #782 longest among all counties nationwide
--- 16.0% longer than state average
--- 0.0% shorter than national average
- Workers with 90+ minute commute: 2.26%
- Left for work from 12 a.m. to 6 a.m.: 17.1%
- Worked outside county of residence: 55.1%
- Means of transportation: drove alone (80.6%), carpooled (10.5%), walked (2.4%), public transportation (0.2%), worked from home (5.5%)

11 / 30
Chris Light // Wikimedia Commons
#20. Porter County
- Average commute time: 27.8 minutes
--- #741 longest among all counties nationwide
--- 16.8% longer than state average
--- 0.7% longer than national average
- Workers with 90+ minute commute: 3.36%
- Left for work from 12 a.m. to 6 a.m.: 17.2%
- Worked outside county of residence: 34.1%
- Means of transportation: drove alone (85.9%), carpooled (5.9%), walked (1.5%), public transportation (1.1%), worked from home (4.6%)

12 / 30
Daniel Schwen // Wikimedia Commons
#19. Parke County
- Average commute time: 27.8 minutes
--- #741 longest among all counties nationwide
--- 16.8% longer than state average
--- 0.7% longer than national average
- Workers with 90+ minute commute: 4.69%
- Left for work from 12 a.m. to 6 a.m.: 22.8%
- Worked outside county of residence: 53.3%
- Means of transportation: drove alone (80%), carpooled (10.5%), walked (1.8%), public transportation (0.4%), worked from home (5.5%)

13 / 30
Canva
#18. Jasper County
- Average commute time: 28.1 minutes
--- #685 longest among all counties nationwide
--- 18.1% longer than state average
--- 1.8% longer than national average
- Workers with 90+ minute commute: 2.78%
- Left for work from 12 a.m. to 6 a.m.: 27.9%
- Worked outside county of residence: 40%
- Means of transportation: drove alone (85.2%), carpooled (7.4%), walked (1.9%), public transportation (0.4%), worked from home (3.7%)

14 / 30
Nyttend // Wikimedia Commons
#17. Greene County
- Average commute time: 28.3 minutes
--- #663 longest among all counties nationwide
--- 18.9% longer than state average
--- 2.5% longer than national average
- Workers with 90+ minute commute: 2.79%
- Left for work from 12 a.m. to 6 a.m.: 17.1%
- Worked outside county of residence: 56.6%
- Means of transportation: drove alone (85.6%), carpooled (10.1%), walked (1.6%), public transportation (0.2%), worked from home (1%)

15 / 30
Warren LeMay from Cullowhee, NC, United States // Wikimedia Commons
#16. Ripley County
- Average commute time: 28.4 minutes
--- #642 longest among all counties nationwide
--- 19.3% longer than state average
--- 2.9% longer than national average
- Workers with 90+ minute commute: 3.14%
- Left for work from 12 a.m. to 6 a.m.: 22.7%
- Worked outside county of residence: 32.5%
- Means of transportation: drove alone (84%), carpooled (10%), walked (1.9%), public transportation (0.3%), worked from home (2.4%)

16 / 30
Publichall // Wikimedia Commons
#15. Carroll County
- Average commute time: 28.6 minutes
--- #615 longest among all counties nationwide
--- 20.2% longer than state average
--- 3.6% longer than national average
- Workers with 90+ minute commute: 2.75%
- Left for work from 12 a.m. to 6 a.m.: 24.1%
- Worked outside county of residence: 67.9%
- Means of transportation: drove alone (85.2%), carpooled (9.8%), walked (1.8%), public transportation (0.3%), worked from home (2.1%)

17 / 30
William Eccles // Wikimedia Commons
#14. Clay County
- Average commute time: 29 minutes
--- #567 longest among all counties nationwide
--- 21.8% longer than state average
--- 5.1% longer than national average
- Workers with 90+ minute commute: 3.56%
- Left for work from 12 a.m. to 6 a.m.: 24.7%
- Worked outside county of residence: 57.2%
- Means of transportation: drove alone (83.3%), carpooled (12.3%), walked (0.9%), public transportation (0.1%), worked from home (2.3%)

18 / 30
Warren LeMay from Cullowhee, NC, United States // Wikimedia Commons
#13. Ohio County
- Average commute time: 29.1 minutes
--- #548 longest among all counties nationwide
--- 22.3% longer than state average
--- 5.4% longer than national average
- Workers with 90+ minute commute: 1.06%
- Left for work from 12 a.m. to 6 a.m.: 22.6%
- Worked outside county of residence: 41.7%
- Means of transportation: drove alone (83.8%), carpooled (9.5%), walked (3.1%), public transportation (0.1%), worked from home (1.8%)

19 / 30
Nyttend // Wikimedia Commons
#12. Morgan County
- Average commute time: 29.1 minutes
--- #548 longest among all counties nationwide
--- 22.3% longer than state average
--- 5.4% longer than national average
- Workers with 90+ minute commute: 1.08%
- Left for work from 12 a.m. to 6 a.m.: 18.1%
- Worked outside county of residence: 62.8%
- Means of transportation: drove alone (84.9%), carpooled (9.4%), walked (1.3%), public transportation (0.1%), worked from home (3.5%)
20 / 30
Canva
#11. Lake County
- Average commute time: 29.2 minutes
--- #536 longest among all counties nationwide
--- 22.7% longer than state average
--- 5.8% longer than national average
- Workers with 90+ minute commute: 3.52%
- Left for work from 12 a.m. to 6 a.m.: 19.2%
- Worked outside county of residence: 6.8%
- Means of transportation: drove alone (83.6%), carpooled (7.7%), walked (1.2%), public transportation (2.9%), worked from home (2.9%)

21 / 30
Warren LeMay from Cullowhee, NC, United States // Wikimedia Commons
#10. Dearborn County
- Average commute time: 29.4 minutes
--- #507 longest among all counties nationwide
--- 23.5% longer than state average
--- 6.5% longer than national average
- Workers with 90+ minute commute: 2.01%
- Left for work from 12 a.m. to 6 a.m.: 17.4%
- Worked outside county of residence: 8.3%
- Means of transportation: drove alone (85.8%), carpooled (8%), walked (1.6%), public transportation (0.4%), worked from home (3.6%)

22 / 30
Chris Light // Wikimedia Commons
#9. Starke County
- Average commute time: 29.5 minutes
--- #492 longest among all counties nationwide
--- 23.9% longer than state average
--- 6.9% longer than national average
- Workers with 90+ minute commute: 3.93%
- Left for work from 12 a.m. to 6 a.m.: 28.4%
- Worked outside county of residence: 57.2%
- Means of transportation: drove alone (83.6%), carpooled (11.9%), walked (0.5%), public transportation (0.2%), worked from home (2.8%)

23 / 30
Nyttend // Wikimedia Commons
#8. Franklin County
- Average commute time: 29.6 minutes
--- #485 longest among all counties nationwide
--- 24.4% longer than state average
--- 7.2% longer than national average
- Workers with 90+ minute commute: 2.46%
- Left for work from 12 a.m. to 6 a.m.: 21.4%
- Worked outside county of residence: 35.7%
- Means of transportation: drove alone (86.6%), carpooled (5.9%), walked (1.1%), public transportation (0.3%), worked from home (5.2%)

24 / 30
Nyttend // Wikimedia Commons
#7. Newton County
- Average commute time: 30.7 minutes
--- #371 longest among all counties nationwide
--- 29.0% longer than state average
--- 11.2% longer than national average
- Workers with 90+ minute commute: 5.42%
- Left for work from 12 a.m. to 6 a.m.: 31.0%
- Worked outside county of residence: 54.9%
- Means of transportation: drove alone (82.3%), carpooled (12.3%), walked (1.5%), public transportation (0.5%), worked from home (2.3%)

25 / 30
W.marsh // Wikimedia Commons
#6. Harrison County
- Average commute time: 31.3 minutes
--- #316 longest among all counties nationwide
--- 31.5% longer than state average
--- 13.4% longer than national average
- Workers with 90+ minute commute: 1.21%
- Left for work from 12 a.m. to 6 a.m.: 15.9%
- Worked outside county of residence: 28.2%
- Means of transportation: drove alone (87.1%), carpooled (8%), walked (1.4%), public transportation (0.1%), worked from home (3%)

26 / 30
Calvin Beale // Wikimedia Commons
#5. Owen County
- Average commute time: 31.4 minutes
--- #307 longest among all counties nationwide
--- 31.9% longer than state average
--- 13.8% longer than national average
- Workers with 90+ minute commute: 5.37%
- Left for work from 12 a.m. to 6 a.m.: 23.3%
- Worked outside county of residence: 55.3%
- Means of transportation: drove alone (81.9%), carpooled (10.8%), walked (1.9%), public transportation (0.4%), worked from home (3.8%)

27 / 30
emu4286 // Wikimedia Commons
#4. Washington County
- Average commute time: 32.3 minutes
--- #240 longest among all counties nationwide
--- 35.7% longer than state average
--- 17.0% longer than national average
- Workers with 90+ minute commute: 4.02%
- Left for work from 12 a.m. to 6 a.m.: 21.9%
- Worked outside county of residence: 39.4%
- Means of transportation: drove alone (83.4%), carpooled (9.9%), walked (1.4%), public transportation (0.2%), worked from home (4.5%)

28 / 30
MrGreenBean // Wikimedia Commons
#3. Brown County
- Average commute time: 33.8 minutes
--- #151 longest among all counties nationwide
--- 42.0% longer than state average
--- 22.5% longer than national average
- Workers with 90+ minute commute: 5.04%
- Left for work from 12 a.m. to 6 a.m.: 19.0%
- Worked outside county of residence: 60.7%
- Means of transportation: drove alone (80.8%), carpooled (11.4%), walked (1.7%), public transportation (0.1%), worked from home (5.7%)

29 / 30
Nyttend // Wikimedia Commons
#2. Crawford County
- Average commute time: 34.7 minutes
--- #114 longest among all counties nationwide
--- 45.8% longer than state average
--- 25.7% longer than national average
- Workers with 90+ minute commute: 3.96%
- Left for work from 12 a.m. to 6 a.m.: 27.0%
- Worked outside county of residence: 53.8%
- Means of transportation: drove alone (81.5%), carpooled (11.4%), walked (1.2%), public transportation (0.5%), worked from home (3.9%)

30 / 30
Warren LeMay from Cullowhee, NC, United States // Wikimedia Commons
#1. Switzerland County
- Average commute time: 36.2 minutes
--- #72 longest among all counties nationwide
--- 52.1% longer than state average
--- 31.2% longer than national average
- Workers with 90+ minute commute: 6.08%
- Left for work from 12 a.m. to 6 a.m.: 26.0%
- Worked outside county of residence: 28%
- Means of transportation: drove alone (81.5%), carpooled (12.5%), walked (1.2%), public transportation (0%), worked from home (3.6%)


