
Counties with the worst commutes in Massachusetts
Written by:
April 14, 2021
Jameslwoodward // Wikimedia Commons
Counties with the worst commutes in Massachusetts
Commuting easily ranks as one of the least enjoyable parts of a person's day. Commuters encounter more physical health problems, and low-income commuters are less likely to gain financial stability—among a host of other negative impacts. And yet, America’s commutes keep getting longer as people move farther away from the office, according to census data.
Stacker compiled a list of counties with the worst commutes in Massachusetts using data from the U.S. Census Bureau. Counties are ranked by longest average commute time in 2019. Think you have a long trip to work? Read on to compare it against the worst commutes statewide.

1 / 14
thisisbossi // Wikimedia Commons
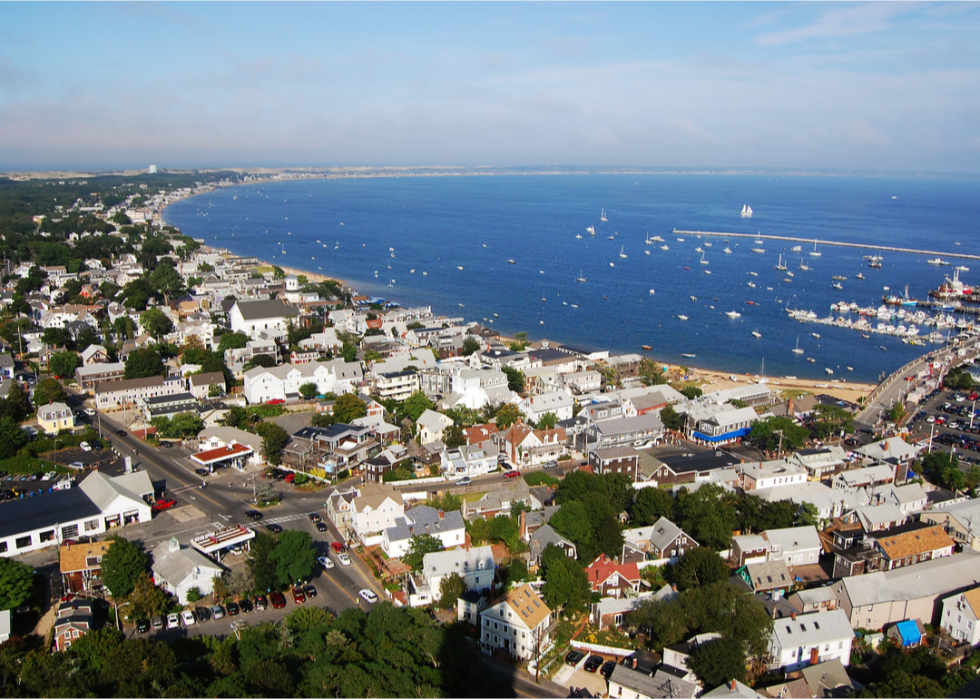
#14. Nantucket
- Average commute time: 12 minutes
--- #3,097 longest among all counties nationwide
--- 60.3% shorter than state average
--- 56.5% shorter than national average
- Workers with 90+ minute commute: 1.28%
- Left for work from 12 a.m. to 6 a.m.: 2.8%
- Worked outside county of residence: 2.2%
- Means of transportation: drove alone (72%), carpooled (7.5%), walked (10.3%), public transportation (0.7%), worked from home (7%)

2 / 14
Jwgetchell // Wikimedia Commons
#13. Dukes County
- Average commute time: 12.6 minutes
--- #3,077 longest among all counties nationwide
--- 58.3% shorter than state average
--- 54.3% shorter than national average
- Workers with 90+ minute commute: 0.22%
- Left for work from 12 a.m. to 6 a.m.: 3.0%
- Worked outside county of residence: 1.8%
- Means of transportation: drove alone (73.6%), carpooled (5.2%), walked (3.5%), public transportation (1.1%), worked from home (12.5%)

3 / 14
Protophobic // Wikimedia Commons
#12. Berkshire County
- Average commute time: 19.8 minutes
--- #2,351 longest among all counties nationwide
--- 34.4% shorter than state average
--- 28.3% shorter than national average
- Workers with 90+ minute commute: 1.68%
- Left for work from 12 a.m. to 6 a.m.: 8.5%
- Worked outside county of residence: 2.7%
- Means of transportation: drove alone (76.5%), carpooled (8.5%), walked (6.4%), public transportation (1.3%), worked from home (5.9%)

4 / 14
Real Window Creative // Shutterstock
#11. Hampden County
- Average commute time: 22.9 minutes
--- #1,733 longest among all counties nationwide
--- 24.2% shorter than state average
--- 17.0% shorter than national average
- Workers with 90+ minute commute: 1.58%
- Left for work from 12 a.m. to 6 a.m.: 11.2%
- Worked outside county of residence: 9.8%
- Means of transportation: drove alone (82%), carpooled (7.8%), walked (2.8%), public transportation (2%), worked from home (3.9%)

5 / 14
John Phelan // Wikimedia Commons
#10. Hampshire County
- Average commute time: 23.6 minutes
--- #1,581 longest among all counties nationwide
--- 21.9% shorter than state average
--- 14.5% shorter than national average
- Workers with 90+ minute commute: 1.89%
- Left for work from 12 a.m. to 6 a.m.: 7.8%
- Worked outside county of residence: 32.1%
- Means of transportation: drove alone (72.2%), carpooled (6.9%), walked (9.1%), public transportation (3%), worked from home (7%)
6 / 14
Wangkun Jia // Shutterstock
#9. Barnstable County
- Average commute time: 23.9 minutes
--- #1,518 longest among all counties nationwide
--- 20.9% shorter than state average
--- 13.4% shorter than national average
- Workers with 90+ minute commute: 4.10%
- Left for work from 12 a.m. to 6 a.m.: 9.2%
- Worked outside county of residence: 13.2%
- Means of transportation: drove alone (79.8%), carpooled (7.6%), walked (2.3%), public transportation (1.5%), worked from home (7.3%)

7 / 14
AlexiusHoratius // Wikimedia Commons
#8. Franklin County
- Average commute time: 24.9 minutes
--- #1,267 longest among all counties nationwide
--- 17.5% shorter than state average
--- 9.8% shorter than national average
- Workers with 90+ minute commute: 2.74%
- Left for work from 12 a.m. to 6 a.m.: 11.7%
- Worked outside county of residence: 33.4%
- Means of transportation: drove alone (76.3%), carpooled (9.1%), walked (3.7%), public transportation (2.2%), worked from home (7.6%)

8 / 14
Marcbela (Marc N. Belanger) // Wikimedia Commons
#7. Bristol County
- Average commute time: 28.8 minutes
--- #594 longest among all counties nationwide
--- 4.6% shorter than state average
--- 4.3% longer than national average
- Workers with 90+ minute commute: 4.17%
- Left for work from 12 a.m. to 6 a.m.: 15.0%
- Worked outside county of residence: 30.2%
- Means of transportation: drove alone (81.7%), carpooled (8.5%), walked (2.6%), public transportation (2.8%), worked from home (3.5%)

9 / 14
Daderot // Wikimedia Commons
#6. Worcester County
- Average commute time: 29.7 minutes
--- #477 longest among all counties nationwide
--- 1.7% shorter than state average
--- 7.6% longer than national average
- Workers with 90+ minute commute: 3.99%
- Left for work from 12 a.m. to 6 a.m.: 13.0%
- Worked outside county of residence: 25.4%
- Means of transportation: drove alone (79.8%), carpooled (7.9%), walked (2.9%), public transportation (2%), worked from home (5.7%)

10 / 14
Bobak // Wikimedia Commons
#5. Essex County
- Average commute time: 30.4 minutes
--- #406 longest among all counties nationwide
--- 0.7% longer than state average
--- 10.1% longer than national average
- Workers with 90+ minute commute: 4.55%
- Left for work from 12 a.m. to 6 a.m.: 13.2%
- Worked outside county of residence: 32.8%
- Means of transportation: drove alone (74.5%), carpooled (8.8%), walked (3.2%), public transportation (5.7%), worked from home (5.4%)

11 / 14
Sean Pavone // Shutterstock
#4. Suffolk County
- Average commute time: 31.3 minutes
--- #316 longest among all counties nationwide
--- 3.6% longer than state average
--- 13.4% longer than national average
- Workers with 90+ minute commute: 2.42%
- Left for work from 12 a.m. to 6 a.m.: 8.9%
- Worked outside county of residence: 28.7%
- Means of transportation: drove alone (40.3%), carpooled (6.6%), walked (13.7%), public transportation (32.4%), worked from home (3.2%)

12 / 14
Jellymuffin40 // Wikimedia Commons
#3. Middlesex County
- Average commute time: 31.4 minutes
--- #307 longest among all counties nationwide
--- 4.0% longer than state average
--- 13.8% longer than national average
- Workers with 90+ minute commute: 2.70%
- Left for work from 12 a.m. to 6 a.m.: 8.2%
- Worked outside county of residence: 30.3%
- Means of transportation: drove alone (67.1%), carpooled (6.9%), walked (5%), public transportation (12.5%), worked from home (5.8%)

13 / 14
Schlitzer90 // Wikimedia Commons
#2. Plymouth County
- Average commute time: 33.8 minutes
--- #151 longest among all counties nationwide
--- 11.9% longer than state average
--- 22.5% longer than national average
- Workers with 90+ minute commute: 6.34%
- Left for work from 12 a.m. to 6 a.m.: 15.6%
- Worked outside county of residence: 43.3%
- Means of transportation: drove alone (79.2%), carpooled (7.2%), walked (1.5%), public transportation (5.9%), worked from home (4.9%)

14 / 14
Jameslwoodward // Wikimedia Commons
#1. Norfolk County
- Average commute time: 35 minutes
--- #101 longest among all counties nationwide
--- 15.9% longer than state average
--- 26.8% longer than national average
- Workers with 90+ minute commute: 4.51%
- Left for work from 12 a.m. to 6 a.m.: 9.5%
- Worked outside county of residence: 52.9%
- Means of transportation: drove alone (67.5%), carpooled (7%), walked (3.7%), public transportation (14.6%), worked from home (5.6%)


