
Counties with the worst commutes in Missouri
Written by:
April 14, 2021
Original by Patrick Hull, modifications by Kbh3rd // Wikimedia Commons
Counties with the worst commutes in Missouri
Commuting easily ranks as one of the least enjoyable parts of a person's day. Commuters encounter more physical health problems, and low-income commuters are less likely to gain financial stability—among a host of other negative impacts. And yet, America’s commutes keep getting longer as people move farther away from the office, according to census data.
Stacker compiled a list of counties with the worst commutes in Missouri using data from the U.S. Census Bureau. Counties are ranked by longest average commute time in 2019. Think you have a long trip to work? Read on to compare it against the worst commutes statewide.

1 / 30
Kbh3rd // Wikimedia Commons
#30. Carter County
- Average commute time: 27.4 minutes
--- #805 longest among all counties nationwide
--- 14.6% longer than state average
--- 0.7% shorter than national average
- Workers with 90+ minute commute: 4.88%
- Left for work from 12 a.m. to 6 a.m.: 21.2%
- Worked outside county of residence: 33.7%
- Means of transportation: drove alone (72.3%), carpooled (10.8%), walked (2.5%), public transportation (0.3%), worked from home (12.3%)

2 / 30
Kbh3rd // Wikimedia Commons
#29. Schuyler County
- Average commute time: 27.6 minutes
--- #782 longest among all counties nationwide
--- 15.5% longer than state average
--- 0.0% shorter than national average
- Workers with 90+ minute commute: 4.83%
- Left for work from 12 a.m. to 6 a.m.: 15.2%
- Worked outside county of residence: 43%
- Means of transportation: drove alone (88.8%), carpooled (6.8%), walked (1.4%), public transportation (0.2%), worked from home (2.2%)

3 / 30
Calvin Beale // Wikimedia Commons
#28. Lafayette County
- Average commute time: 27.7 minutes
--- #763 longest among all counties nationwide
--- 15.9% longer than state average
--- 0.4% longer than national average
- Workers with 90+ minute commute: 2.81%
- Left for work from 12 a.m. to 6 a.m.: 19.4%
- Worked outside county of residence: 43.6%
- Means of transportation: drove alone (81%), carpooled (11.1%), walked (1.6%), public transportation (0%), worked from home (5.3%)

4 / 30
Americasroof // Wikimedia Commons
#27. Carroll County
- Average commute time: 27.7 minutes
--- #763 longest among all counties nationwide
--- 15.9% longer than state average
--- 0.4% longer than national average
- Workers with 90+ minute commute: 5.81%
- Left for work from 12 a.m. to 6 a.m.: 15.1%
- Worked outside county of residence: 32.3%
- Means of transportation: drove alone (78.2%), carpooled (8.8%), walked (1.6%), public transportation (0%), worked from home (9.9%)

5 / 30
en:User:Americasroof // Wikimedia Commons
#26. Daviess County
- Average commute time: 27.8 minutes
--- #741 longest among all counties nationwide
--- 16.3% longer than state average
--- 0.7% longer than national average
- Workers with 90+ minute commute: 4.22%
- Left for work from 12 a.m. to 6 a.m.: 20.8%
- Worked outside county of residence: 46.9%
- Means of transportation: drove alone (71.9%), carpooled (14.8%), walked (3.3%), public transportation (0%), worked from home (6.5%)
6 / 30
Kbh3rd // Wikimedia Commons
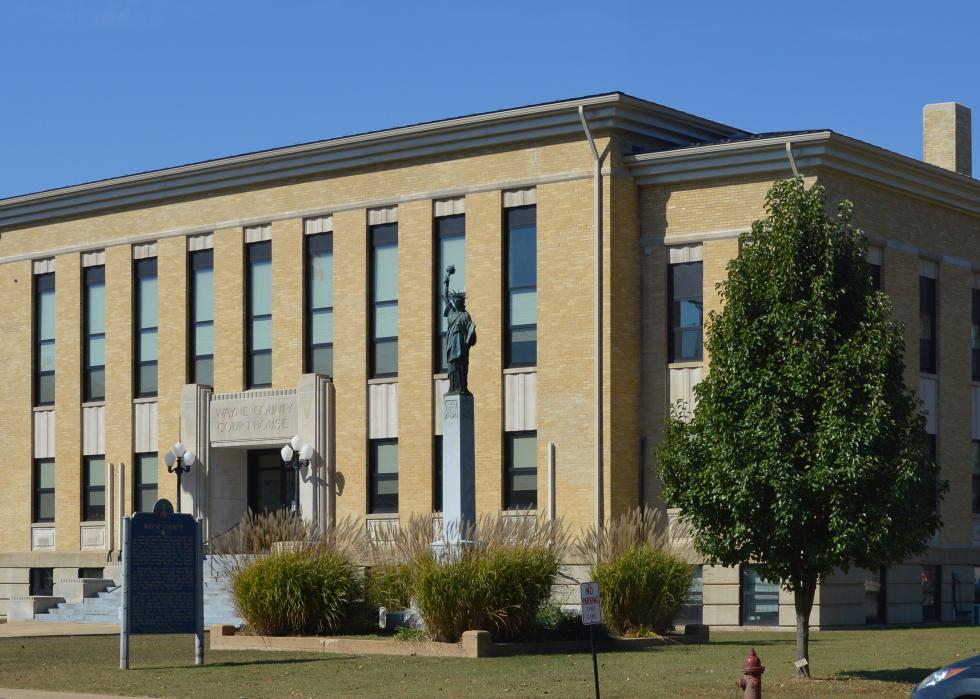
#25. Wayne County
- Average commute time: 28.3 minutes
--- #663 longest among all counties nationwide
--- 18.4% longer than state average
--- 2.5% longer than national average
- Workers with 90+ minute commute: 4.94%
- Left for work from 12 a.m. to 6 a.m.: 20.4%
- Worked outside county of residence: 31.2%
- Means of transportation: drove alone (74.1%), carpooled (14.4%), walked (1.3%), public transportation (0.8%), worked from home (8.5%)

7 / 30
Kbh3rd // Wikimedia Commons
#24. Cass County
- Average commute time: 28.4 minutes
--- #642 longest among all counties nationwide
--- 18.8% longer than state average
--- 2.9% longer than national average
- Workers with 90+ minute commute: 1.36%
- Left for work from 12 a.m. to 6 a.m.: 16.4%
- Worked outside county of residence: 38.5%
- Means of transportation: drove alone (86.2%), carpooled (7.4%), walked (0.8%), public transportation (0.1%), worked from home (4.7%)

8 / 30
Kbh3rd // Wikimedia Commons
#23. Ste. Genevieve County
- Average commute time: 28.4 minutes
--- #642 longest among all counties nationwide
--- 18.8% longer than state average
--- 2.9% longer than national average
- Workers with 90+ minute commute: 5.22%
- Left for work from 12 a.m. to 6 a.m.: 21.4%
- Worked outside county of residence: 44.4%
- Means of transportation: drove alone (80.8%), carpooled (12.7%), walked (0.4%), public transportation (0%), worked from home (4.9%)

9 / 30
TommyBrison // Shutterstock
#22. St. Clair County
- Average commute time: 28.4 minutes
--- #642 longest among all counties nationwide
--- 18.8% longer than state average
--- 2.9% longer than national average
- Workers with 90+ minute commute: 8.62%
- Left for work from 12 a.m. to 6 a.m.: 19.1%
- Worked outside county of residence: 46.9%
- Means of transportation: drove alone (77.7%), carpooled (8.8%), walked (3.6%), public transportation (0.1%), worked from home (8.6%)

10 / 30
Kbh3rd // Wikimedia Commons
#21. Franklin County
- Average commute time: 28.5 minutes
--- #631 longest among all counties nationwide
--- 19.2% longer than state average
--- 3.3% longer than national average
- Workers with 90+ minute commute: 2.35%
- Left for work from 12 a.m. to 6 a.m.: 21.7%
- Worked outside county of residence: 35.8%
- Means of transportation: drove alone (84.5%), carpooled (9.2%), walked (1.6%), public transportation (0.2%), worked from home (4%)
11 / 30
thomas carr // Shutterstock
#20. Webster County
- Average commute time: 28.6 minutes
--- #615 longest among all counties nationwide
--- 19.7% longer than state average
--- 3.6% longer than national average
- Workers with 90+ minute commute: 2.31%
- Left for work from 12 a.m. to 6 a.m.: 21.1%
- Worked outside county of residence: 58.2%
- Means of transportation: drove alone (79.9%), carpooled (13.2%), walked (2%), public transportation (0.3%), worked from home (3.3%)

12 / 30
Kbh3rd // Wikimedia Commons
#19. Montgomery County
- Average commute time: 28.9 minutes
--- #577 longest among all counties nationwide
--- 20.9% longer than state average
--- 4.7% longer than national average
- Workers with 90+ minute commute: 3.38%
- Left for work from 12 a.m. to 6 a.m.: 22.5%
- Worked outside county of residence: 46.1%
- Means of transportation: drove alone (83.1%), carpooled (9.9%), walked (2.5%), public transportation (0.7%), worked from home (3.5%)

13 / 30
Brian Hunter // Wikimedia Commons
#18. Benton County
- Average commute time: 28.9 minutes
--- #577 longest among all counties nationwide
--- 20.9% longer than state average
--- 4.7% longer than national average
- Workers with 90+ minute commute: 6.05%
- Left for work from 12 a.m. to 6 a.m.: 20.5%
- Worked outside county of residence: 39.3%
- Means of transportation: drove alone (76.9%), carpooled (13.8%), walked (2.6%), public transportation (0.2%), worked from home (4.7%)

14 / 30
JERRYE & ROY KLOTZ MD // Wikimedia Commons
#17. Ray County
- Average commute time: 29.6 minutes
--- #485 longest among all counties nationwide
--- 23.8% longer than state average
--- 7.2% longer than national average
- Workers with 90+ minute commute: 1.62%
- Left for work from 12 a.m. to 6 a.m.: 22.2%
- Worked outside county of residence: 57.5%
- Means of transportation: drove alone (85.1%), carpooled (9.2%), walked (1.2%), public transportation (0.5%), worked from home (3.5%)
15 / 30
Kclibrarian // Wikimedia Commons
#16. Stone County
- Average commute time: 29.6 minutes
--- #485 longest among all counties nationwide
--- 23.8% longer than state average
--- 7.2% longer than national average
- Workers with 90+ minute commute: 2.33%
- Left for work from 12 a.m. to 6 a.m.: 15.4%
- Worked outside county of residence: 49.3%
- Means of transportation: drove alone (76.8%), carpooled (12.6%), walked (1.9%), public transportation (0%), worked from home (7.6%)

16 / 30
Kbh3rd // Wikimedia Commons
#15. Iron County
- Average commute time: 29.7 minutes
--- #477 longest among all counties nationwide
--- 24.3% longer than state average
--- 7.6% longer than national average
- Workers with 90+ minute commute: 5.94%
- Left for work from 12 a.m. to 6 a.m.: 21.4%
- Worked outside county of residence: 50.6%
- Means of transportation: drove alone (80.9%), carpooled (13.3%), walked (1.6%), public transportation (0.3%), worked from home (3.1%)

17 / 30
Onegentlemanofverona // Wikimedia Commons
#14. Monroe County
- Average commute time: 30 minutes
--- #445 longest among all counties nationwide
--- 25.5% longer than state average
--- 8.7% longer than national average
- Workers with 90+ minute commute: 5.26%
- Left for work from 12 a.m. to 6 a.m.: 20.7%
- Worked outside county of residence: 55.7%
- Means of transportation: drove alone (83.5%), carpooled (9.6%), walked (2.6%), public transportation (0%), worked from home (3.2%)

18 / 30
Kbh3rd // Wikimedia Commons
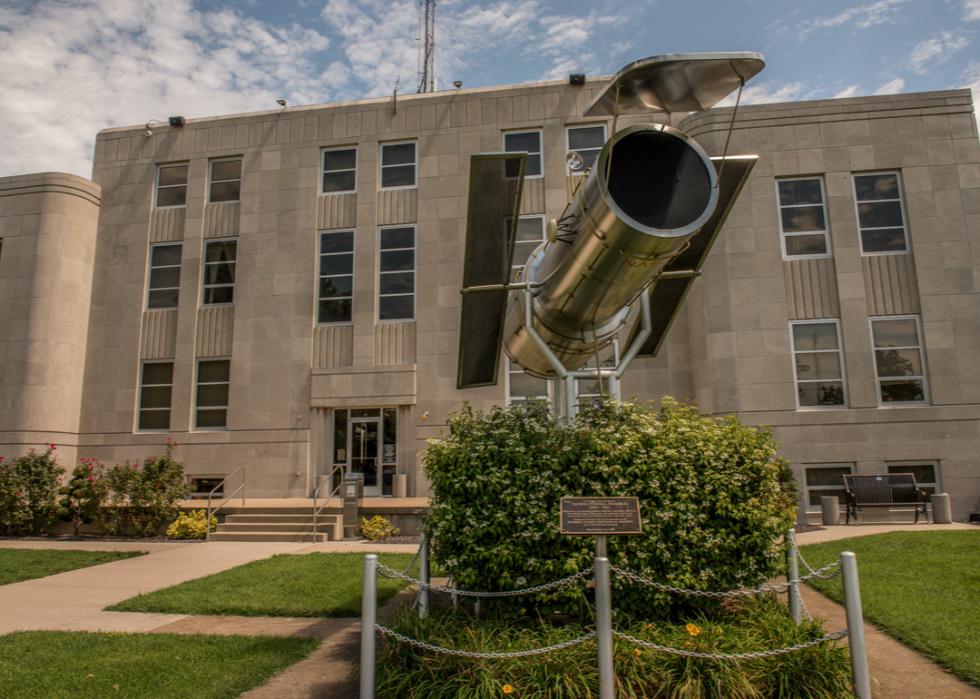
#13. Dallas County
- Average commute time: 30.2 minutes
--- #427 longest among all counties nationwide
--- 26.4% longer than state average
--- 9.4% longer than national average
- Workers with 90+ minute commute: 3.02%
- Left for work from 12 a.m. to 6 a.m.: 21.0%
- Worked outside county of residence: 60.6%
- Means of transportation: drove alone (80.5%), carpooled (9.2%), walked (1.6%), public transportation (0.2%), worked from home (5.3%)

19 / 30
Allegrorondo // Wikimedia Commons
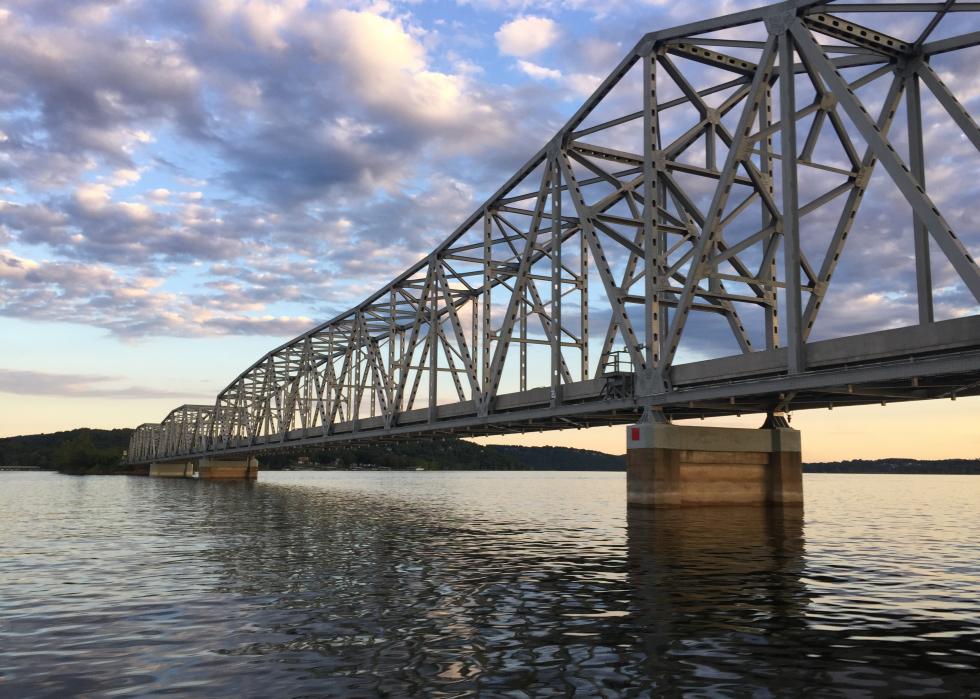
#12. Warren County
- Average commute time: 30.7 minutes
--- #371 longest among all counties nationwide
--- 28.5% longer than state average
--- 11.2% longer than national average
- Workers with 90+ minute commute: 2.51%
- Left for work from 12 a.m. to 6 a.m.: 18.1%
- Worked outside county of residence: 62.6%
- Means of transportation: drove alone (86.9%), carpooled (8.5%), walked (0.5%), public transportation (0.2%), worked from home (2.4%)
20 / 30
Canva
#11. Jefferson County
- Average commute time: 31.2 minutes
--- #327 longest among all counties nationwide
--- 30.5% longer than state average
--- 13.0% longer than national average
- Workers with 90+ minute commute: 1.82%
- Left for work from 12 a.m. to 6 a.m.: 19.4%
- Worked outside county of residence: 60.2%
- Means of transportation: drove alone (87.2%), carpooled (7.7%), walked (0.5%), public transportation (0.2%), worked from home (3.8%)

21 / 30
Kbh3rd // Wikimedia Commons
#10. Hickory County
- Average commute time: 31.4 minutes
--- #307 longest among all counties nationwide
--- 31.4% longer than state average
--- 13.8% longer than national average
- Workers with 90+ minute commute: 4.85%
- Left for work from 12 a.m. to 6 a.m.: 19.1%
- Worked outside county of residence: 54.6%
- Means of transportation: drove alone (81.6%), carpooled (8.4%), walked (1.1%), public transportation (0%), worked from home (4.8%)

22 / 30
Kbh3rd // Wikimedia Commons
#9. Ozark County
- Average commute time: 31.7 minutes
--- #282 longest among all counties nationwide
--- 32.6% longer than state average
--- 14.9% longer than national average
- Workers with 90+ minute commute: 5.83%
- Left for work from 12 a.m. to 6 a.m.: 14.4%
- Worked outside county of residence: 25.5%
- Means of transportation: drove alone (75.2%), carpooled (13.5%), walked (5.7%), public transportation (0.3%), worked from home (4.9%)

23 / 30
Skye Marthaler, retouched by Kbh3rd // Wikimedia Commons
#8. Bollinger County
- Average commute time: 31.9 minutes
--- #269 longest among all counties nationwide
--- 33.5% longer than state average
--- 15.6% longer than national average
- Workers with 90+ minute commute: 2.89%
- Left for work from 12 a.m. to 6 a.m.: 21.1%
- Worked outside county of residence: 58.4%
- Means of transportation: drove alone (70.7%), carpooled (18.1%), walked (3.3%), public transportation (0.7%), worked from home (6.2%)

24 / 30
Jpjonesusn // Wikimedia Commons
#7. Bates County
- Average commute time: 31.9 minutes
--- #269 longest among all counties nationwide
--- 33.5% longer than state average
--- 15.6% longer than national average
- Workers with 90+ minute commute: 4.16%
- Left for work from 12 a.m. to 6 a.m.: 22.9%
- Worked outside county of residence: 35.6%
- Means of transportation: drove alone (73.9%), carpooled (13.5%), walked (1.8%), public transportation (0%), worked from home (9.5%)

25 / 30
Americasroof // Wikimedia Commons
#6. Washington County
- Average commute time: 32.4 minutes
--- #233 longest among all counties nationwide
--- 35.6% longer than state average
--- 17.4% longer than national average
- Workers with 90+ minute commute: 7.63%
- Left for work from 12 a.m. to 6 a.m.: 33.6%
- Worked outside county of residence: 49.7%
- Means of transportation: drove alone (81.4%), carpooled (10.1%), walked (2.1%), public transportation (0.3%), worked from home (4.3%)

26 / 30
Kbh3rd // Wikimedia Commons
#5. Clinton County
- Average commute time: 32.7 minutes
--- #213 longest among all counties nationwide
--- 36.8% longer than state average
--- 18.5% longer than national average
- Workers with 90+ minute commute: 2.95%
- Left for work from 12 a.m. to 6 a.m.: 20.8%
- Worked outside county of residence: 63.2%
- Means of transportation: drove alone (82.6%), carpooled (10.5%), walked (0.7%), public transportation (1%), worked from home (4.9%)

27 / 30
Kbh3rd // Wikimedia Commons
#4. Caldwell County
- Average commute time: 33.1 minutes
--- #188 longest among all counties nationwide
--- 38.5% longer than state average
--- 19.9% longer than national average
- Workers with 90+ minute commute: 4.20%
- Left for work from 12 a.m. to 6 a.m.: 21.5%
- Worked outside county of residence: 60.5%
- Means of transportation: drove alone (82.1%), carpooled (11.3%), walked (2.6%), public transportation (0.1%), worked from home (3.4%)

28 / 30
Kbh3rd // Wikimedia Commons
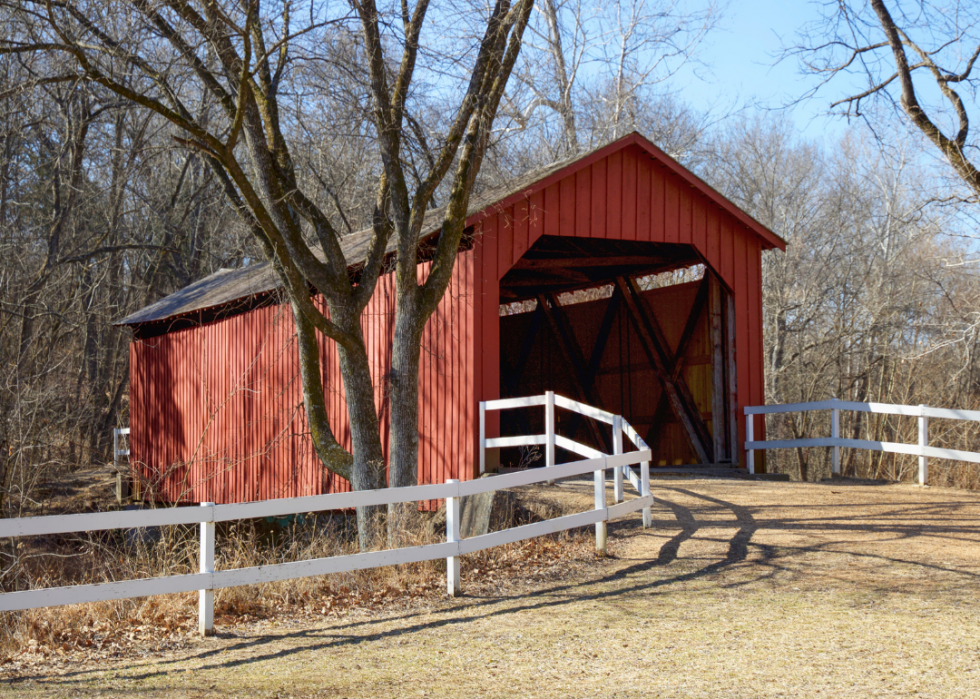
#3. Maries County
- Average commute time: 33.4 minutes
--- #171 longest among all counties nationwide
--- 39.7% longer than state average
--- 21.0% longer than national average
- Workers with 90+ minute commute: 3.89%
- Left for work from 12 a.m. to 6 a.m.: 23.5%
- Worked outside county of residence: 71.6%
- Means of transportation: drove alone (74.4%), carpooled (15.4%), walked (1.6%), public transportation (0.2%), worked from home (7.3%)

29 / 30
pasa47 // Wikimedia Commons
#2. Lincoln County
- Average commute time: 33.8 minutes
--- #151 longest among all counties nationwide
--- 41.4% longer than state average
--- 22.5% longer than national average
- Workers with 90+ minute commute: 3.33%
- Left for work from 12 a.m. to 6 a.m.: 20.7%
- Worked outside county of residence: 61.8%
- Means of transportation: drove alone (87%), carpooled (7.7%), walked (0.9%), public transportation (0.4%), worked from home (3.3%)

30 / 30
Original by Patrick Hull, modifications by Kbh3rd // Wikimedia Commons
#1. Worth County
- Average commute time: 34.5 minutes
--- #118 longest among all counties nationwide
--- 44.4% longer than state average
--- 25.0% longer than national average
- Workers with 90+ minute commute: 9.15%
- Left for work from 12 a.m. to 6 a.m.: 17.8%
- Worked outside county of residence: 37.9%
- Means of transportation: drove alone (75.8%), carpooled (9.5%), walked (5.8%), public transportation (0.4%), worked from home (7%)


