
Counties with the worst commutes in Nevada
Written by:
April 14, 2021
Famartin // Wikimedia Commons
Counties with the worst commutes in Nevada
Commuting easily ranks as one of the least enjoyable parts of a person's day. Commuters encounter more physical health problems, and low-income commuters are less likely to gain financial stability—among a host of other negative impacts. And yet, America’s commutes keep getting longer as people move farther away from the office, according to census data.
Stacker compiled a list of counties with the worst commutes in Nevada using data from the U.S. Census Bureau. Counties are ranked by longest average commute time in 2019. Think you have a long trip to work? Read on to compare it against the worst commutes statewide.

1 / 17
An63ca // Wikimedia Commons
#17. Esmeralda County
- Average commute time: 14.3 minutes
--- #3,005 longest among all counties nationwide
--- 41.9% shorter than state average
--- 48.2% shorter than national average
- Workers with 90+ minute commute: 3.58%
- Left for work from 12 a.m. to 6 a.m.: 22.7%
- Worked outside county of residence: 19.4%
- Means of transportation: drove alone (62%), carpooled (9.4%), walked (13.6%), public transportation (0%), worked from home (12.3%)

2 / 17
Ken Lund // Flickr
#16. Mineral County
- Average commute time: 14.6 minutes
--- #2,982 longest among all counties nationwide
--- 40.7% shorter than state average
--- 47.1% shorter than national average
- Workers with 90+ minute commute: 3.20%
- Left for work from 12 a.m. to 6 a.m.: 15.7%
- Worked outside county of residence: 13.8%
- Means of transportation: drove alone (77.8%), carpooled (10.1%), walked (7%), public transportation (0%), worked from home (3.4%)
3 / 17
Terence Mendoza // Shutterstock
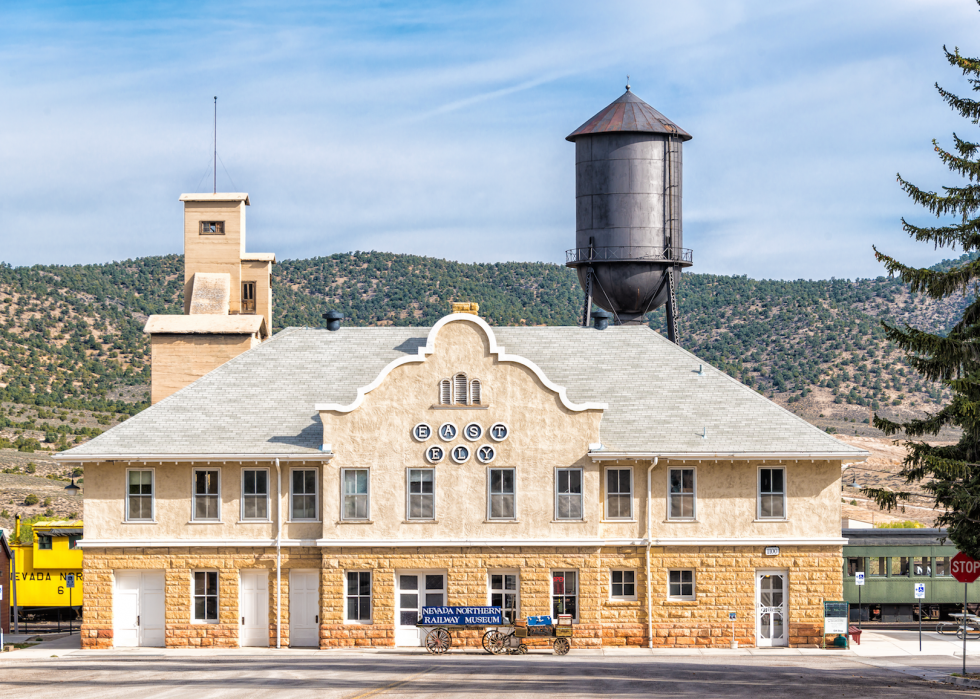
#15. White Pine County
- Average commute time: 16.6 minutes
--- #2,832 longest among all counties nationwide
--- 32.5% shorter than state average
--- 39.9% shorter than national average
- Workers with 90+ minute commute: 1.32%
- Left for work from 12 a.m. to 6 a.m.: 28.4%
- Worked outside county of residence: 2.6%
- Means of transportation: drove alone (79.3%), carpooled (5.8%), walked (9%), public transportation (2.1%), worked from home (3%)

4 / 17
Ken Lund // Flickr
#14. Pershing County
- Average commute time: 19.6 minutes
--- #2,383 longest among all counties nationwide
--- 20.3% shorter than state average
--- 29.0% shorter than national average
- Workers with 90+ minute commute: 3.59%
- Left for work from 12 a.m. to 6 a.m.: 34.2%
- Worked outside county of residence: 22.2%
- Means of transportation: drove alone (71.4%), carpooled (15.5%), walked (5.8%), public transportation (1%), worked from home (5.3%)

5 / 17
Pixabay
#13. Carson City
- Average commute time: 20.2 minutes
--- #2,280 longest among all counties nationwide
--- 17.9% shorter than state average
--- 26.8% shorter than national average
- Workers with 90+ minute commute: 1.22%
- Left for work from 12 a.m. to 6 a.m.: 16.4%
- Worked outside county of residence: 30.7%
- Means of transportation: drove alone (80%), carpooled (12%), walked (2%), public transportation (0.8%), worked from home (3.3%)

6 / 17
Famartin // Wikimedia Commons
#12. Churchill County
- Average commute time: 20.8 minutes
--- #2,170 longest among all counties nationwide
--- 15.4% shorter than state average
--- 24.6% shorter than national average
- Workers with 90+ minute commute: 2.54%
- Left for work from 12 a.m. to 6 a.m.: 23.1%
- Worked outside county of residence: 12.4%
- Means of transportation: drove alone (81%), carpooled (9.8%), walked (3.2%), public transportation (0.8%), worked from home (3.8%)
7 / 17
Andrew Zarivny // Shutterstock
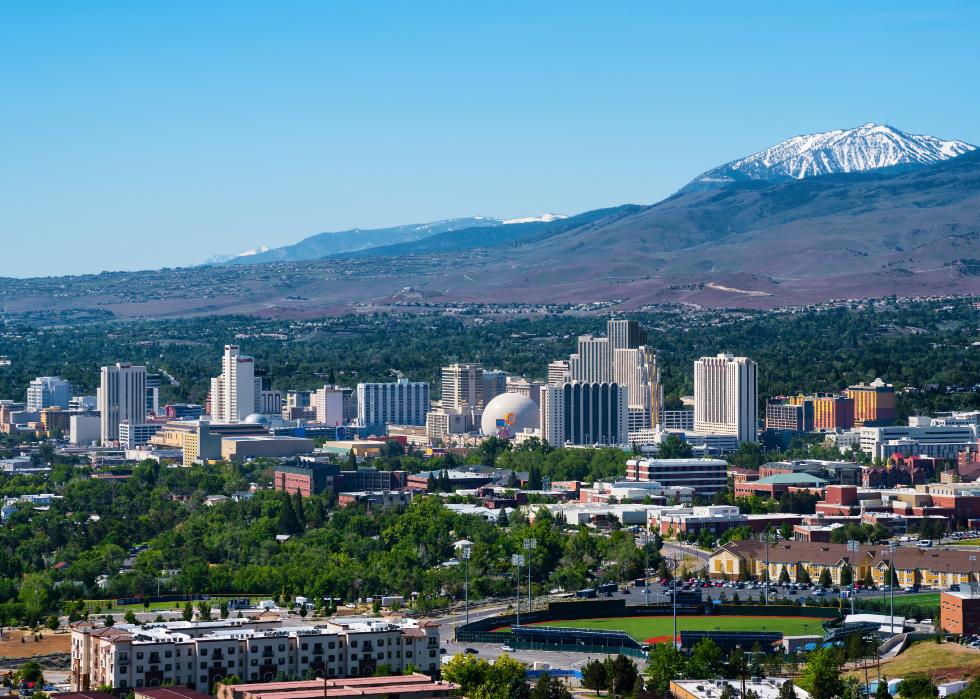
#11. Washoe County
- Average commute time: 22.1 minutes
--- #1,921 longest among all counties nationwide
--- 10.2% shorter than state average
--- 19.9% shorter than national average
- Workers with 90+ minute commute: 1.72%
- Left for work from 12 a.m. to 6 a.m.: 15.1%
- Worked outside county of residence: 4.1%
- Means of transportation: drove alone (77.2%), carpooled (12%), walked (2.5%), public transportation (1.8%), worked from home (4.7%)

8 / 17
Famartin // Wikimedia Commons
#10. Lincoln County
- Average commute time: 22.4 minutes
--- #1,850 longest among all counties nationwide
--- 8.9% shorter than state average
--- 18.8% shorter than national average
- Workers with 90+ minute commute: 7.65%
- Left for work from 12 a.m. to 6 a.m.: 25.6%
- Worked outside county of residence: 12%
- Means of transportation: drove alone (77%), carpooled (8.7%), walked (1.2%), public transportation (0%), worked from home (10.8%)

9 / 17
Famartin // Wikimedia Commons
#9. Lander County
- Average commute time: 22.7 minutes
--- #1,785 longest among all counties nationwide
--- 7.7% shorter than state average
--- 17.8% shorter than national average
- Workers with 90+ minute commute: 0.52%
- Left for work from 12 a.m. to 6 a.m.: 54.6%
- Worked outside county of residence: 26.2%
- Means of transportation: drove alone (58.5%), carpooled (20.1%), walked (5.4%), public transportation (12.4%), worked from home (2.3%)

10 / 17
Constantine Kulikovsky // Wikimedia Commons
#8. Douglas County
- Average commute time: 24.2 minutes
--- #1,451 longest among all counties nationwide
--- 1.6% shorter than state average
--- 12.3% shorter than national average
- Workers with 90+ minute commute: 2.07%
- Left for work from 12 a.m. to 6 a.m.: 13.3%
- Worked outside county of residence: 25.4%
- Means of transportation: drove alone (77.1%), carpooled (11.1%), walked (1.6%), public transportation (0.3%), worked from home (8.4%)

11 / 17
randy andy // Shutterstock
#7. Clark County
- Average commute time: 25.2 minutes
--- #1,205 longest among all counties nationwide
--- 2.4% longer than state average
--- 8.7% shorter than national average
- Workers with 90+ minute commute: 1.90%
- Left for work from 12 a.m. to 6 a.m.: 15.8%
- Worked outside county of residence: 0.2%
- Means of transportation: drove alone (78.8%), carpooled (9.8%), walked (1.5%), public transportation (3.4%), worked from home (4.2%)

12 / 17
Tomdonohue1 // Wikimedia Commons
#6. Nye County
- Average commute time: 25.9 minutes
--- #1,062 longest among all counties nationwide
--- 5.3% longer than state average
--- 6.2% shorter than national average
- Workers with 90+ minute commute: 5.72%
- Left for work from 12 a.m. to 6 a.m.: 27.0%
- Worked outside county of residence: 15.9%
- Means of transportation: drove alone (76.7%), carpooled (12.5%), walked (3.9%), public transportation (0.7%), worked from home (4.2%)

13 / 17
Famartin // Wikimedia Commons
#5. Eureka County
- Average commute time: 27.2 minutes
--- #829 longest among all counties nationwide
--- 10.6% longer than state average
--- 1.4% shorter than national average
- Workers with 90+ minute commute: 5.84%
- Left for work from 12 a.m. to 6 a.m.: 39.4%
- Worked outside county of residence: 24.8%
- Means of transportation: drove alone (53.3%), carpooled (17.5%), walked (15.1%), public transportation (9.8%), worked from home (4.3%)

14 / 17
Finetooth // Wikimedia Commons
#4. Humboldt County
- Average commute time: 28.6 minutes
--- #615 longest among all counties nationwide
--- 16.3% longer than state average
--- 3.6% longer than national average
- Workers with 90+ minute commute: 6.12%
- Left for work from 12 a.m. to 6 a.m.: 36.3%
- Worked outside county of residence: 9.3%
- Means of transportation: drove alone (59.4%), carpooled (16.2%), walked (5.3%), public transportation (11.9%), worked from home (5.9%)

15 / 17
Kelapstick // Wikimedia Commons
#3. Lyon County
- Average commute time: 28.7 minutes
--- #606 longest among all counties nationwide
--- 16.7% longer than state average
--- 4.0% longer than national average
- Workers with 90+ minute commute: 2.64%
- Left for work from 12 a.m. to 6 a.m.: 22.9%
- Worked outside county of residence: 55.5%
- Means of transportation: drove alone (79.3%), carpooled (13.8%), walked (1.2%), public transportation (0.9%), worked from home (3.3%)

16 / 17
Loren Kerns // Wikimedia Commons
#2. Storey County
- Average commute time: 28.9 minutes
--- #577 longest among all counties nationwide
--- 17.5% longer than state average
--- 4.7% longer than national average
- Workers with 90+ minute commute: 3.40%
- Left for work from 12 a.m. to 6 a.m.: 20.2%
- Worked outside county of residence: 78.1%
- Means of transportation: drove alone (80.1%), carpooled (6.2%), walked (7.1%), public transportation (1.9%), worked from home (4%)

17 / 17
Famartin // Wikimedia Commons
#1. Elko County
- Average commute time: 30.2 minutes
--- #427 longest among all counties nationwide
--- 22.8% longer than state average
--- 9.4% longer than national average
- Workers with 90+ minute commute: 10.35%
- Left for work from 12 a.m. to 6 a.m.: 34.6%
- Worked outside county of residence: 12.2%
- Means of transportation: drove alone (63.8%), carpooled (13.6%), walked (4.3%), public transportation (13.4%), worked from home (3.4%)


