
Counties with the worst commutes in New York
Written by:
April 14, 2021
Gryffindor // Wikimedia Commons
Counties with the worst commutes in New York
Commuting easily ranks as one of the least enjoyable parts of a person's day. Commuters encounter more physical health problems, and low-income commuters are less likely to gain financial stability—among a host of other negative impacts. And yet, America’s commutes keep getting longer as people move farther away from the office, according to census data.
Stacker compiled a list of counties with the worst commutes in New York using data from the U.S. Census Bureau. Counties are ranked by longest average commute time in 2019. Think you have a long trip to work? Read on to compare it against the worst commutes statewide.

1 / 30
Daniel Case // Wikimedia Commons
#30. Chenango County
- Average commute time: 24.6 minutes
--- #1,335 longest among all counties nationwide
--- 26.8% shorter than state average
--- 10.9% shorter than national average
- Workers with 90+ minute commute: 3.08%
- Left for work from 12 a.m. to 6 a.m.: 18.0%
- Worked outside county of residence: 32.2%
- Means of transportation: drove alone (78.7%), carpooled (10.5%), walked (4.6%), public transportation (0.2%), worked from home (5%)

2 / 30
Andre Carrotflower // Wikimedia Commons
#29. Wayne County
- Average commute time: 24.7 minutes
--- #1,315 longest among all counties nationwide
--- 26.5% shorter than state average
--- 10.5% shorter than national average
- Workers with 90+ minute commute: 1.19%
- Left for work from 12 a.m. to 6 a.m.: 15.7%
- Worked outside county of residence: 49.3%
- Means of transportation: drove alone (84%), carpooled (9.3%), walked (2%), public transportation (0.5%), worked from home (3.2%)

3 / 30
Beyond My Ken // Wikimedia Commons
#28. Fulton County
- Average commute time: 24.7 minutes
--- #1,315 longest among all counties nationwide
--- 26.5% shorter than state average
--- 10.5% shorter than national average
- Workers with 90+ minute commute: 2.17%
- Left for work from 12 a.m. to 6 a.m.: 19.6%
- Worked outside county of residence: 42.8%
- Means of transportation: drove alone (84.1%), carpooled (8.5%), walked (2.2%), public transportation (0.5%), worked from home (1.9%)

4 / 30
Jwilson855 // Wikimedia Commons
#27. Montgomery County
- Average commute time: 24.8 minutes
--- #1,289 longest among all counties nationwide
--- 26.2% shorter than state average
--- 10.1% shorter than national average
- Workers with 90+ minute commute: 1.29%
- Left for work from 12 a.m. to 6 a.m.: 19.4%
- Worked outside county of residence: 45.9%
- Means of transportation: drove alone (80.2%), carpooled (6.8%), walked (4.1%), public transportation (0.8%), worked from home (4.2%)

5 / 30
Matt H. Wade // Wikimedia Commons
#26. Rensselaer County
- Average commute time: 24.8 minutes
--- #1,289 longest among all counties nationwide
--- 26.2% shorter than state average
--- 10.1% shorter than national average
- Workers with 90+ minute commute: 1.93%
- Left for work from 12 a.m. to 6 a.m.: 9.2%
- Worked outside county of residence: 53.4%
- Means of transportation: drove alone (80.2%), carpooled (8.4%), walked (3.4%), public transportation (3.3%), worked from home (3.8%)

6 / 30
Doug Kerr // Wikimedia Commons
#25. Delaware County
- Average commute time: 24.9 minutes
--- #1,267 longest among all counties nationwide
--- 25.9% shorter than state average
--- 9.8% shorter than national average
- Workers with 90+ minute commute: 4.24%
- Left for work from 12 a.m. to 6 a.m.: 15.4%
- Worked outside county of residence: 26.4%
- Means of transportation: drove alone (75.2%), carpooled (8.3%), walked (6.3%), public transportation (1.3%), worked from home (6.7%)
7 / 30
PhotoItaliaStudio // Shutterstock
#24. Saratoga County
- Average commute time: 25.2 minutes
--- #1,205 longest among all counties nationwide
--- 25.0% shorter than state average
--- 8.7% shorter than national average
- Workers with 90+ minute commute: 1.52%
- Left for work from 12 a.m. to 6 a.m.: 10.3%
- Worked outside county of residence: 41.5%
- Means of transportation: drove alone (83.2%), carpooled (7.3%), walked (1.8%), public transportation (0.7%), worked from home (6.3%)

8 / 30
Wangkun Jia // Shutterstock
#23. Oswego County
- Average commute time: 25.2 minutes
--- #1,205 longest among all counties nationwide
--- 25.0% shorter than state average
--- 8.7% shorter than national average
- Workers with 90+ minute commute: 2.09%
- Left for work from 12 a.m. to 6 a.m.: 17.7%
- Worked outside county of residence: 39.9%
- Means of transportation: drove alone (81.8%), carpooled (8.4%), walked (3.9%), public transportation (0.8%), worked from home (3.5%)

9 / 30
Kenneth C. Zirkel // Wikimedia Commons
#22. Wyoming County
- Average commute time: 25.4 minutes
--- #1,167 longest among all counties nationwide
--- 24.4% shorter than state average
--- 8.0% shorter than national average
- Workers with 90+ minute commute: 1.72%
- Left for work from 12 a.m. to 6 a.m.: 15.7%
- Worked outside county of residence: 47%
- Means of transportation: drove alone (82.8%), carpooled (7.1%), walked (4.8%), public transportation (0.6%), worked from home (3.5%)

10 / 30
Jimmy Emerson // Wikimedia Commons
#21. Orleans County
- Average commute time: 25.7 minutes
--- #1,109 longest among all counties nationwide
--- 23.5% shorter than state average
--- 6.9% shorter than national average
- Workers with 90+ minute commute: 1.98%
- Left for work from 12 a.m. to 6 a.m.: 20.4%
- Worked outside county of residence: 42.7%
- Means of transportation: drove alone (78.6%), carpooled (11.2%), walked (3.3%), public transportation (0.7%), worked from home (3.7%)

11 / 30
Benjamin D. Esham (bdesham) // Wikimedia Commons
#20. Livingston County
- Average commute time: 25.7 minutes
--- #1,109 longest among all counties nationwide
--- 23.5% shorter than state average
--- 6.9% shorter than national average
- Workers with 90+ minute commute: 1.99%
- Left for work from 12 a.m. to 6 a.m.: 15.2%
- Worked outside county of residence: 45.3%
- Means of transportation: drove alone (80.2%), carpooled (8.2%), walked (6.4%), public transportation (0.7%), worked from home (3.6%)

12 / 30
Lamar Gore/USFWS // Wikimedia Commons
#19. Schuyler County
- Average commute time: 26.3 minutes
--- #992 longest among all counties nationwide
--- 21.7% shorter than state average
--- 4.7% shorter than national average
- Workers with 90+ minute commute: 1.78%
- Left for work from 12 a.m. to 6 a.m.: 12.8%
- Worked outside county of residence: 55.7%
- Means of transportation: drove alone (77.1%), carpooled (13.1%), walked (2.6%), public transportation (0.6%), worked from home (5.4%)

13 / 30
Daniel Case // Wikimedia Commons
#18. Columbia County
- Average commute time: 26.3 minutes
--- #992 longest among all counties nationwide
--- 21.7% shorter than state average
--- 4.7% shorter than national average
- Workers with 90+ minute commute: 3.30%
- Left for work from 12 a.m. to 6 a.m.: 10.1%
- Worked outside county of residence: 32%
- Means of transportation: drove alone (75.3%), carpooled (8.5%), walked (4.5%), public transportation (2.6%), worked from home (7.2%)

14 / 30
UpstateNYer // Wikimedia Commons
#17. Washington County
- Average commute time: 26.5 minutes
--- #954 longest among all counties nationwide
--- 21.1% shorter than state average
--- 4.0% shorter than national average
- Workers with 90+ minute commute: 2.32%
- Left for work from 12 a.m. to 6 a.m.: 17.5%
- Worked outside county of residence: 46.6%
- Means of transportation: drove alone (81.7%), carpooled (8.8%), walked (3.2%), public transportation (0.6%), worked from home (4.6%)

15 / 30
Felix Lipov // Shutterstock
#16. Greene County
- Average commute time: 28.9 minutes
--- #577 longest among all counties nationwide
--- 14.0% shorter than state average
--- 4.7% longer than national average
- Workers with 90+ minute commute: 4.16%
- Left for work from 12 a.m. to 6 a.m.: 11.1%
- Worked outside county of residence: 42.4%
- Means of transportation: drove alone (80.4%), carpooled (8.2%), walked (2.8%), public transportation (1.3%), worked from home (5.1%)

16 / 30
Fred Hsu // Wikimedia Commons
#15. Ulster County
- Average commute time: 29 minutes
--- #567 longest among all counties nationwide
--- 13.7% shorter than state average
--- 5.1% longer than national average
- Workers with 90+ minute commute: 5.20%
- Left for work from 12 a.m. to 6 a.m.: 10.3%
- Worked outside county of residence: 32.2%
- Means of transportation: drove alone (76.8%), carpooled (7.4%), walked (3.9%), public transportation (2.6%), worked from home (8%)

17 / 30
Eric Richards // Wikimedia Commons
#14. Sullivan County
- Average commute time: 30.6 minutes
--- #386 longest among all counties nationwide
--- 8.9% shorter than state average
--- 10.9% longer than national average
- Workers with 90+ minute commute: 7.84%
- Left for work from 12 a.m. to 6 a.m.: 14.0%
- Worked outside county of residence: 28.7%
- Means of transportation: drove alone (81.9%), carpooled (7.3%), walked (2.5%), public transportation (2.4%), worked from home (4.5%)

18 / 30
Reilchey27 // Wikimedia Commons
#13. Schoharie County
- Average commute time: 30.8 minutes
--- #362 longest among all counties nationwide
--- 8.3% shorter than state average
--- 11.6% longer than national average
- Workers with 90+ minute commute: 3.94%
- Left for work from 12 a.m. to 6 a.m.: 18.4%
- Worked outside county of residence: 43.5%
- Means of transportation: drove alone (78%), carpooled (10%), walked (5%), public transportation (1.1%), worked from home (5.2%)

19 / 30
Felix Lipov // Shutterstock
#12. Rockland County
- Average commute time: 31.5 minutes
--- #298 longest among all counties nationwide
--- 6.3% shorter than state average
--- 14.1% longer than national average
- Workers with 90+ minute commute: 6.74%
- Left for work from 12 a.m. to 6 a.m.: 8.5%
- Worked outside county of residence: 27%
- Means of transportation: drove alone (70.9%), carpooled (10.4%), walked (3.3%), public transportation (8.1%), worked from home (5.4%)

20 / 30
pisaphotography // Shutterstock
#11. Manhattan
- Average commute time: 32.2 minutes
--- #247 longest among all counties nationwide
--- 4.2% shorter than state average
--- 16.7% longer than national average
- Workers with 90+ minute commute: 2.88%
- Left for work from 12 a.m. to 6 a.m.: 3.7%
- Worked outside county of residence: 11.5%
- Means of transportation: drove alone (6%), carpooled (1.9%), walked (20.4%), public transportation (58.8%), worked from home (7.2%)

21 / 30
Tim Hettler from New York, NY, USA // Wikimedia Commons
#10. Suffolk County
- Average commute time: 32.7 minutes
--- #213 longest among all counties nationwide
--- 2.7% shorter than state average
--- 18.5% longer than national average
- Workers with 90+ minute commute: 7.78%
- Left for work from 12 a.m. to 6 a.m.: 11.3%
- Worked outside county of residence: 23.3%
- Means of transportation: drove alone (79.6%), carpooled (7.7%), walked (1.3%), public transportation (6.4%), worked from home (3.8%)

22 / 30
Colin D. Young // Shutterstock
#9. Dutchess County
- Average commute time: 33 minutes
--- #195 longest among all counties nationwide
--- 1.8% shorter than state average
--- 19.6% longer than national average
- Workers with 90+ minute commute: 7.57%
- Left for work from 12 a.m. to 6 a.m.: 11.8%
- Worked outside county of residence: 31.3%
- Means of transportation: drove alone (75.6%), carpooled (7.3%), walked (3.9%), public transportation (5.5%), worked from home (6.4%)

23 / 30
Mwanner // Wikimedia Commons
#8. Orange County
- Average commute time: 33.6 minutes
--- #160 longest among all counties nationwide
--- 0.0% shorter than state average
--- 21.7% longer than national average
- Workers with 90+ minute commute: 9.22%
- Left for work from 12 a.m. to 6 a.m.: 14.6%
- Worked outside county of residence: 26.2%
- Means of transportation: drove alone (74.8%), carpooled (8.8%), walked (3.8%), public transportation (5.1%), worked from home (5.5%)
24 / 30
Canva
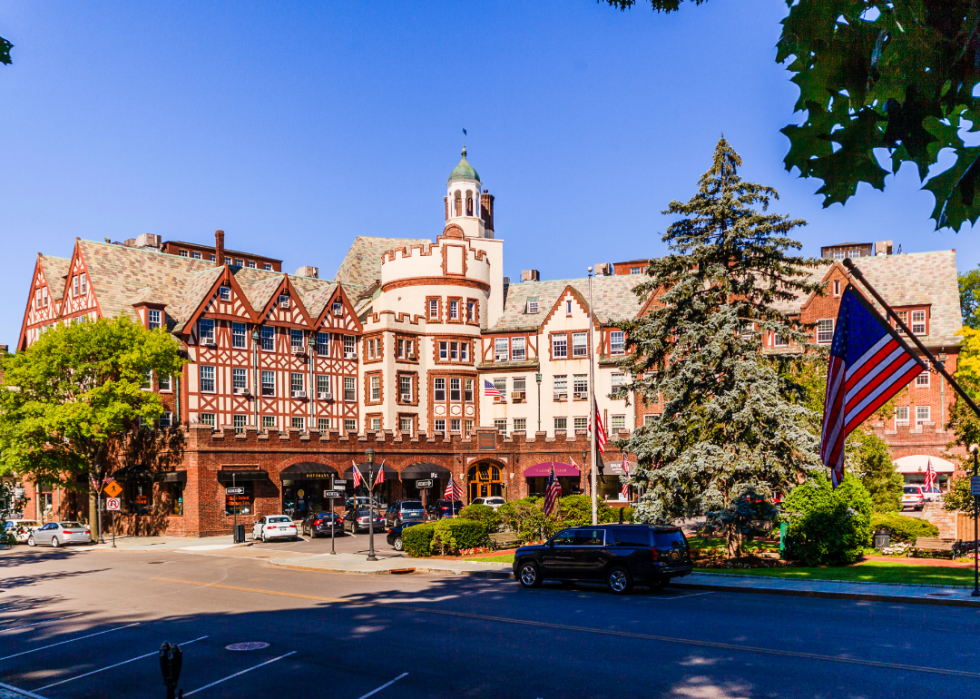
#7. Westchester County
- Average commute time: 35.1 minutes
--- #98 longest among all counties nationwide
--- 4.5% longer than state average
--- 27.2% longer than national average
- Workers with 90+ minute commute: 6.77%
- Left for work from 12 a.m. to 6 a.m.: 7.4%
- Worked outside county of residence: 33.1%
- Means of transportation: drove alone (57.5%), carpooled (7.9%), walked (4.7%), public transportation (23%), worked from home (5.5%)

25 / 30
littlenySTOCK // Shutterstock
#6. Nassau County
- Average commute time: 36.6 minutes
--- #62 longest among all counties nationwide
--- 8.9% longer than state average
--- 32.6% longer than national average
- Workers with 90+ minute commute: 8.14%
- Left for work from 12 a.m. to 6 a.m.: 9.7%
- Worked outside county of residence: 42.2%
- Means of transportation: drove alone (68.2%), carpooled (7%), walked (2.3%), public transportation (17.1%), worked from home (4.2%)

26 / 30
James Kirkikis // Shutterstock
#5. Putnam County
- Average commute time: 39.6 minutes
--- #27 longest among all counties nationwide
--- 17.9% longer than state average
--- 43.5% longer than national average
- Workers with 90+ minute commute: 9.25%
- Left for work from 12 a.m. to 6 a.m.: 11.2%
- Worked outside county of residence: 60.6%
- Means of transportation: drove alone (78.1%), carpooled (8%), walked (1.3%), public transportation (7.4%), worked from home (4.5%)

27 / 30
Victor Moussa // Shutterstock
#4. Brooklyn
- Average commute time: 43 minutes
--- #8 longest among all counties nationwide
--- 28.0% longer than state average
--- 55.8% longer than national average
- Workers with 90+ minute commute: 7.15%
- Left for work from 12 a.m. to 6 a.m.: 7.5%
- Worked outside county of residence: 49%
- Means of transportation: drove alone (18.4%), carpooled (4.1%), walked (8.7%), public transportation (61.2%), worked from home (4.6%)

28 / 30
Bjoertvedt // Wikimedia Commons
#3. Queens County
- Average commute time: 44.4 minutes
--- #7 longest among all counties nationwide
--- 32.1% longer than state average
--- 60.9% longer than national average
- Workers with 90+ minute commute: 9.36%
- Left for work from 12 a.m. to 6 a.m.: 10.1%
- Worked outside county of residence: 55.5%
- Means of transportation: drove alone (32.4%), carpooled (6.3%), walked (5.8%), public transportation (51.1%), worked from home (2.7%)
29 / 30
Roman Babakin // Shutterstock
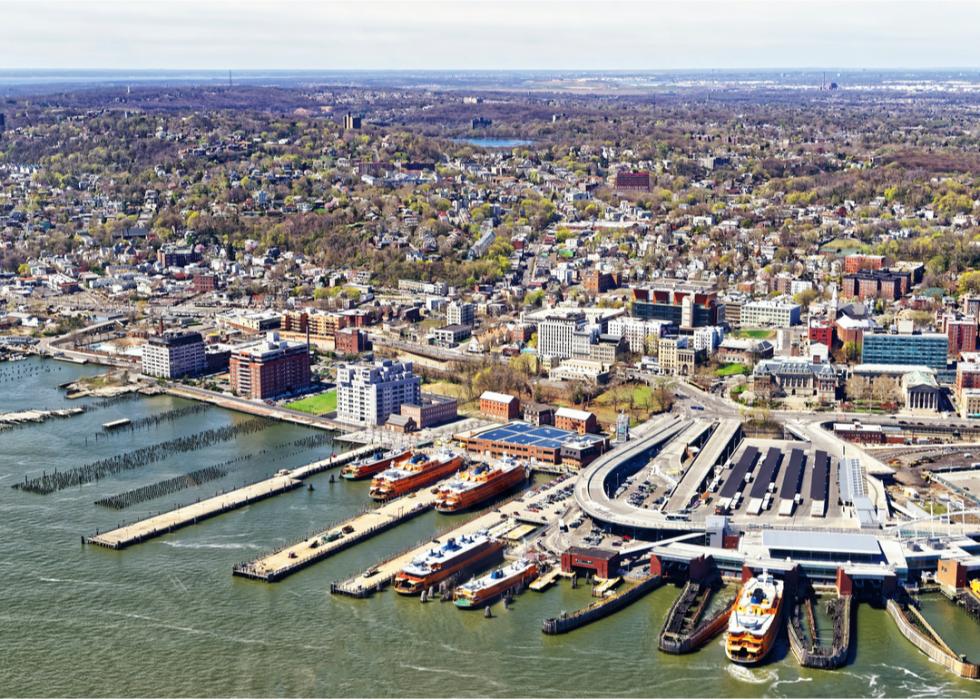
#2. Staten Island
- Average commute time: 45.2 minutes
--- #4 longest among all counties nationwide
--- 34.5% longer than state average
--- 63.8% longer than national average
- Workers with 90+ minute commute: 15.20%
- Left for work from 12 a.m. to 6 a.m.: 12.5%
- Worked outside county of residence: 43.3%
- Means of transportation: drove alone (56.3%), carpooled (7.7%), walked (2.6%), public transportation (29.7%), worked from home (2.7%)

30 / 30
Gryffindor // Wikimedia Commons
#1. Bronx County
- Average commute time: 45.4 minutes
--- #3 longest among all counties nationwide
--- 35.1% longer than state average
--- 64.5% longer than national average
- Workers with 90+ minute commute: 9.65%
- Left for work from 12 a.m. to 6 a.m.: 13.5%
- Worked outside county of residence: 55.3%
- Means of transportation: drove alone (23.5%), carpooled (4.3%), walked (7.4%), public transportation (59.8%), worked from home (3%)


