
Counties with the worst commutes in Pennsylvania
Written by:
April 14, 2021
Canva
Counties with the worst commutes in Pennsylvania
Commuting easily ranks as one of the least enjoyable parts of a person's day. Commuters encounter more physical health problems, and low-income commuters are less likely to gain financial stability—among a host of other negative impacts. And yet, America’s commutes keep getting longer as people move farther away from the office, according to census data.
Stacker compiled a list of counties with the worst commutes in Pennsylvania using data from the U.S. Census Bureau. Counties are ranked by longest average commute time in 2019. Think you have a long trip to work? Read on to compare it against the worst commutes statewide.

1 / 30
Michael J // Wikimedia Commons
#30. Wyoming County
- Average commute time: 26.2 minutes
--- #1,012 longest among all counties nationwide
--- 3.7% shorter than state average
--- 5.1% shorter than national average
- Workers with 90+ minute commute: 2.45%
- Left for work from 12 a.m. to 6 a.m.: 22.2%
- Worked outside county of residence: 44.4%
- Means of transportation: drove alone (82%), carpooled (9.7%), walked (2%), public transportation (0.5%), worked from home (5.2%)

2 / 30
Jerrye & Roy Klotz, MD // Wikimedia Commons
#29. Beaver County
- Average commute time: 26.3 minutes
--- #992 longest among all counties nationwide
--- 3.3% shorter than state average
--- 4.7% shorter than national average
- Workers with 90+ minute commute: 1.78%
- Left for work from 12 a.m. to 6 a.m.: 14.8%
- Worked outside county of residence: 45.1%
- Means of transportation: drove alone (81.5%), carpooled (8.5%), walked (2.5%), public transportation (2.1%), worked from home (4.2%)
3 / 30
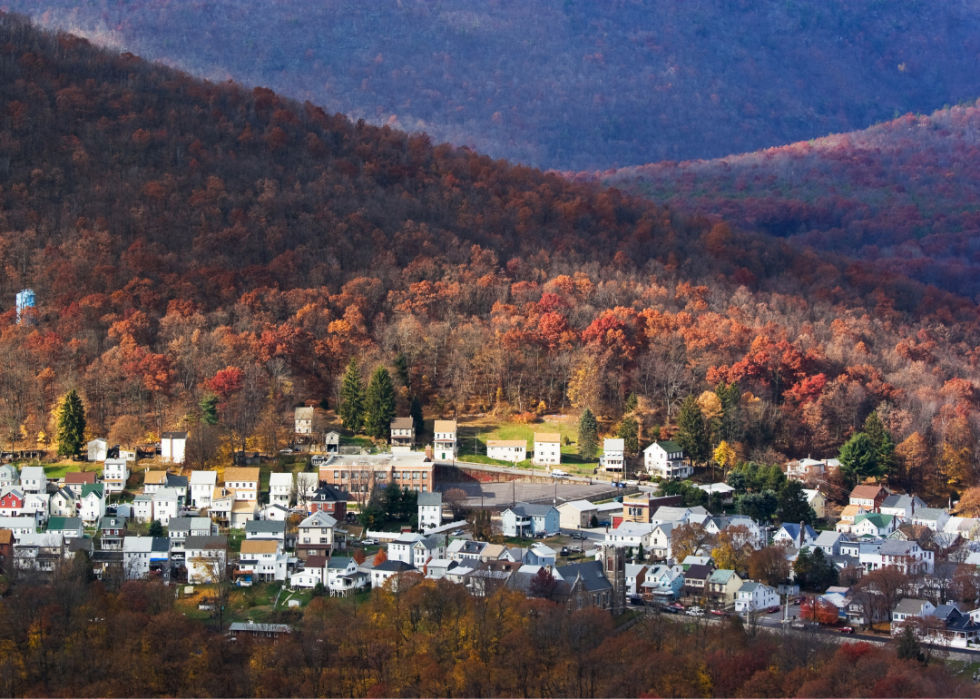
Canva
#28. Westmoreland County
- Average commute time: 26.6 minutes
--- #934 longest among all counties nationwide
--- 2.2% shorter than state average
--- 3.6% shorter than national average
- Workers with 90+ minute commute: 2.55%
- Left for work from 12 a.m. to 6 a.m.: 15.2%
- Worked outside county of residence: 34.5%
- Means of transportation: drove alone (83.6%), carpooled (7.6%), walked (2.2%), public transportation (1.3%), worked from home (4.5%)

4 / 30
Jakec // Wikimedia Commons
#27. Schuylkill County
- Average commute time: 26.6 minutes
--- #934 longest among all counties nationwide
--- 2.2% shorter than state average
--- 3.6% shorter than national average
- Workers with 90+ minute commute: 3.11%
- Left for work from 12 a.m. to 6 a.m.: 21.6%
- Worked outside county of residence: 33.2%
- Means of transportation: drove alone (83.4%), carpooled (9.7%), walked (2.6%), public transportation (0.5%), worked from home (2.8%)

5 / 30
Canadian2006 // Wikimedia Commons
#26. Bedford County
- Average commute time: 26.6 minutes
--- #934 longest among all counties nationwide
--- 2.2% shorter than state average
--- 3.6% shorter than national average
- Workers with 90+ minute commute: 4.05%
- Left for work from 12 a.m. to 6 a.m.: 22.2%
- Worked outside county of residence: 25.1%
- Means of transportation: drove alone (80.8%), carpooled (10%), walked (2.7%), public transportation (0.6%), worked from home (4.8%)

6 / 30
Generic1139 // Wikimedia Commons
#25. Washington County
- Average commute time: 26.7 minutes
--- #916 longest among all counties nationwide
--- 1.8% shorter than state average
--- 3.3% shorter than national average
- Workers with 90+ minute commute: 1.94%
- Left for work from 12 a.m. to 6 a.m.: 14.4%
- Worked outside county of residence: 34%
- Means of transportation: drove alone (81.7%), carpooled (8.2%), walked (3%), public transportation (1.4%), worked from home (4.9%)

7 / 30
Mvincec // Wikimedia Commons
#24. Butler County
- Average commute time: 27 minutes
--- #868 longest among all counties nationwide
--- 0.7% shorter than state average
--- 2.2% shorter than national average
- Workers with 90+ minute commute: 1.91%
- Left for work from 12 a.m. to 6 a.m.: 15.5%
- Worked outside county of residence: 36.3%
- Means of transportation: drove alone (84.3%), carpooled (7.2%), walked (2.5%), public transportation (0.6%), worked from home (4.8%)
8 / 30
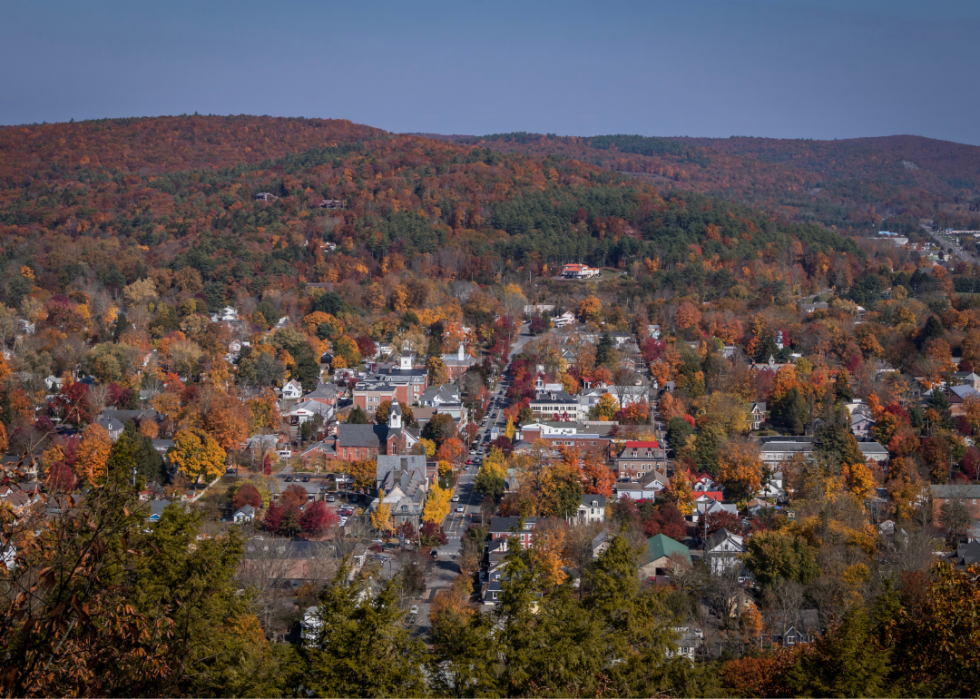
Canva
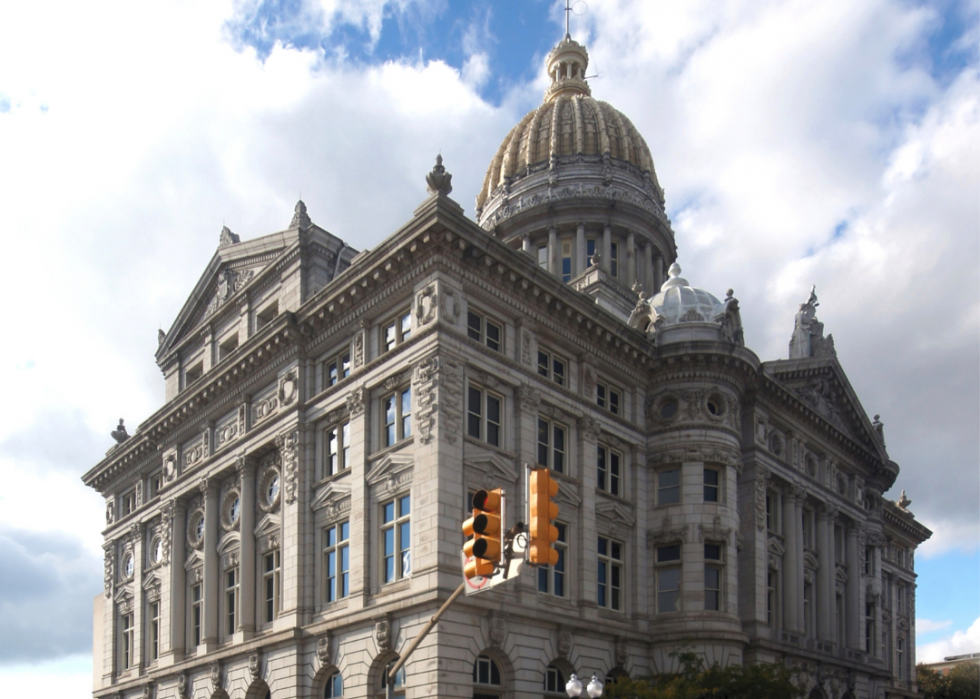
#23. Fayette County
- Average commute time: 27.1 minutes
--- #846 longest among all counties nationwide
--- 0.4% shorter than state average
--- 1.8% shorter than national average
- Workers with 90+ minute commute: 3.83%
- Left for work from 12 a.m. to 6 a.m.: 19.3%
- Worked outside county of residence: 32.2%
- Means of transportation: drove alone (84.6%), carpooled (8.9%), walked (2%), public transportation (0.8%), worked from home (3.3%)
9 / 30
ESB Professional // Shutterstock
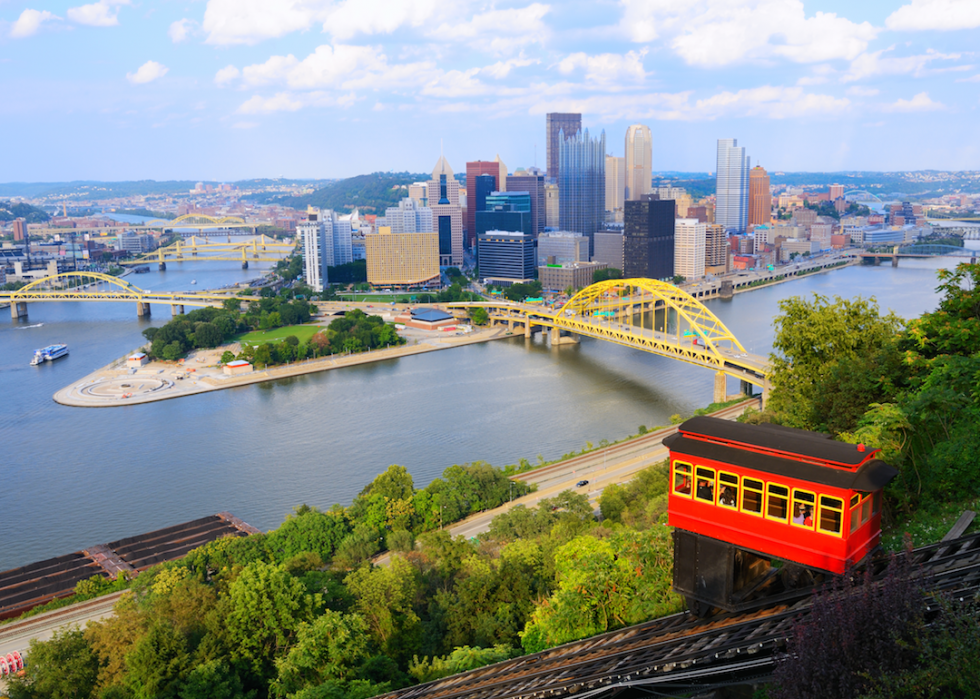
#22. Allegheny County
- Average commute time: 27.2 minutes
--- #829 longest among all counties nationwide
--- 0.0% shorter than state average
--- 1.4% shorter than national average
- Workers with 90+ minute commute: 1.76%
- Left for work from 12 a.m. to 6 a.m.: 10.7%
- Worked outside county of residence: 9%
- Means of transportation: drove alone (71%), carpooled (8.5%), walked (4.1%), public transportation (9.5%), worked from home (5.5%)
10 / 30
Canva
#21. York County
- Average commute time: 27.4 minutes
--- #805 longest among all counties nationwide
--- 0.7% longer than state average
--- 0.7% shorter than national average
- Workers with 90+ minute commute: 2.92%
- Left for work from 12 a.m. to 6 a.m.: 17.9%
- Worked outside county of residence: 19.4%
- Means of transportation: drove alone (84.5%), carpooled (8.5%), walked (1.5%), public transportation (0.8%), worked from home (3.7%)

11 / 30
Shuvaev // Wikimedia Commons
#20. Northampton County
- Average commute time: 28 minutes
--- #699 longest among all counties nationwide
--- 2.9% longer than state average
--- 1.4% longer than national average
- Workers with 90+ minute commute: 4.44%
- Left for work from 12 a.m. to 6 a.m.: 13.6%
- Worked outside county of residence: 30.9%
- Means of transportation: drove alone (82.8%), carpooled (6.9%), walked (2.5%), public transportation (1.6%), worked from home (4.5%)

12 / 30
Nicholas // Wikimedia Commons
#19. Susquehanna County
- Average commute time: 28.3 minutes
--- #663 longest among all counties nationwide
--- 4.0% longer than state average
--- 2.5% longer than national average
- Workers with 90+ minute commute: 2.64%
- Left for work from 12 a.m. to 6 a.m.: 18.6%
- Worked outside county of residence: 27.6%
- Means of transportation: drove alone (82.8%), carpooled (8.7%), walked (2.1%), public transportation (0.1%), worked from home (5.8%)

13 / 30
Pixabay
#18. Adams County
- Average commute time: 28.3 minutes
--- #663 longest among all counties nationwide
--- 4.0% longer than state average
--- 2.5% longer than national average
- Workers with 90+ minute commute: 4.14%
- Left for work from 12 a.m. to 6 a.m.: 21.6%
- Worked outside county of residence: 34.5%
- Means of transportation: drove alone (81.9%), carpooled (9.1%), walked (3.6%), public transportation (0.4%), worked from home (4%)

14 / 30
Nyttend // Wikimedia Commons
#17. Forest County
- Average commute time: 28.3 minutes
--- #663 longest among all counties nationwide
--- 4.0% longer than state average
--- 2.5% longer than national average
- Workers with 90+ minute commute: 5.77%
- Left for work from 12 a.m. to 6 a.m.: 19.6%
- Worked outside county of residence: 41.7%
- Means of transportation: drove alone (79.9%), carpooled (5.1%), walked (8.4%), public transportation (0.1%), worked from home (5%)

15 / 30
Nyttend // Wikimedia Commons
#16. Greene County
- Average commute time: 28.4 minutes
--- #642 longest among all counties nationwide
--- 4.4% longer than state average
--- 2.9% longer than national average
- Workers with 90+ minute commute: 2.65%
- Left for work from 12 a.m. to 6 a.m.: 18.8%
- Worked outside county of residence: 25.6%
- Means of transportation: drove alone (84.3%), carpooled (7.9%), walked (2.9%), public transportation (0.1%), worked from home (3.3%)

16 / 30
Camerafiend // Wikimedia Commons
#15. Chester County
- Average commute time: 28.6 minutes
--- #615 longest among all counties nationwide
--- 5.1% longer than state average
--- 3.6% longer than national average
- Workers with 90+ minute commute: 2.60%
- Left for work from 12 a.m. to 6 a.m.: 10.2%
- Worked outside county of residence: 28.3%
- Means of transportation: drove alone (79%), carpooled (6.9%), walked (2.4%), public transportation (2.6%), worked from home (8.1%)

17 / 30
Douglas Muth // Wikimedia Commons
#14. Montgomery County
- Average commute time: 29.2 minutes
--- #536 longest among all counties nationwide
--- 7.4% longer than state average
--- 5.8% longer than national average
- Workers with 90+ minute commute: 2.54%
- Left for work from 12 a.m. to 6 a.m.: 9.7%
- Worked outside county of residence: 32.7%
- Means of transportation: drove alone (78.5%), carpooled (6.4%), walked (2.2%), public transportation (5.3%), worked from home (6.8%)

18 / 30
Andrew Rodland // Wikimedia Commons
#13. Wayne County
- Average commute time: 29.3 minutes
--- #522 longest among all counties nationwide
--- 7.7% longer than state average
--- 6.2% longer than national average
- Workers with 90+ minute commute: 5.10%
- Left for work from 12 a.m. to 6 a.m.: 15.6%
- Worked outside county of residence: 33.1%
- Means of transportation: drove alone (82%), carpooled (7.4%), walked (2.6%), public transportation (0.7%), worked from home (5.8%)

19 / 30
Smallbones // Wikimedia Commons
#12. Delaware County
- Average commute time: 29.7 minutes
--- #477 longest among all counties nationwide
--- 9.2% longer than state average
--- 7.6% longer than national average
- Workers with 90+ minute commute: 2.22%
- Left for work from 12 a.m. to 6 a.m.: 10.6%
- Worked outside county of residence: 42.7%
- Means of transportation: drove alone (73%), carpooled (7.4%), walked (3.4%), public transportation (10.4%), worked from home (4.9%)

20 / 30
Generic1139 // Wikimedia Commons
#11. Armstrong County
- Average commute time: 30.7 minutes
--- #371 longest among all counties nationwide
--- 12.9% longer than state average
--- 11.2% longer than national average
- Workers with 90+ minute commute: 4.43%
- Left for work from 12 a.m. to 6 a.m.: 22.6%
- Worked outside county of residence: 54%
- Means of transportation: drove alone (83.4%), carpooled (9%), walked (2.3%), public transportation (0.7%), worked from home (3.5%)

21 / 30
Smallbones // Wikimedia Commons
#10. Bucks County
- Average commute time: 30.8 minutes
--- #362 longest among all counties nationwide
--- 13.2% longer than state average
--- 11.6% longer than national average
- Workers with 90+ minute commute: 3.98%
- Left for work from 12 a.m. to 6 a.m.: 11.5%
- Worked outside county of residence: 30.5%
- Means of transportation: drove alone (81.9%), carpooled (6.4%), walked (1.7%), public transportation (3.3%), worked from home (6%)

22 / 30
Joe Calzarette // Wikimedia Commons
#9. Huntingdon County
- Average commute time: 31.1 minutes
--- #334 longest among all counties nationwide
--- 14.3% longer than state average
--- 12.7% longer than national average
- Workers with 90+ minute commute: 6.32%
- Left for work from 12 a.m. to 6 a.m.: 20.2%
- Worked outside county of residence: 37.5%
- Means of transportation: drove alone (78%), carpooled (11.7%), walked (4.8%), public transportation (0.2%), worked from home (3.6%)

23 / 30
Nyttend // Wikimedia Commons
#8. Juniata County
- Average commute time: 32.2 minutes
--- #247 longest among all counties nationwide
--- 18.4% longer than state average
--- 16.7% longer than national average
- Workers with 90+ minute commute: 5.50%
- Left for work from 12 a.m. to 6 a.m.: 27.7%
- Worked outside county of residence: 47.3%
- Means of transportation: drove alone (79.1%), carpooled (10.7%), walked (2.8%), public transportation (0.2%), worked from home (6.7%)

24 / 30
Smallbones // Wikimedia Commons
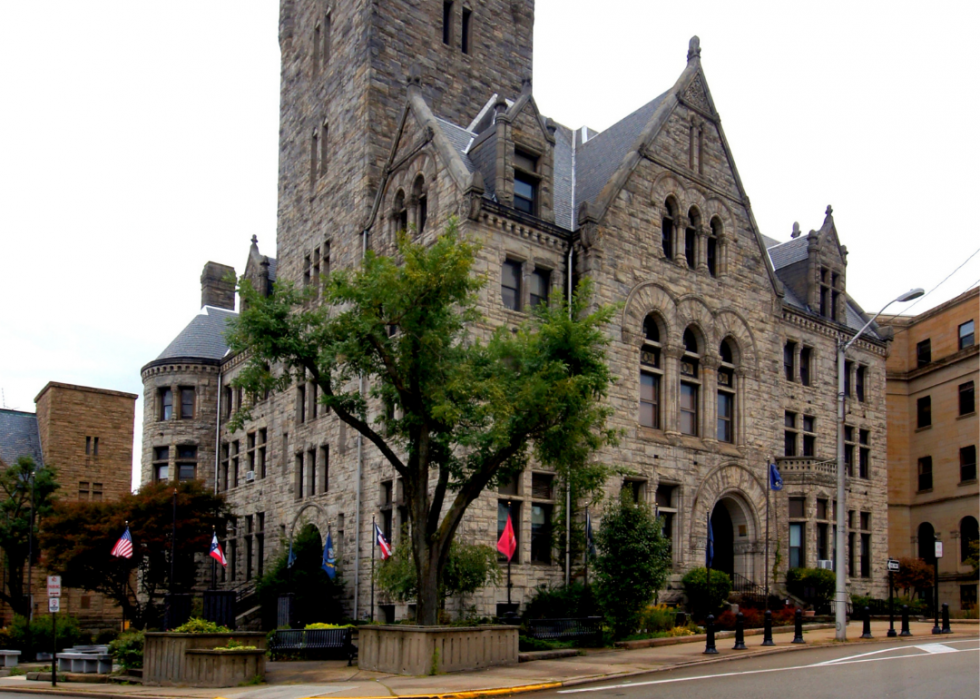
#7. Fulton County
- Average commute time: 32.8 minutes
--- #208 longest among all counties nationwide
--- 20.6% longer than state average
--- 18.8% longer than national average
- Workers with 90+ minute commute: 5.63%
- Left for work from 12 a.m. to 6 a.m.: 28.5%
- Worked outside county of residence: 26%
- Means of transportation: drove alone (80.2%), carpooled (12.7%), walked (2.4%), public transportation (0%), worked from home (3.8%)

25 / 30
Smallbones // Wikimedia Commons
#6. Perry County
- Average commute time: 32.9 minutes
--- #202 longest among all counties nationwide
--- 21.0% longer than state average
--- 19.2% longer than national average
- Workers with 90+ minute commute: 2.99%
- Left for work from 12 a.m. to 6 a.m.: 23.0%
- Worked outside county of residence: 65%
- Means of transportation: drove alone (79%), carpooled (12.9%), walked (1.9%), public transportation (0.2%), worked from home (5.4%)
26 / 30
Canva
#5. Carbon County
- Average commute time: 32.9 minutes
--- #202 longest among all counties nationwide
--- 21.0% longer than state average
--- 19.2% longer than national average
- Workers with 90+ minute commute: 4.60%
- Left for work from 12 a.m. to 6 a.m.: 18.8%
- Worked outside county of residence: 57.1%
- Means of transportation: drove alone (83.3%), carpooled (8.9%), walked (1.9%), public transportation (0.5%), worked from home (4.6%)

27 / 30
Michael Barera // Wikimedia Commons
#4. Philadelphia County
- Average commute time: 33.6 minutes
--- #160 longest among all counties nationwide
--- 23.5% longer than state average
--- 21.7% longer than national average
- Workers with 90+ minute commute: 4.36%
- Left for work from 12 a.m. to 6 a.m.: 10.9%
- Worked outside county of residence: 19%
- Means of transportation: drove alone (50.3%), carpooled (8.2%), walked (8.5%), public transportation (24.9%), worked from home (4.2%)

28 / 30
Nicholas // Wikimedia Commons
#3. Sullivan County
- Average commute time: 33.9 minutes
--- #144 longest among all counties nationwide
--- 24.6% longer than state average
--- 22.8% longer than national average
- Workers with 90+ minute commute: 4.37%
- Left for work from 12 a.m. to 6 a.m.: 24.4%
- Worked outside county of residence: 47.7%
- Means of transportation: drove alone (76.8%), carpooled (11.7%), walked (2.6%), public transportation (0.2%), worked from home (7.5%)

29 / 30
Nicholas // Wikimedia Commons
#2. Monroe County
- Average commute time: 39.4 minutes
--- #28 longest among all counties nationwide
--- 44.9% longer than state average
--- 42.8% longer than national average
- Workers with 90+ minute commute: 14.04%
- Left for work from 12 a.m. to 6 a.m.: 20.8%
- Worked outside county of residence: 15.7%
- Means of transportation: drove alone (78.2%), carpooled (10.1%), walked (1.6%), public transportation (4.4%), worked from home (4.7%)
30 / 30
Canva
#1. Pike County
- Average commute time: 46.8 minutes
--- #2 longest among all counties nationwide
--- 72.1% longer than state average
--- 69.6% longer than national average
- Workers with 90+ minute commute: 17.67%
- Left for work from 12 a.m. to 6 a.m.: 23.0%
- Worked outside county of residence: 19.6%
- Means of transportation: drove alone (82.8%), carpooled (7.8%), walked (1.1%), public transportation (2.8%), worked from home (4.5%)


