
Counties with the worst commutes in Tennessee
Written by:
April 14, 2021
Canva
Counties with the worst commutes in Tennessee
Commuting easily ranks as one of the least enjoyable parts of a person's day. Commuters encounter more physical health problems, and low-income commuters are less likely to gain financial stability—among a host of other negative impacts. And yet, America’s commutes keep getting longer as people move farther away from the office, according to census data.
Stacker compiled a list of counties with the worst commutes in Tennessee using data from the U.S. Census Bureau. Counties are ranked by longest average commute time in 2019. Think you have a long trip to work? Read on to compare it against the worst commutes statewide.

1 / 30
Ichabod // Wikimedia Commons
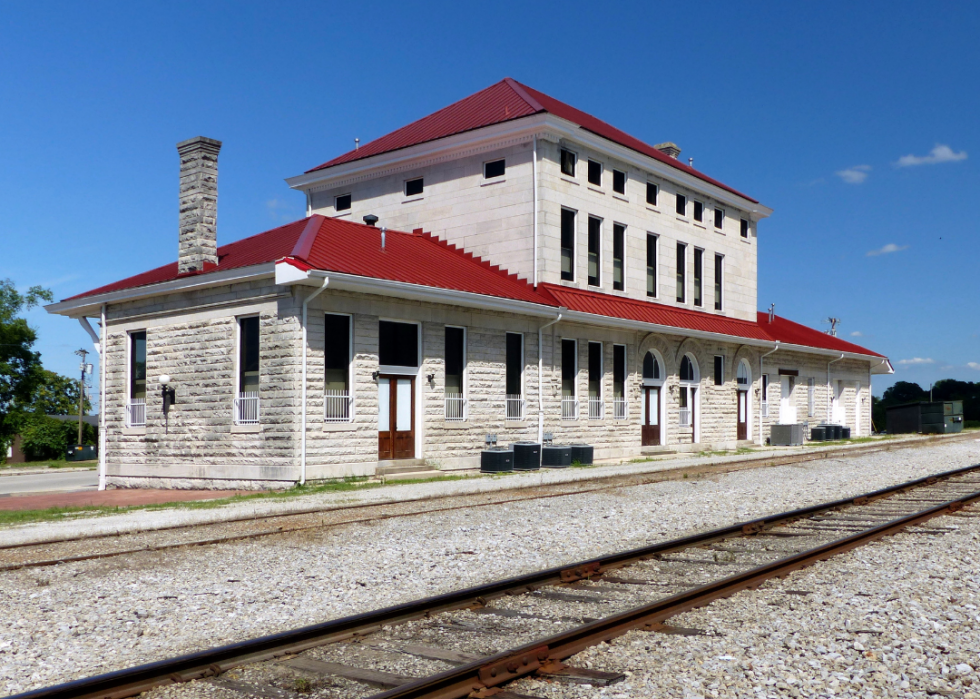
#30. Sumner County
- Average commute time: 29.3 minutes
--- #522 longest among all counties nationwide
--- 16.3% longer than state average
--- 6.2% longer than national average
- Workers with 90+ minute commute: 1.86%
- Left for work from 12 a.m. to 6 a.m.: 17.5%
- Worked outside county of residence: 44.7%
- Means of transportation: drove alone (82.7%), carpooled (9.2%), walked (0.5%), public transportation (0.2%), worked from home (5.9%)

2 / 30
Brian Stansberry // Wikimedia Commons
#29. Polk County
- Average commute time: 29.4 minutes
--- #507 longest among all counties nationwide
--- 16.7% longer than state average
--- 6.5% longer than national average
- Workers with 90+ minute commute: 2.54%
- Left for work from 12 a.m. to 6 a.m.: 17.2%
- Worked outside county of residence: 48.9%
- Means of transportation: drove alone (84.3%), carpooled (10.7%), walked (0.4%), public transportation (0%), worked from home (3.6%)

3 / 30
Brian Stansberry // Wikimedia Commons
#28. Marion County
- Average commute time: 29.4 minutes
--- #507 longest among all counties nationwide
--- 16.7% longer than state average
--- 6.5% longer than national average
- Workers with 90+ minute commute: 2.73%
- Left for work from 12 a.m. to 6 a.m.: 29.7%
- Worked outside county of residence: 42.2%
- Means of transportation: drove alone (86.6%), carpooled (7%), walked (1.3%), public transportation (0.1%), worked from home (4.4%)
4 / 30
Canva
#27. Maury County
- Average commute time: 29.8 minutes
--- #464 longest among all counties nationwide
--- 18.3% longer than state average
--- 8.0% longer than national average
- Workers with 90+ minute commute: 2.43%
- Left for work from 12 a.m. to 6 a.m.: 21.0%
- Worked outside county of residence: 39.9%
- Means of transportation: drove alone (86.6%), carpooled (7.3%), walked (0.4%), public transportation (0.2%), worked from home (4.7%)

5 / 30
RealElectrical // Wikimedia Commons
#26. Hardeman County
- Average commute time: 30.1 minutes
--- #440 longest among all counties nationwide
--- 19.4% longer than state average
--- 9.1% longer than national average
- Workers with 90+ minute commute: 4.61%
- Left for work from 12 a.m. to 6 a.m.: 22.6%
- Worked outside county of residence: 32.4%
- Means of transportation: drove alone (86.3%), carpooled (8.4%), walked (0.8%), public transportation (0.7%), worked from home (3.2%)

6 / 30
Ichabod // Wikimedia Commons
#25. Marshall County
- Average commute time: 30.2 minutes
--- #427 longest among all counties nationwide
--- 19.8% longer than state average
--- 9.4% longer than national average
- Workers with 90+ minute commute: 2.36%
- Left for work from 12 a.m. to 6 a.m.: 24.2%
- Worked outside county of residence: 47.4%
- Means of transportation: drove alone (88.8%), carpooled (7.2%), walked (0.5%), public transportation (0.1%), worked from home (3%)

7 / 30
Brian Stansberry // Wikimedia Commons
#24. Van Buren County
- Average commute time: 30.7 minutes
--- #371 longest among all counties nationwide
--- 21.8% longer than state average
--- 11.2% longer than national average
- Workers with 90+ minute commute: 1.08%
- Left for work from 12 a.m. to 6 a.m.: 27.4%
- Worked outside county of residence: 62.6%
- Means of transportation: drove alone (84.7%), carpooled (5.1%), walked (0.9%), public transportation (0.4%), worked from home (6.4%)

8 / 30
Brian Stansberry // Wikimedia Commons
#23. Robertson County
- Average commute time: 30.7 minutes
--- #371 longest among all counties nationwide
--- 21.8% longer than state average
--- 11.2% longer than national average
- Workers with 90+ minute commute: 2.33%
- Left for work from 12 a.m. to 6 a.m.: 21.0%
- Worked outside county of residence: 53.2%
- Means of transportation: drove alone (83.9%), carpooled (8.8%), walked (0.6%), public transportation (0.4%), worked from home (4.6%)

9 / 30
Brian Stansberry // Wikimedia Commons
#22. Jackson County
- Average commute time: 30.7 minutes
--- #371 longest among all counties nationwide
--- 21.8% longer than state average
--- 11.2% longer than national average
- Workers with 90+ minute commute: 3.81%
- Left for work from 12 a.m. to 6 a.m.: 20.0%
- Worked outside county of residence: 63.5%
- Means of transportation: drove alone (86.1%), carpooled (9.9%), walked (1.3%), public transportation (0.1%), worked from home (2%)

10 / 30
Ichabod // Wikimedia Commons
#21. Wilson County
- Average commute time: 30.8 minutes
--- #362 longest among all counties nationwide
--- 22.2% longer than state average
--- 11.6% longer than national average
- Workers with 90+ minute commute: 2.01%
- Left for work from 12 a.m. to 6 a.m.: 17.0%
- Worked outside county of residence: 51.4%
- Means of transportation: drove alone (82.5%), carpooled (9%), walked (0.6%), public transportation (0.8%), worked from home (6.1%)
11 / 30
Canva
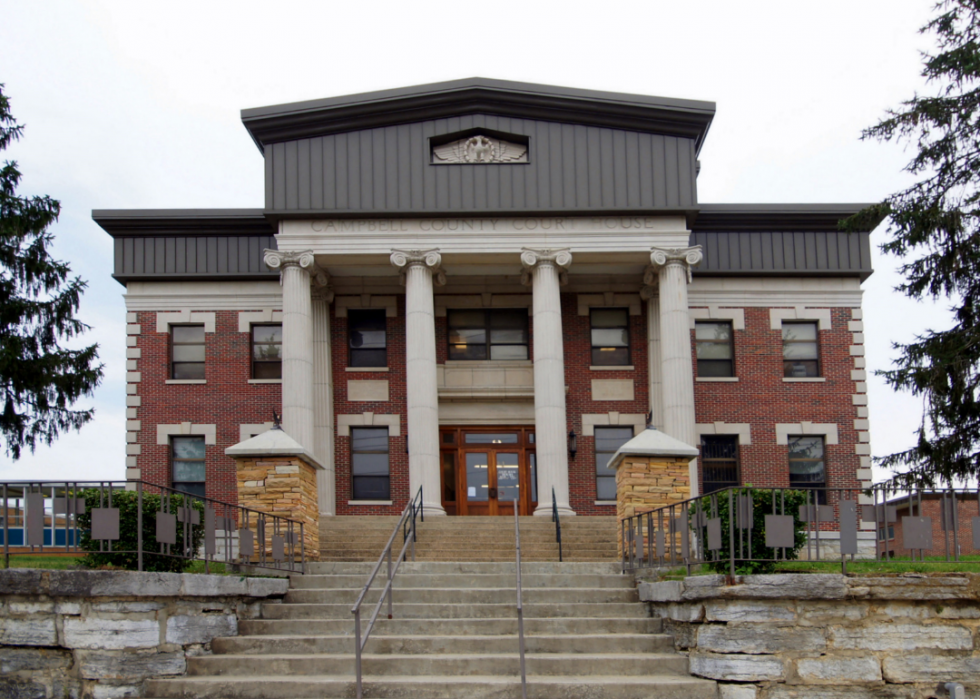
#20. Campbell County
- Average commute time: 30.8 minutes
--- #362 longest among all counties nationwide
--- 22.2% longer than state average
--- 11.6% longer than national average
- Workers with 90+ minute commute: 3.13%
- Left for work from 12 a.m. to 6 a.m.: 23.3%
- Worked outside county of residence: 36.6%
- Means of transportation: drove alone (82.7%), carpooled (11.7%), walked (0.9%), public transportation (0%), worked from home (4.2%)

12 / 30
Brian Stansberry // Wikimedia Commons
#19. Meigs County
- Average commute time: 30.9 minutes
--- #351 longest among all counties nationwide
--- 22.6% longer than state average
--- 12.0% longer than national average
- Workers with 90+ minute commute: 2.33%
- Left for work from 12 a.m. to 6 a.m.: 26.8%
- Worked outside county of residence: 70.7%
- Means of transportation: drove alone (84.4%), carpooled (10.9%), walked (0.2%), public transportation (0.6%), worked from home (2.5%)

13 / 30
Brian Stansberry // Wikimedia Commons
#18. Clay County
- Average commute time: 31 minutes
--- #344 longest among all counties nationwide
--- 23.0% longer than state average
--- 12.3% longer than national average
- Workers with 90+ minute commute: 5.07%
- Left for work from 12 a.m. to 6 a.m.: 14.7%
- Worked outside county of residence: 42.2%
- Means of transportation: drove alone (82.7%), carpooled (10.5%), walked (1%), public transportation (0.1%), worked from home (1.8%)

14 / 30
Brian Stansberry // Wikimedia Commons
#17. Smith County
- Average commute time: 31.3 minutes
--- #316 longest among all counties nationwide
--- 24.2% longer than state average
--- 13.4% longer than national average
- Workers with 90+ minute commute: 3.75%
- Left for work from 12 a.m. to 6 a.m.: 27.3%
- Worked outside county of residence: 48.5%
- Means of transportation: drove alone (84.8%), carpooled (9.1%), walked (0.3%), public transportation (0.2%), worked from home (4%)

15 / 30
Brian Stansberry // Wikimedia Commons
#16. Wayne County
- Average commute time: 31.7 minutes
--- #282 longest among all counties nationwide
--- 25.8% longer than state average
--- 14.9% longer than national average
- Workers with 90+ minute commute: 6.61%
- Left for work from 12 a.m. to 6 a.m.: 21.6%
- Worked outside county of residence: 20.5%
- Means of transportation: drove alone (87.9%), carpooled (7.7%), walked (0.1%), public transportation (0%), worked from home (2.8%)

16 / 30
Pollinator // Wikimedia Commons
#15. Cannon County
- Average commute time: 32.1 minutes
--- #257 longest among all counties nationwide
--- 27.4% longer than state average
--- 16.3% longer than national average
- Workers with 90+ minute commute: 1.59%
- Left for work from 12 a.m. to 6 a.m.: 27.8%
- Worked outside county of residence: 66.4%
- Means of transportation: drove alone (86.5%), carpooled (7.3%), walked (1.4%), public transportation (0%), worked from home (4.6%)

17 / 30
Brian Stansberry // Wikimedia Commons
#14. Bledsoe County
- Average commute time: 32.2 minutes
--- #247 longest among all counties nationwide
--- 27.8% longer than state average
--- 16.7% longer than national average
- Workers with 90+ minute commute: 5.12%
- Left for work from 12 a.m. to 6 a.m.: 29.1%
- Worked outside county of residence: 48.3%
- Means of transportation: drove alone (76%), carpooled (13.6%), walked (3.1%), public transportation (0.5%), worked from home (5.9%)

18 / 30
AppalachianCentrist // Wikimedia Commons
#13. Grainger County
- Average commute time: 32.3 minutes
--- #240 longest among all counties nationwide
--- 28.2% longer than state average
--- 17.0% longer than national average
- Workers with 90+ minute commute: 4.19%
- Left for work from 12 a.m. to 6 a.m.: 18.0%
- Worked outside county of residence: 64.1%
- Means of transportation: drove alone (78.1%), carpooled (12.9%), walked (1.1%), public transportation (0.4%), worked from home (7%)

19 / 30
Ichabod // Wikimedia Commons
#12. Macon County
- Average commute time: 32.5 minutes
--- #228 longest among all counties nationwide
--- 29.0% longer than state average
--- 17.8% longer than national average
- Workers with 90+ minute commute: 6.47%
- Left for work from 12 a.m. to 6 a.m.: 24.7%
- Worked outside county of residence: 43.7%
- Means of transportation: drove alone (82.1%), carpooled (12.9%), walked (0.5%), public transportation (0%), worked from home (3.2%)

20 / 30
Brian Stansberry // Wikimedia Commons
#11. Dickson County
- Average commute time: 32.6 minutes
--- #220 longest among all counties nationwide
--- 29.4% longer than state average
--- 18.1% longer than national average
- Workers with 90+ minute commute: 3.27%
- Left for work from 12 a.m. to 6 a.m.: 20.9%
- Worked outside county of residence: 41.7%
- Means of transportation: drove alone (83.2%), carpooled (11.9%), walked (0.2%), public transportation (0.1%), worked from home (3.5%)

21 / 30
Thomas R Machnitzki (thomas@machnitzki.com) // Wikimedia Commons
#10. Fayette County
- Average commute time: 33 minutes
--- #195 longest among all counties nationwide
--- 31.0% longer than state average
--- 19.6% longer than national average
- Workers with 90+ minute commute: 2.04%
- Left for work from 12 a.m. to 6 a.m.: 17.0%
- Worked outside county of residence: 66.1%
- Means of transportation: drove alone (86.8%), carpooled (6.9%), walked (0.4%), public transportation (0.1%), worked from home (4.6%)

22 / 30
Thomas R Machnitzki (thomasmachnitzki.com) // Wikimedia Commons
#9. Tipton County
- Average commute time: 33.4 minutes
--- #171 longest among all counties nationwide
--- 32.5% longer than state average
--- 21.0% longer than national average
- Workers with 90+ minute commute: 1.46%
- Left for work from 12 a.m. to 6 a.m.: 17.6%
- Worked outside county of residence: 63.5%
- Means of transportation: drove alone (87.9%), carpooled (7.9%), walked (0.6%), public transportation (0%), worked from home (2.2%)

23 / 30
Brian Stansberry // Wikimedia Commons
#8. Cheatham County
- Average commute time: 33.4 minutes
--- #171 longest among all counties nationwide
--- 32.5% longer than state average
--- 21.0% longer than national average
- Workers with 90+ minute commute: 2.24%
- Left for work from 12 a.m. to 6 a.m.: 20.3%
- Worked outside county of residence: 68.9%
- Means of transportation: drove alone (82.3%), carpooled (10.5%), walked (0.6%), public transportation (0.2%), worked from home (4.9%)

24 / 30
Nyttend // Wikimedia Commons
#7. Houston County
- Average commute time: 33.5 minutes
--- #168 longest among all counties nationwide
--- 32.9% longer than state average
--- 21.4% longer than national average
- Workers with 90+ minute commute: 4.22%
- Left for work from 12 a.m. to 6 a.m.: 25.9%
- Worked outside county of residence: 55.3%
- Means of transportation: drove alone (78%), carpooled (9.7%), walked (6.5%), public transportation (0.8%), worked from home (3%)

25 / 30
Christina Blust // Wikimedia Commons
#6. Humphreys County
- Average commute time: 33.6 minutes
--- #160 longest among all counties nationwide
--- 33.3% longer than state average
--- 21.7% longer than national average
- Workers with 90+ minute commute: 5.96%
- Left for work from 12 a.m. to 6 a.m.: 26.2%
- Worked outside county of residence: 42.6%
- Means of transportation: drove alone (86.7%), carpooled (9.3%), walked (0.6%), public transportation (0%), worked from home (2.8%)

26 / 30
Brian Stansberry // Wikimedia Commons
#5. Union County
- Average commute time: 33.7 minutes
--- #158 longest among all counties nationwide
--- 33.7% longer than state average
--- 22.1% longer than national average
- Workers with 90+ minute commute: 1.87%
- Left for work from 12 a.m. to 6 a.m.: 18.9%
- Worked outside county of residence: 63.5%
- Means of transportation: drove alone (84%), carpooled (8.3%), walked (0.2%), public transportation (0.1%), worked from home (6.5%)

27 / 30
Brian Stansberry // Wikimedia Commons
#4. Sequatchie County
- Average commute time: 34.2 minutes
--- #131 longest among all counties nationwide
--- 35.7% longer than state average
--- 23.9% longer than national average
- Workers with 90+ minute commute: 4.00%
- Left for work from 12 a.m. to 6 a.m.: 28.3%
- Worked outside county of residence: 50.4%
- Means of transportation: drove alone (80.7%), carpooled (13%), walked (1.1%), public transportation (0.2%), worked from home (3.3%)

28 / 30
Geobeedude // Wikimedia Commons
#3. Stewart County
- Average commute time: 35.5 minutes
--- #89 longest among all counties nationwide
--- 40.9% longer than state average
--- 28.6% longer than national average
- Workers with 90+ minute commute: 9.02%
- Left for work from 12 a.m. to 6 a.m.: 28.0%
- Worked outside county of residence: 41.7%
- Means of transportation: drove alone (83.1%), carpooled (11.3%), walked (1.2%), public transportation (0.3%), worked from home (2.5%)

29 / 30
Ichabod // Wikimedia Commons
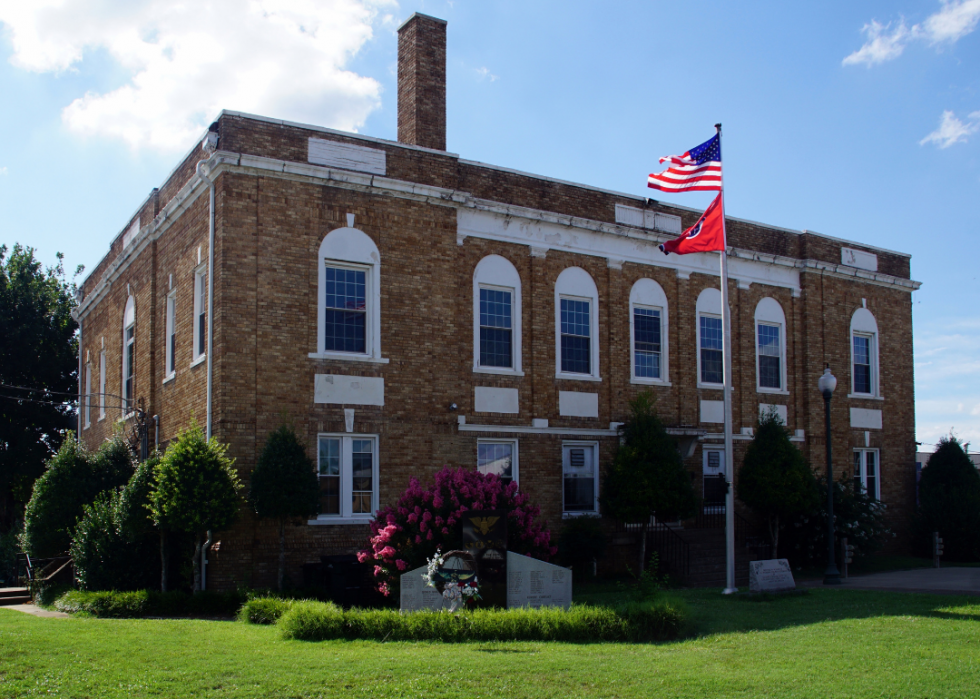
#2. Trousdale County
- Average commute time: 35.7 minutes
--- #81 longest among all counties nationwide
--- 41.7% longer than state average
--- 29.3% longer than national average
- Workers with 90+ minute commute: 3.96%
- Left for work from 12 a.m. to 6 a.m.: 26.7%
- Worked outside county of residence: 65.2%
- Means of transportation: drove alone (79.4%), carpooled (15.9%), walked (0.2%), public transportation (0%), worked from home (4.4%)
30 / 30
Canva
#1. Hickman County
- Average commute time: 37.1 minutes
--- #56 longest among all counties nationwide
--- 47.2% longer than state average
--- 34.4% longer than national average
- Workers with 90+ minute commute: 4.87%
- Left for work from 12 a.m. to 6 a.m.: 21.8%
- Worked outside county of residence: 61.1%
- Means of transportation: drove alone (80%), carpooled (11.6%), walked (1.7%), public transportation (0.1%), worked from home (4.1%)


