
Counties with the worst commutes in Texas
Written by:
April 14, 2021
Larry D. Moore // Wikimedia Commons
Counties with the worst commutes in Texas
Commuting easily ranks as one of the least enjoyable parts of a person's day. Commuters encounter more physical health problems, and low-income commuters are less likely to gain financial stability—among a host of other negative impacts. And yet, America’s commutes keep getting longer as people move farther away from the office, according to census data.
Stacker compiled a list of counties with the worst commutes in Texas using data from the U.S. Census Bureau. Counties are ranked by longest average commute time in 2019. Think you have a long trip to work? Read on to compare it against the worst commutes statewide.

1 / 30
Aualliso // Wikimedia Commons
#30. Llano County
- Average commute time: 31 minutes
--- #344 longest among all counties nationwide
--- 16.5% longer than state average
--- 12.3% longer than national average
- Workers with 90+ minute commute: 6.36%
- Left for work from 12 a.m. to 6 a.m.: 14.5%
- Worked outside county of residence: 46.4%
- Means of transportation: drove alone (73.4%), carpooled (16.6%), walked (1.9%), public transportation (0%), worked from home (6.5%)

2 / 30
Michael Barera // Wikimedia Commons
#29. Hunt County
- Average commute time: 31.3 minutes
--- #316 longest among all counties nationwide
--- 17.7% longer than state average
--- 13.4% longer than national average
- Workers with 90+ minute commute: 5.37%
- Left for work from 12 a.m. to 6 a.m.: 18.2%
- Worked outside county of residence: 41.6%
- Means of transportation: drove alone (82%), carpooled (10.7%), walked (1.8%), public transportation (0.2%), worked from home (4%)

3 / 30
Larry D. Moore // Wikimedia Commons
#28. Johnson County
- Average commute time: 31.4 minutes
--- #307 longest among all counties nationwide
--- 18.0% longer than state average
--- 13.8% longer than national average
- Workers with 90+ minute commute: 3.24%
- Left for work from 12 a.m. to 6 a.m.: 14.8%
- Worked outside county of residence: 50.8%
- Means of transportation: drove alone (87.7%), carpooled (7.2%), walked (1%), public transportation (0.1%), worked from home (3.2%)

4 / 30
Wrbalusek // Wikimedia Commons
#27. Jasper County
- Average commute time: 31.5 minutes
--- #298 longest among all counties nationwide
--- 18.4% longer than state average
--- 14.1% longer than national average
- Workers with 90+ minute commute: 4.69%
- Left for work from 12 a.m. to 6 a.m.: 28.4%
- Worked outside county of residence: 40.5%
- Means of transportation: drove alone (82.4%), carpooled (9.2%), walked (1.4%), public transportation (0.1%), worked from home (2.2%)

5 / 30
Larry D. Moore // Wikimedia Commons
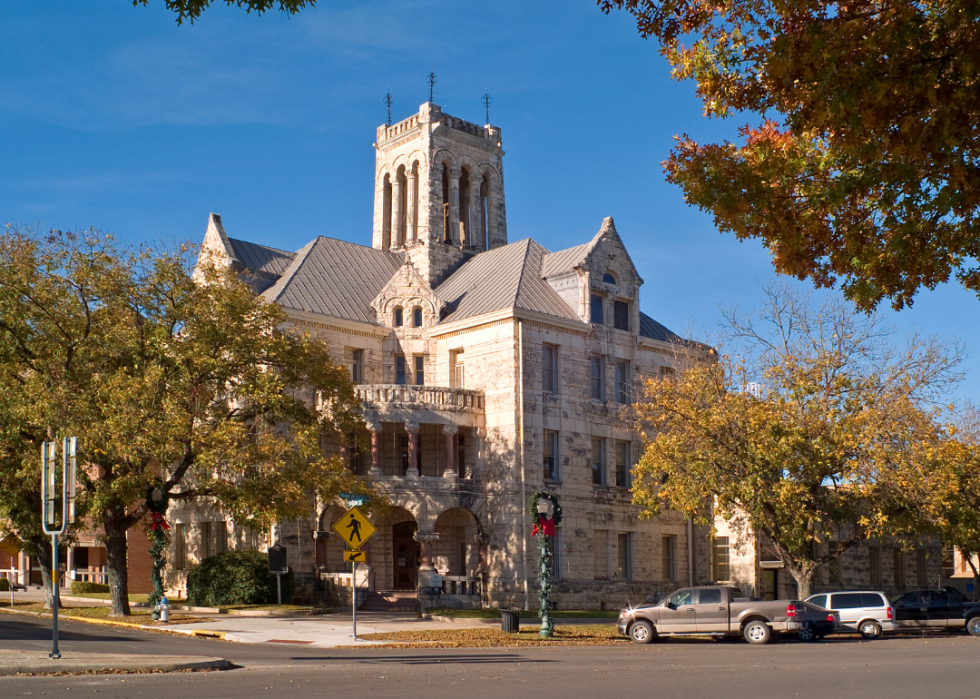
#26. Medina County
- Average commute time: 31.6 minutes
--- #290 longest among all counties nationwide
--- 18.8% longer than state average
--- 14.5% longer than national average
- Workers with 90+ minute commute: 3.57%
- Left for work from 12 a.m. to 6 a.m.: 18.8%
- Worked outside county of residence: 51.5%
- Means of transportation: drove alone (79.2%), carpooled (15%), walked (1.2%), public transportation (0%), worked from home (3.6%)

6 / 30
Larry D. Moore // Wikimedia Commons
#25. Fannin County
- Average commute time: 31.7 minutes
--- #282 longest among all counties nationwide
--- 19.2% longer than state average
--- 14.9% longer than national average
- Workers with 90+ minute commute: 6.49%
- Left for work from 12 a.m. to 6 a.m.: 22.8%
- Worked outside county of residence: 46.7%
- Means of transportation: drove alone (80.3%), carpooled (10.2%), walked (2.2%), public transportation (0%), worked from home (5.8%)
7 / 30
Canva
#24. Comal County
- Average commute time: 31.8 minutes
--- #277 longest among all counties nationwide
--- 19.5% longer than state average
--- 15.2% longer than national average
- Workers with 90+ minute commute: 3.91%
- Left for work from 12 a.m. to 6 a.m.: 12.8%
- Worked outside county of residence: 44.3%
- Means of transportation: drove alone (80.9%), carpooled (8.3%), walked (1.7%), public transportation (0.2%), worked from home (7.4%)

8 / 30
Michael Barera // Wikimedia Commons
#23. Parker County
- Average commute time: 31.8 minutes
--- #277 longest among all counties nationwide
--- 19.5% longer than state average
--- 15.2% longer than national average
- Workers with 90+ minute commute: 4.51%
- Left for work from 12 a.m. to 6 a.m.: 17.2%
- Worked outside county of residence: 51.1%
- Means of transportation: drove alone (83.6%), carpooled (8.4%), walked (1%), public transportation (0.3%), worked from home (5.7%)

9 / 30
Larry D. Moore // Wikimedia Commons
#22. Tyler County
- Average commute time: 31.9 minutes
--- #269 longest among all counties nationwide
--- 19.9% longer than state average
--- 15.6% longer than national average
- Workers with 90+ minute commute: 7.13%
- Left for work from 12 a.m. to 6 a.m.: 26.3%
- Worked outside county of residence: 34.7%
- Means of transportation: drove alone (81.2%), carpooled (7.5%), walked (1.5%), public transportation (0%), worked from home (4.4%)

10 / 30
Larry D. Moore // Wikimedia Commons
#21. Goliad County
- Average commute time: 32 minutes
--- #263 longest among all counties nationwide
--- 20.3% longer than state average
--- 15.9% longer than national average
- Workers with 90+ minute commute: 4.47%
- Left for work from 12 a.m. to 6 a.m.: 26.8%
- Worked outside county of residence: 59.9%
- Means of transportation: drove alone (78.1%), carpooled (11.3%), walked (3.1%), public transportation (0%), worked from home (7.5%)

11 / 30
Jim Evans // Wikimedia Commons
#20. Polk County
- Average commute time: 32 minutes
--- #263 longest among all counties nationwide
--- 20.3% longer than state average
--- 15.9% longer than national average
- Workers with 90+ minute commute: 9.90%
- Left for work from 12 a.m. to 6 a.m.: 22.1%
- Worked outside county of residence: 30.8%
- Means of transportation: drove alone (80.3%), carpooled (11.2%), walked (1%), public transportation (0.5%), worked from home (4.6%)

12 / 30
Larry D. Moore // Wikimedia Commons
#19. Henderson County
- Average commute time: 32.1 minutes
--- #257 longest among all counties nationwide
--- 20.7% longer than state average
--- 16.3% longer than national average
- Workers with 90+ minute commute: 7.25%
- Left for work from 12 a.m. to 6 a.m.: 18.1%
- Worked outside county of residence: 41.6%
- Means of transportation: drove alone (82.5%), carpooled (11.2%), walked (1.1%), public transportation (0.5%), worked from home (4.1%)

13 / 30
Larry D. Moore // Wikimedia Commons
#18. Montgomery County
- Average commute time: 32.2 minutes
--- #247 longest among all counties nationwide
--- 21.1% longer than state average
--- 16.7% longer than national average
- Workers with 90+ minute commute: 3.52%
- Left for work from 12 a.m. to 6 a.m.: 16.1%
- Worked outside county of residence: 39.7%
- Means of transportation: drove alone (81.1%), carpooled (9%), walked (0.8%), public transportation (0.9%), worked from home (6.9%)

14 / 30
Travis K. Witt // Wikimedia Commons
#17. Wise County
- Average commute time: 32.2 minutes
--- #247 longest among all counties nationwide
--- 21.1% longer than state average
--- 16.7% longer than national average
- Workers with 90+ minute commute: 4.94%
- Left for work from 12 a.m. to 6 a.m.: 22.7%
- Worked outside county of residence: 44.5%
- Means of transportation: drove alone (82.3%), carpooled (10.1%), walked (1.4%), public transportation (0.2%), worked from home (5.3%)

15 / 30
Reading Associate 17 // Wikimedia Commons
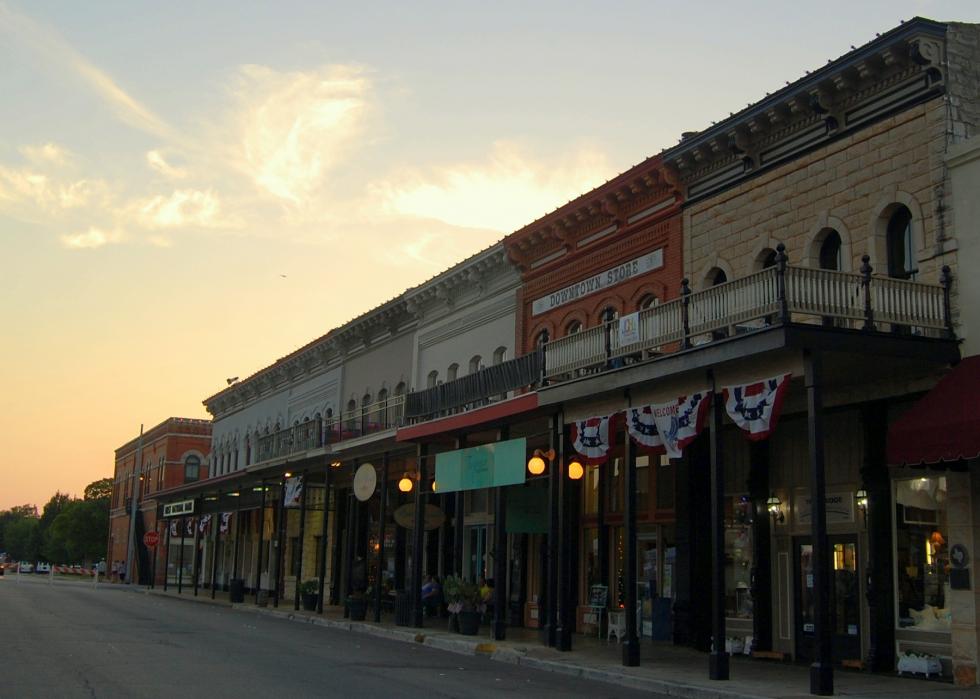
#16. Caldwell County
- Average commute time: 32.4 minutes
--- #233 longest among all counties nationwide
--- 21.8% longer than state average
--- 17.4% longer than national average
- Workers with 90+ minute commute: 4.30%
- Left for work from 12 a.m. to 6 a.m.: 22.4%
- Worked outside county of residence: 60.7%
- Means of transportation: drove alone (79.7%), carpooled (10.6%), walked (3.9%), public transportation (0%), worked from home (3.8%)

16 / 30
Renelibrary // Wikimedia Commons
#15. Kendall County
- Average commute time: 32.5 minutes
--- #228 longest among all counties nationwide
--- 22.2% longer than state average
--- 17.8% longer than national average
- Workers with 90+ minute commute: 5.49%
- Left for work from 12 a.m. to 6 a.m.: 12.2%
- Worked outside county of residence: 41.5%
- Means of transportation: drove alone (75.7%), carpooled (10%), walked (2.5%), public transportation (0.4%), worked from home (9.8%)

17 / 30
Michael Barera // Wikimedia Commons
#14. Delta County
- Average commute time: 33.1 minutes
--- #188 longest among all counties nationwide
--- 24.4% longer than state average
--- 19.9% longer than national average
- Workers with 90+ minute commute: 7.47%
- Left for work from 12 a.m. to 6 a.m.: 18.4%
- Worked outside county of residence: 66.8%
- Means of transportation: drove alone (89.1%), carpooled (5.4%), walked (0.5%), public transportation (0.3%), worked from home (3.6%)

18 / 30
Larry D. Moore // Wikimedia Commons
#13. Fort Bend County
- Average commute time: 33.5 minutes
--- #168 longest among all counties nationwide
--- 25.9% longer than state average
--- 21.4% longer than national average
- Workers with 90+ minute commute: 2.59%
- Left for work from 12 a.m. to 6 a.m.: 14.6%
- Worked outside county of residence: 60.5%
- Means of transportation: drove alone (81.5%), carpooled (9.4%), walked (0.5%), public transportation (1.6%), worked from home (6.1%)
19 / 30
Kairos14 // Wikimedia Commons
#12. Hood County
- Average commute time: 33.6 minutes
--- #160 longest among all counties nationwide
--- 26.3% longer than state average
--- 21.7% longer than national average
- Workers with 90+ minute commute: 5.66%
- Left for work from 12 a.m. to 6 a.m.: 15.4%
- Worked outside county of residence: 37.5%
- Means of transportation: drove alone (86.8%), carpooled (6.1%), walked (0.5%), public transportation (0.2%), worked from home (5.8%)

20 / 30
Larry D. Moore // Wikimedia Commons
#11. Bastrop County
- Average commute time: 34 minutes
--- #138 longest among all counties nationwide
--- 27.8% longer than state average
--- 23.2% longer than national average
- Workers with 90+ minute commute: 3.03%
- Left for work from 12 a.m. to 6 a.m.: 20.0%
- Worked outside county of residence: 56.5%
- Means of transportation: drove alone (80.5%), carpooled (11.5%), walked (1.6%), public transportation (0.1%), worked from home (4.4%)

21 / 30
Larry D. Moore // Wikimedia Commons
#10. Rockwall County
- Average commute time: 34.4 minutes
--- #122 longest among all counties nationwide
--- 29.3% longer than state average
--- 24.6% longer than national average
- Workers with 90+ minute commute: 2.33%
- Left for work from 12 a.m. to 6 a.m.: 13.7%
- Worked outside county of residence: 63.2%
- Means of transportation: drove alone (81%), carpooled (9.1%), walked (0.5%), public transportation (0.8%), worked from home (7.5%)

22 / 30
Michael Barera // Wikimedia Commons
#9. Rains County
- Average commute time: 35.7 minutes
--- #81 longest among all counties nationwide
--- 34.2% longer than state average
--- 29.3% longer than national average
- Workers with 90+ minute commute: 10.65%
- Left for work from 12 a.m. to 6 a.m.: 21.9%
- Worked outside county of residence: 59.2%
- Means of transportation: drove alone (78.5%), carpooled (15%), walked (0.2%), public transportation (0%), worked from home (4.7%)

23 / 30
Larry D. Moore // Wikimedia Commons
#8. Van Zandt County
- Average commute time: 35.8 minutes
--- #79 longest among all counties nationwide
--- 34.6% longer than state average
--- 29.7% longer than national average
- Workers with 90+ minute commute: 8.33%
- Left for work from 12 a.m. to 6 a.m.: 22.0%
- Worked outside county of residence: 50.8%
- Means of transportation: drove alone (80.9%), carpooled (11.5%), walked (1.9%), public transportation (0.1%), worked from home (4.8%)

24 / 30
Larry D. Moore // Wikimedia Commons
#7. Wilson County
- Average commute time: 35.9 minutes
--- #77 longest among all counties nationwide
--- 35.0% longer than state average
--- 30.1% longer than national average
- Workers with 90+ minute commute: 4.07%
- Left for work from 12 a.m. to 6 a.m.: 22.1%
- Worked outside county of residence: 59.2%
- Means of transportation: drove alone (80.1%), carpooled (10.7%), walked (0.8%), public transportation (0%), worked from home (7.6%)

25 / 30
Jpo tx113 // Wikimedia Commons
#6. Trinity County
- Average commute time: 36.5 minutes
--- #66 longest among all counties nationwide
--- 37.2% longer than state average
--- 32.2% longer than national average
- Workers with 90+ minute commute: 10.73%
- Left for work from 12 a.m. to 6 a.m.: 19.4%
- Worked outside county of residence: 55.4%
- Means of transportation: drove alone (81%), carpooled (9.2%), walked (2.5%), public transportation (0.8%), worked from home (5.9%)

26 / 30
Larry D. Moore // Wikimedia Commons
#5. Kaufman County
- Average commute time: 36.9 minutes
--- #60 longest among all counties nationwide
--- 38.7% longer than state average
--- 33.7% longer than national average
- Workers with 90+ minute commute: 5.43%
- Left for work from 12 a.m. to 6 a.m.: 21.9%
- Worked outside county of residence: 59.4%
- Means of transportation: drove alone (81.9%), carpooled (11.3%), walked (0.3%), public transportation (0.2%), worked from home (4.6%)

27 / 30
Larry D. Moore // Wikimedia Commons
#4. Liberty County
- Average commute time: 37 minutes
--- #58 longest among all counties nationwide
--- 39.1% longer than state average
--- 34.1% longer than national average
- Workers with 90+ minute commute: 6.42%
- Left for work from 12 a.m. to 6 a.m.: 29.4%
- Worked outside county of residence: 55.7%
- Means of transportation: drove alone (85.4%), carpooled (8.1%), walked (0.6%), public transportation (0.3%), worked from home (4.1%)

28 / 30
Larry D. Moore // Wikimedia Commons
#3. Bandera County
- Average commute time: 37.6 minutes
--- #50 longest among all counties nationwide
--- 41.4% longer than state average
--- 36.2% longer than national average
- Workers with 90+ minute commute: 8.09%
- Left for work from 12 a.m. to 6 a.m.: 16.5%
- Worked outside county of residence: 54.2%
- Means of transportation: drove alone (77.5%), carpooled (14.5%), walked (1.8%), public transportation (0.1%), worked from home (6%)

29 / 30
Larry D. Moore // Wikimedia Commons
#2. Newton County
- Average commute time: 38.7 minutes
--- #33 longest among all counties nationwide
--- 45.5% longer than state average
--- 40.2% longer than national average
- Workers with 90+ minute commute: 10.38%
- Left for work from 12 a.m. to 6 a.m.: 24.4%
- Worked outside county of residence: 58%
- Means of transportation: drove alone (85.2%), carpooled (7.7%), walked (0.4%), public transportation (0.3%), worked from home (3.7%)

30 / 30
Larry D. Moore // Wikimedia Commons
#1. San Jacinto County
- Average commute time: 42.9 minutes
--- #9 longest among all counties nationwide
--- 61.3% longer than state average
--- 55.4% longer than national average
- Workers with 90+ minute commute: 12.87%
- Left for work from 12 a.m. to 6 a.m.: 24.4%
- Worked outside county of residence: 70.9%
- Means of transportation: drove alone (80.2%), carpooled (11.4%), walked (1%), public transportation (0.5%), worked from home (4.2%)


