
Counties with the most born-and-bred residents in Illinois
Counties with the most born-and-bred residents in Illinois
In certain corners of the U.S., the only way you’ll ever be considered a local is if you were born there. Elsewhere, particularly in major metropolitan centers, the constant influx of new businesses, college students, and families can transform neighborhoods every few years and certainly decade over decade.
Americans change their addresses at higher rates than most other countries, but that “move, move, move” mentality may be shifting. In 2016, the U.S. Census Bureau reported that only 11.2% of respondents had moved within the last year. Additionally, 72% of Americans reported living in or close to the city they grew up in. To learn more about where people are staying put, Stacker compiled a list of counties with the most born-and-bred residents in Illinois using data from the U.S. Census Bureau. Counties are ranked by the highest percentage of residents that were born in the state as of 2019.
Keep reading to discover which counties in your state have the most born-and-bred residents.
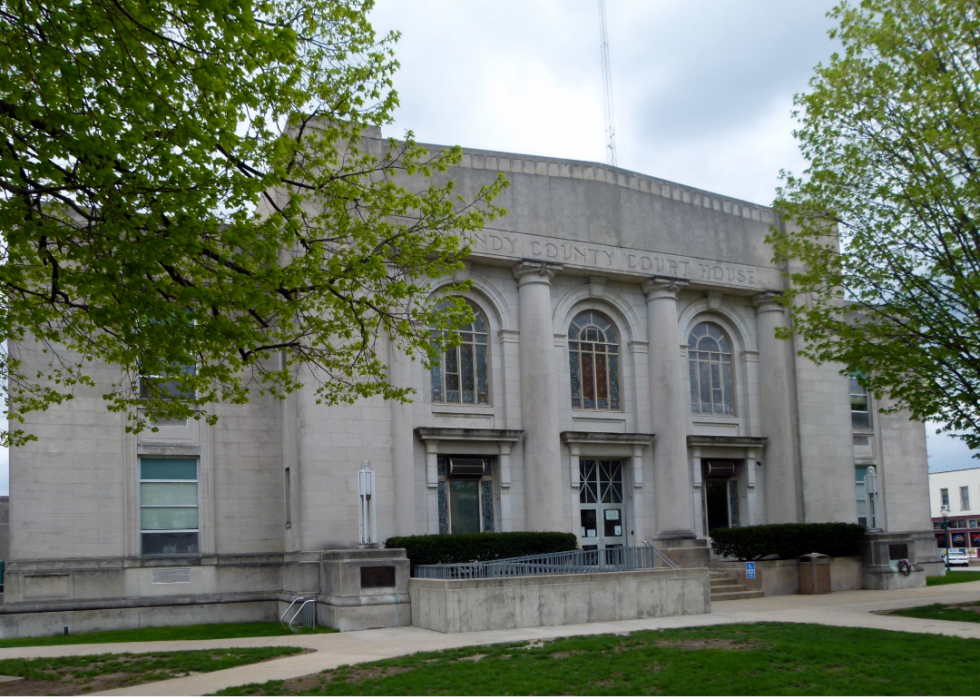
#30. Grundy County
- Born in Illinois: 41,679 (82.3% of population)
- Born in another U.S. state or territory: 6,822 (13.5% of population)
--- Midwest (6.2%), Northeast (1.7%), South (3.3%), West (2.0%)
- Born in another country: 1,967 (3.9% of population)
--- Africa (0.0%), Asia (0.8%), Europe (0.5%), Latin America (2.4%), North America (0.1%), Oceania (0.1%)

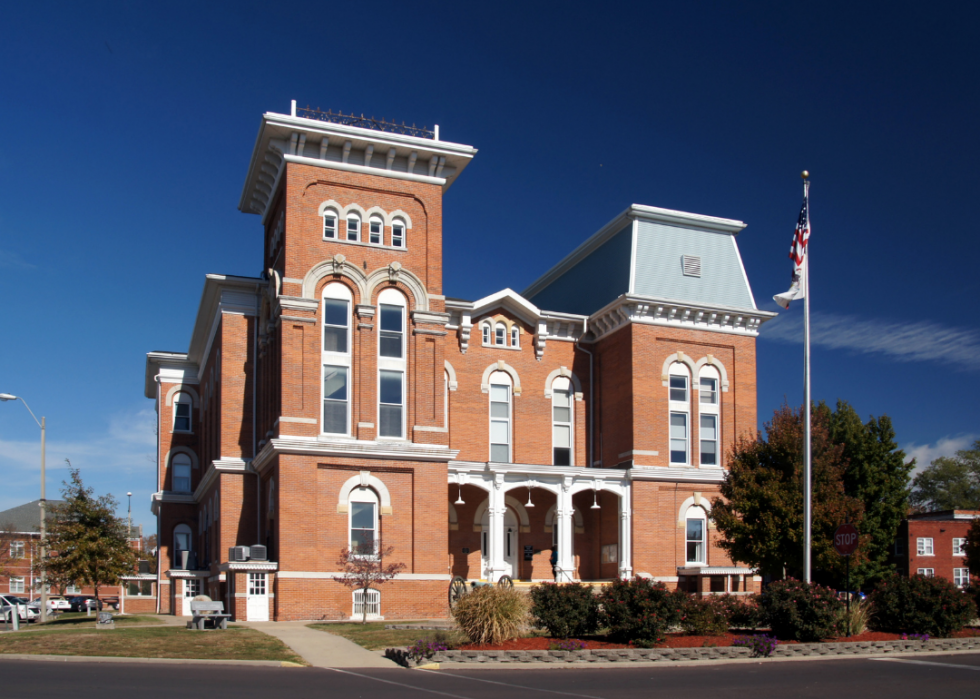
#29. Macoupin County
- Born in Illinois: 37,490 (82.5% of population)
- Born in another U.S. state or territory: 7,408 (16.3% of population)
--- Midwest (9.1%), Northeast (1.2%), South (3.8%), West (2.1%)
- Born in another country: 387 (0.9% of population)
--- Africa (0.0%), Asia (0.3%), Europe (0.2%), Latin America (0.2%), North America (0.1%), Oceania (0.0%)

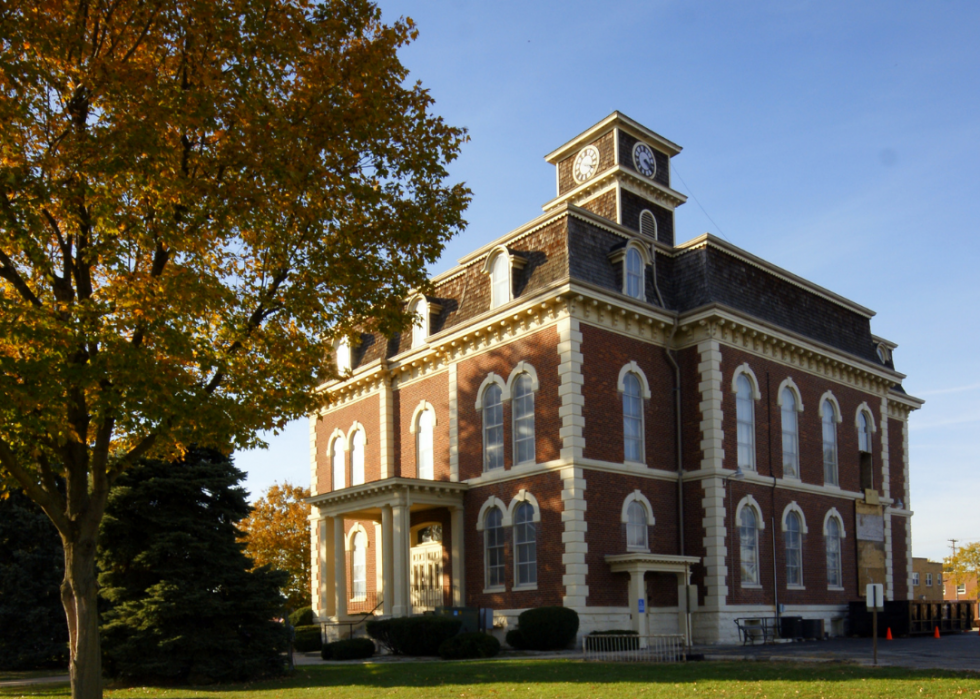
#28. Piatt County
- Born in Illinois: 13,563 (82.7% of population)
- Born in another U.S. state or territory: 2,563 (15.6% of population)
--- Midwest (7.3%), Northeast (1.5%), South (4.7%), West (2.0%)
- Born in another country: 211 (1.3% of population)
--- Africa (0.1%), Asia (0.3%), Europe (0.5%), Latin America (0.3%), North America (0.0%), Oceania (0.0%)

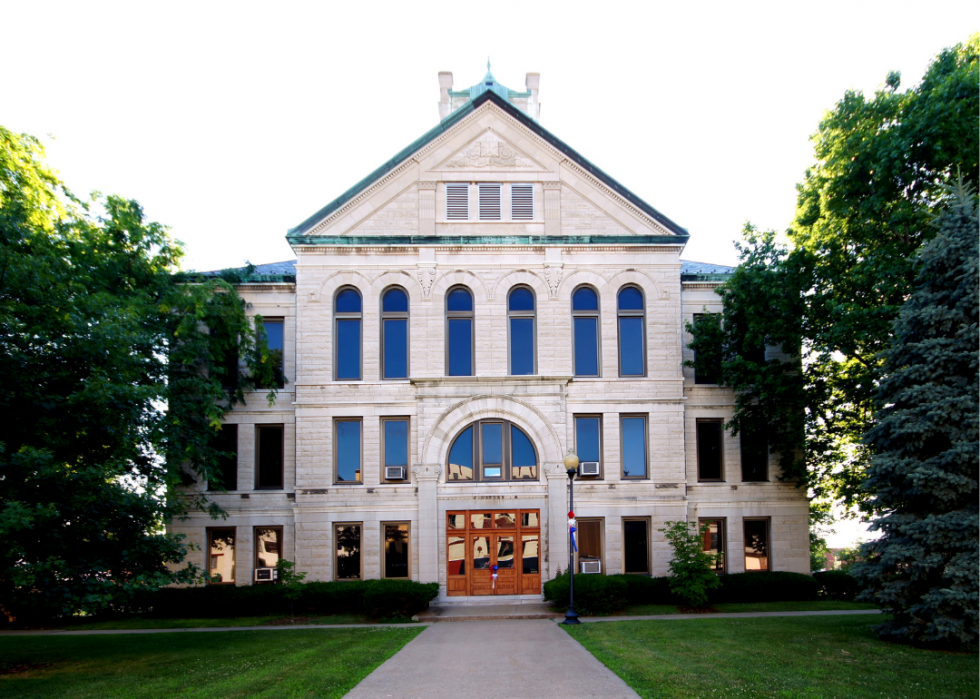
#27. Logan County
- Born in Illinois: 23,996 (82.7% of population)
- Born in another U.S. state or territory: 4,448 (15.3% of population)
--- Midwest (6.8%), Northeast (1.0%), South (5.4%), West (2.0%)
- Born in another country: 468 (1.6% of population)
--- Africa (0.0%), Asia (0.5%), Europe (0.4%), Latin America (0.7%), North America (0.0%), Oceania (0.0%)

#26. Marion County
- Born in Illinois: 31,289 (82.9% of population)
- Born in another U.S. state or territory: 5,931 (15.7% of population)
--- Midwest (8.0%), Northeast (1.1%), South (5.0%), West (1.5%)
- Born in another country: 440 (1.2% of population)
--- Africa (0.0%), Asia (0.6%), Europe (0.3%), Latin America (0.2%), North America (0.1%), Oceania (0.0%)

#25. Bureau County
- Born in Illinois: 27,464 (82.9% of population)
- Born in another U.S. state or territory: 4,248 (12.8% of population)
--- Midwest (6.5%), Northeast (1.3%), South (3.3%), West (1.6%)
- Born in another country: 1,245 (3.8% of population)
--- Africa (0.0%), Asia (0.7%), Europe (0.6%), Latin America (2.4%), North America (0.0%), Oceania (0.0%)
#24. Montgomery County
- Born in Illinois: 23,957 (83.1% of population)
- Born in another U.S. state or territory: 4,462 (15.5% of population)
--- Midwest (7.9%), Northeast (1.2%), South (4.3%), West (2.0%)
- Born in another country: 333 (1.2% of population)
--- Africa (0.0%), Asia (0.4%), Europe (0.5%), Latin America (0.2%), North America (0.0%), Oceania (0.0%)

#23. LaSalle County
- Born in Illinois: 91,480 (83.4% of population)
- Born in another U.S. state or territory: 13,905 (12.7% of population)
--- Midwest (5.5%), Northeast (1.3%), South (3.7%), West (2.1%)
- Born in another country: 4,042 (3.7% of population)
--- Africa (0.0%), Asia (0.6%), Europe (0.6%), Latin America (2.3%), North America (0.1%), Oceania (0.0%)

#22. Schuyler County
- Born in Illinois: 5,804 (83.5% of population)
- Born in another U.S. state or territory: 905 (13.0% of population)
--- Midwest (6.1%), Northeast (0.5%), South (3.7%), West (2.7%)
- Born in another country: 219 (3.1% of population)
--- Africa (2.9%), Asia (0.0%), Europe (0.0%), Latin America (0.0%), North America (0.2%), Oceania (0.0%)

#21. Brown County
- Born in Illinois: 5,585 (84.3% of population)
- Born in another U.S. state or territory: 826 (12.5% of population)
--- Midwest (5.7%), Northeast (0.5%), South (3.5%), West (2.7%)
- Born in another country: 217 (3.3% of population)
--- Africa (0.0%), Asia (0.0%), Europe (0.5%), Latin America (2.6%), North America (0.1%), Oceania (0.0%)

#20. Menard County
- Born in Illinois: 10,379 (84.3% of population)
- Born in another U.S. state or territory: 1,764 (14.3% of population)
--- Midwest (6.5%), Northeast (0.8%), South (4.1%), West (2.9%)
- Born in another country: 98 (0.8% of population)
--- Africa (0.0%), Asia (0.3%), Europe (0.3%), Latin America (0.3%), North America (0.0%), Oceania (0.0%)

#19. Morgan County
- Born in Illinois: 28,896 (84.4% of population)
- Born in another U.S. state or territory: 4,547 (13.3% of population)
--- Midwest (5.9%), Northeast (1.3%), South (4.3%), West (1.7%)
- Born in another country: 655 (1.9% of population)
--- Africa (0.5%), Asia (0.7%), Europe (0.2%), Latin America (0.5%), North America (0.0%), Oceania (0.0%)

#18. Perry County
- Born in Illinois: 17,934 (84.4% of population)
- Born in another U.S. state or territory: 2,980 (14.0% of population)
--- Midwest (6.7%), Northeast (0.6%), South (4.3%), West (2.4%)
- Born in another country: 266 (1.3% of population)
--- Africa (0.0%), Asia (0.5%), Europe (0.0%), Latin America (0.7%), North America (0.0%), Oceania (0.0%)

#17. Marshall County
- Born in Illinois: 9,859 (84.4% of population)
- Born in another U.S. state or territory: 1,584 (13.6% of population)
--- Midwest (6.2%), Northeast (0.9%), South (4.0%), West (2.4%)
- Born in another country: 196 (1.7% of population)
--- Africa (0.0%), Asia (0.4%), Europe (0.4%), Latin America (0.8%), North America (0.0%), Oceania (0.0%)

#16. Livingston County
- Born in Illinois: 30,452 (84.5% of population)
- Born in another U.S. state or territory: 4,719 (13.1% of population)
--- Midwest (5.3%), Northeast (1.3%), South (4.4%), West (2.0%)
- Born in another country: 768 (2.1% of population)
--- Africa (0.2%), Asia (0.5%), Europe (0.2%), Latin America (1.2%), North America (0.0%), Oceania (0.0%)

#15. Fayette County
- Born in Illinois: 18,305 (84.9% of population)
- Born in another U.S. state or territory: 2,913 (13.5% of population)
--- Midwest (5.8%), Northeast (1.2%), South (4.3%), West (2.2%)
- Born in another country: 277 (1.3% of population)
--- Africa (0.0%), Asia (0.4%), Europe (0.2%), Latin America (0.5%), North America (0.1%), Oceania (0.1%)

#14. De Witt County
- Born in Illinois: 13,539 (85.0% of population)
- Born in another U.S. state or territory: 2,097 (13.2% of population)
--- Midwest (6.6%), Northeast (1.0%), South (3.9%), West (1.6%)
- Born in another country: 235 (1.5% of population)
--- Africa (0.0%), Asia (0.2%), Europe (0.5%), Latin America (0.8%), North America (0.0%), Oceania (0.0%)
#13. Effingham County
- Born in Illinois: 29,279 (85.8% of population)
- Born in another U.S. state or territory: 3,964 (11.6% of population)
--- Midwest (6.1%), Northeast (0.6%), South (2.8%), West (2.0%)
- Born in another country: 762 (2.2% of population)
--- Africa (0.0%), Asia (0.5%), Europe (0.5%), Latin America (1.0%), North America (0.1%), Oceania (0.0%)

#12. Stark County
- Born in Illinois: 4,677 (85.9% of population)
- Born in another U.S. state or territory: 688 (12.6% of population)
--- Midwest (5.8%), Northeast (0.3%), South (3.4%), West (3.1%)
- Born in another country: 63 (1.2% of population)
--- Africa (0.0%), Asia (0.5%), Europe (0.3%), Latin America (0.3%), North America (0.0%), Oceania (0.0%)

#11. Fulton County
- Born in Illinois: 30,186 (86.0% of population)
- Born in another U.S. state or territory: 4,373 (12.5% of population)
--- Midwest (4.9%), Northeast (0.9%), South (3.9%), West (2.5%)
- Born in another country: 434 (1.2% of population)
--- Africa (0.0%), Asia (0.1%), Europe (0.3%), Latin America (0.9%), North America (0.0%), Oceania (0.0%)

#10. Putnam County
- Born in Illinois: 4,937 (86.3% of population)
- Born in another U.S. state or territory: 632 (11.0% of population)
--- Midwest (6.0%), Northeast (0.7%), South (2.8%), West (1.6%)
- Born in another country: 150 (2.6% of population)
--- Africa (0.0%), Asia (0.6%), Europe (0.9%), Latin America (1.0%), North America (0.0%), Oceania (0.0%)

#9. Moultrie County
- Born in Illinois: 12,657 (86.4% of population)
- Born in another U.S. state or territory: 1,778 (12.1% of population)
--- Midwest (5.6%), Northeast (0.5%), South (3.8%), West (2.2%)
- Born in another country: 144 (1.0% of population)
--- Africa (0.0%), Asia (0.2%), Europe (0.2%), Latin America (0.6%), North America (0.0%), Oceania (0.0%)

#8. Clay County
- Born in Illinois: 11,489 (86.5% of population)
- Born in another U.S. state or territory: 1,692 (12.7% of population)
--- Midwest (5.5%), Northeast (0.8%), South (4.2%), West (2.2%)
- Born in another country: 60 (0.5% of population)
--- Africa (0.0%), Asia (0.2%), Europe (0.2%), Latin America (0.0%), North America (0.0%), Oceania (0.0%)

#7. Mason County
- Born in Illinois: 11,785 (86.5% of population)
- Born in another U.S. state or territory: 1,690 (12.4% of population)
--- Midwest (5.9%), Northeast (0.7%), South (4.1%), West (1.6%)
- Born in another country: 113 (0.8% of population)
--- Africa (0.0%), Asia (0.3%), Europe (0.2%), Latin America (0.3%), North America (0.0%), Oceania (0.0%)
#6. Christian County
- Born in Illinois: 28,585 (86.8% of population)
- Born in another U.S. state or territory: 3,779 (11.5% of population)
--- Midwest (4.8%), Northeast (0.9%), South (3.7%), West (2.0%)
- Born in another country: 391 (1.2% of population)
--- Africa (0.0%), Asia (0.3%), Europe (0.3%), Latin America (0.5%), North America (0.0%), Oceania (0.0%)

#5. Cumberland County
- Born in Illinois: 9,414 (86.9% of population)
- Born in another U.S. state or territory: 1,303 (12.0% of population)
--- Midwest (7.3%), Northeast (0.7%), South (2.8%), West (1.3%)
- Born in another country: 109 (1.0% of population)
--- Africa (0.0%), Asia (0.5%), Europe (0.1%), Latin America (0.4%), North America (0.0%), Oceania (0.0%)

#4. Greene County
- Born in Illinois: 11,492 (87.5% of population)
- Born in another U.S. state or territory: 1,508 (11.5% of population)
--- Midwest (5.6%), Northeast (0.3%), South (3.3%), West (2.3%)
- Born in another country: 65 (0.5% of population)
--- Africa (0.0%), Asia (0.1%), Europe (0.3%), Latin America (0.0%), North America (0.0%), Oceania (0.0%)
#3. Jasper County
- Born in Illinois: 8,432 (87.9% of population)
- Born in another U.S. state or territory: 1,054 (11.0% of population)
--- Midwest (5.9%), Northeast (0.8%), South (3.0%), West (1.3%)
- Born in another country: 90 (0.9% of population)
--- Africa (0.0%), Asia (0.0%), Europe (0.3%), Latin America (0.6%), North America (0.0%), Oceania (0.0%)

#2. Scott County
- Born in Illinois: 4,447 (88.9% of population)
- Born in another U.S. state or territory: 493 (9.9% of population)
--- Midwest (6.3%), Northeast (0.5%), South (1.5%), West (1.4%)
- Born in another country: 46 (0.9% of population)
--- Africa (0.0%), Asia (0.2%), Europe (0.2%), Latin America (0.2%), North America (0.0%), Oceania (0.3%)

#1. Shelby County
- Born in Illinois: 19,490 (89.7% of population)
- Born in another U.S. state or territory: 2,089 (9.6% of population)
--- Midwest (4.3%), Northeast (0.8%), South (3.6%), West (0.8%)
- Born in another country: 103 (0.5% of population)
--- Africa (0.0%), Asia (0.2%), Europe (0.2%), Latin America (0.0%), North America (0.0%), Oceania (0.0%)


