
Counties with the most born-and-bred residents in New Jersey
Counties with the most born-and-bred residents in New Jersey
In certain corners of the U.S., the only way you’ll ever be considered a local is if you were born there. Elsewhere, particularly in major metropolitan centers, the constant influx of new businesses, college students, and families can transform neighborhoods every few years and certainly decade over decade.
Americans change their addresses at higher rates than most other countries, but that “move, move, move” mentality may be shifting. In 2016, the U.S. Census Bureau reported that only 11.2% of respondents had moved within the last year. Additionally, 72% of Americans reported living in or close to the city they grew up in. To learn more about where people are staying put, Stacker compiled a list of counties with the most born-and-bred residents in New Jersey using data from the U.S. Census Bureau. Counties are ranked by the highest percentage of residents that were born in the state as of 2019.
Keep reading to discover which counties in your state have the most born-and-bred residents.

#21. Hudson County
- Born in New Jersey: 239,270 (35.7% of population)
- Born in another U.S. state or territory: 133,842 (20.0% of population)
--- Midwest (1.3%), Northeast (12.1%), South (2.8%), West (1.1%)
- Born in another country: 289,280 (43.2% of population)
--- Africa (2.7%), Asia (12.3%), Europe (3.5%), Latin America (24.4%), North America (0.2%), Oceania (0.1%)

#20. Bergen County
- Born in New Jersey: 399,194 (42.9% of population)
- Born in another U.S. state or territory: 235,264 (25.3% of population)
--- Midwest (1.3%), Northeast (20.2%), South (2.2%), West (1.0%)
- Born in another country: 286,639 (30.8% of population)
--- Africa (0.9%), Asia (13.3%), Europe (6.2%), Latin America (10.1%), North America (0.2%), Oceania (0.0%)
#19. Middlesex County
- Born in New Jersey: 384,636 (46.6% of population)
- Born in another U.S. state or territory: 163,519 (19.8% of population)
--- Midwest (1.2%), Northeast (13.8%), South (2.5%), West (0.8%)
- Born in another country: 271,251 (32.8% of population)
--- Africa (2.0%), Asia (17.5%), Europe (3.4%), Latin America (9.7%), North America (0.2%), Oceania (0.0%)
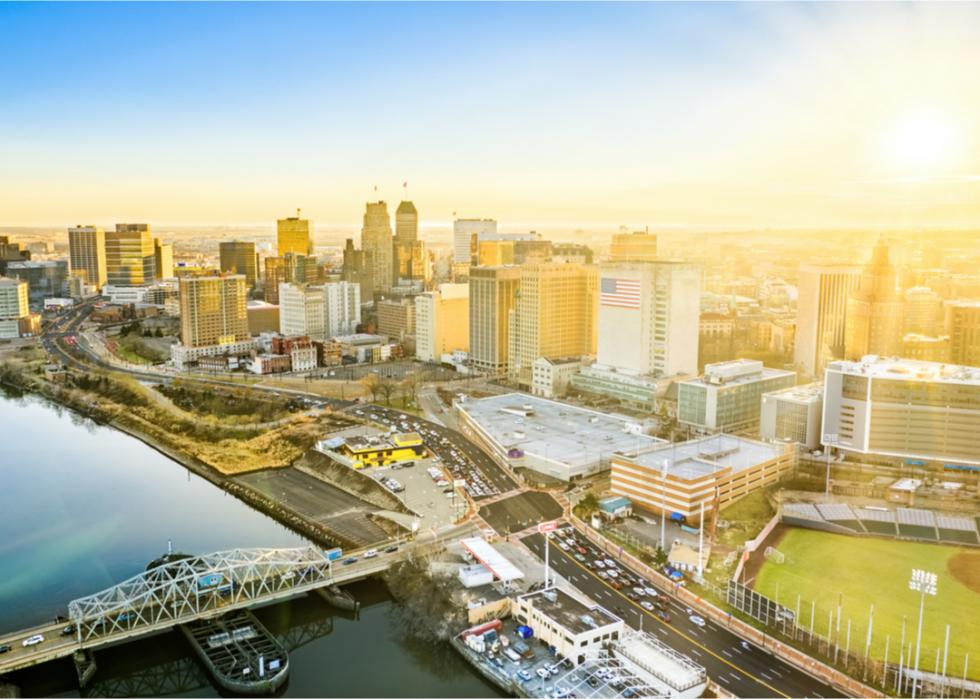
#18. Essex County
- Born in New Jersey: 397,517 (50.0% of population)
- Born in another U.S. state or territory: 173,450 (21.8% of population)
--- Midwest (1.4%), Northeast (12.3%), South (5.1%), West (0.9%)
- Born in another country: 216,152 (27.2% of population)
--- Africa (3.4%), Asia (3.9%), Europe (3.1%), Latin America (16.6%), North America (0.2%), Oceania (0.0%)

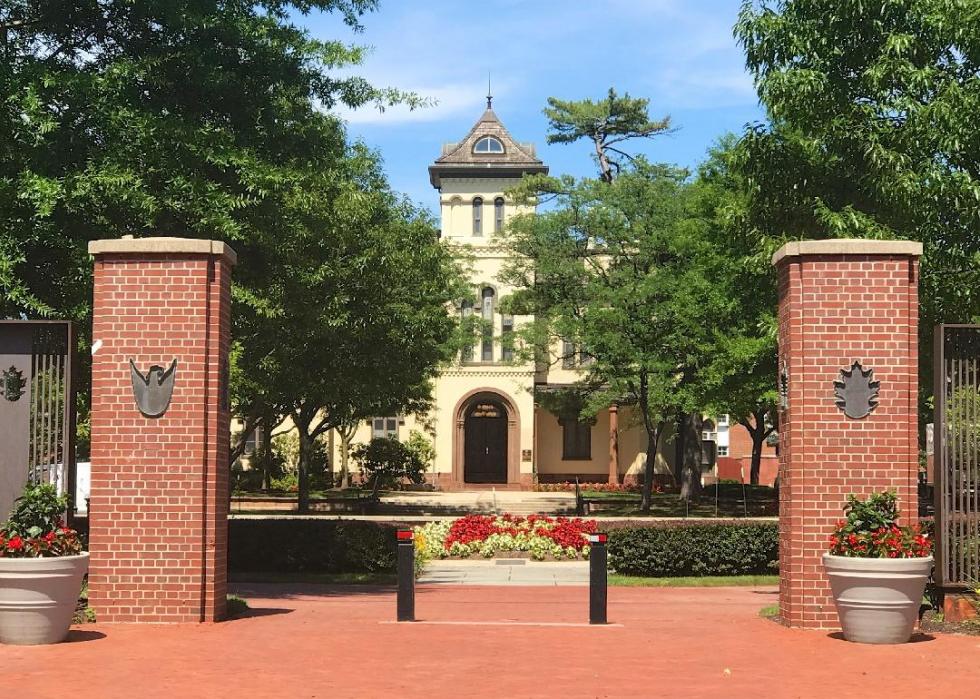
#17. Union County
- Born in New Jersey: 278,006 (50.2% of population)
- Born in another U.S. state or territory: 102,314 (18.5% of population)
--- Midwest (1.2%), Northeast (11.1%), South (3.8%), West (0.7%)
- Born in another country: 166,759 (30.1% of population)
--- Africa (1.3%), Asia (3.7%), Europe (4.7%), Latin America (20.1%), North America (0.2%), Oceania (0.0%)
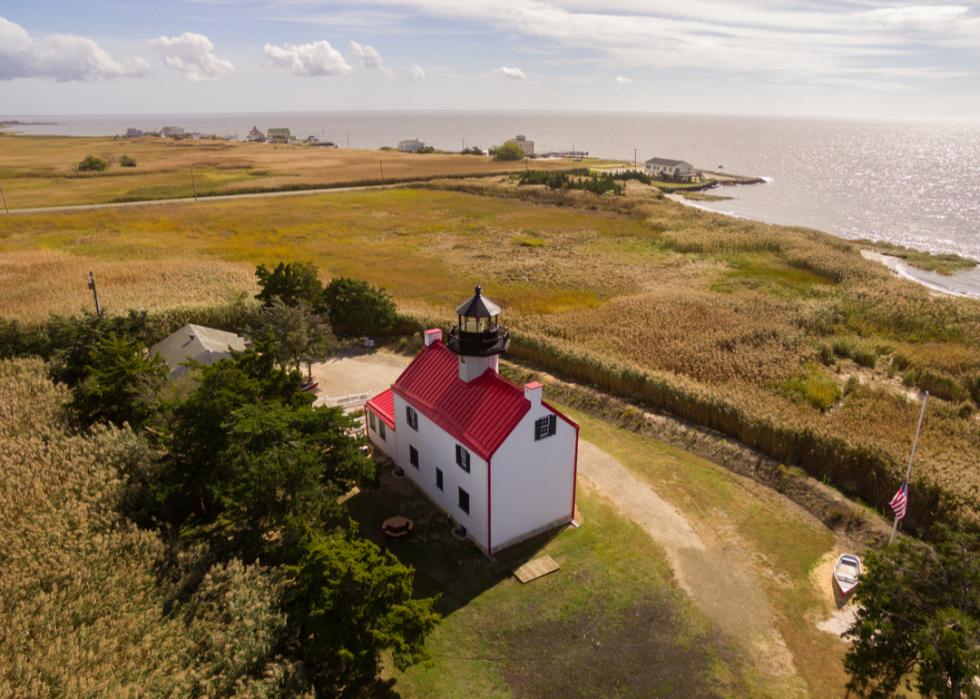
#16. Cape May County
- Born in New Jersey: 46,944 (50.4% of population)
- Born in another U.S. state or territory: 41,264 (44.3% of population)
--- Midwest (1.8%), Northeast (35.3%), South (4.8%), West (1.3%)
- Born in another country: 4,398 (4.7% of population)
--- Africa (0.3%), Asia (0.9%), Europe (1.2%), Latin America (2.2%), North America (0.2%), Oceania (0.0%)

#15. Mercer County
- Born in New Jersey: 189,085 (51.4% of population)
- Born in another U.S. state or territory: 91,024 (24.7% of population)
--- Midwest (2.5%), Northeast (13.6%), South (5.1%), West (1.8%)
- Born in another country: 84,262 (22.9% of population)
--- Africa (1.8%), Asia (8.1%), Europe (3.3%), Latin America (9.4%), North America (0.3%), Oceania (0.1%)

#14. Somerset County
- Born in New Jersey: 170,768 (51.8% of population)
- Born in another U.S. state or territory: 73,434 (22.3% of population)
--- Midwest (2.3%), Northeast (15.0%), South (3.2%), West (1.2%)
- Born in another country: 82,743 (25.1% of population)
--- Africa (1.1%), Asia (12.3%), Europe (4.0%), Latin America (7.4%), North America (0.2%), Oceania (0.1%)

#13. Burlington County
- Born in New Jersey: 238,029 (53.4% of population)
- Born in another U.S. state or territory: 158,668 (35.6% of population)
--- Midwest (2.6%), Northeast (23.9%), South (6.2%), West (2.1%)
- Born in another country: 43,414 (9.7% of population)
--- Africa (1.1%), Asia (4.0%), Europe (1.7%), Latin America (2.7%), North America (0.2%), Oceania (0.0%)

#12. Passaic County
- Born in New Jersey: 269,340 (53.5% of population)
- Born in another U.S. state or territory: 74,176 (14.7% of population)
--- Midwest (0.8%), Northeast (8.7%), South (2.1%), West (0.6%)
- Born in another country: 154,270 (30.6% of population)
--- Africa (0.7%), Asia (5.8%), Europe (3.5%), Latin America (20.6%), North America (0.1%), Oceania (0.0%)
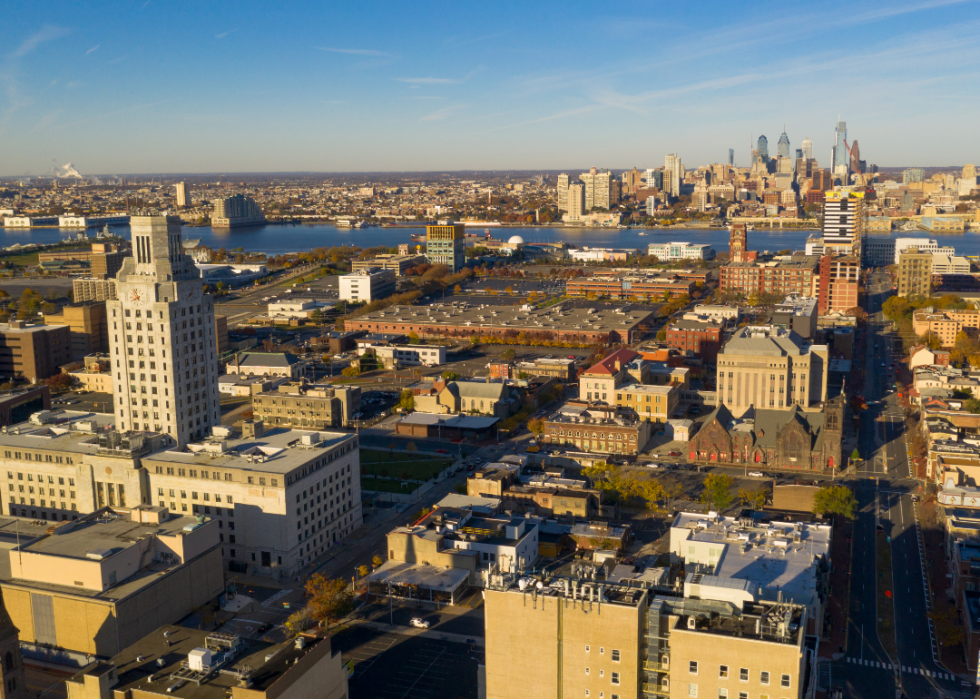
#11. Camden County
- Born in New Jersey: 276,271 (54.5% of population)
- Born in another U.S. state or territory: 170,599 (33.7% of population)
--- Midwest (1.5%), Northeast (23.9%), South (4.5%), West (1.1%)
- Born in another country: 55,725 (11.0% of population)
--- Africa (0.6%), Asia (4.3%), Europe (1.3%), Latin America (4.6%), North America (0.1%), Oceania (0.0%)

#10. Monmouth County
- Born in New Jersey: 347,820 (56.0% of population)
- Born in another U.S. state or territory: 184,905 (29.7% of population)
--- Midwest (1.6%), Northeast (23.5%), South (3.1%), West (1.0%)
- Born in another country: 84,845 (13.6% of population)
--- Africa (0.7%), Asia (4.2%), Europe (3.2%), Latin America (5.4%), North America (0.1%), Oceania (0.0%)

#9. Morris County
- Born in New Jersey: 281,408 (57.0% of population)
- Born in another U.S. state or territory: 112,287 (22.8% of population)
--- Midwest (2.4%), Northeast (15.3%), South (3.1%), West (1.3%)
- Born in another country: 95,311 (19.3% of population)
--- Africa (0.6%), Asia (7.9%), Europe (3.6%), Latin America (6.8%), North America (0.4%), Oceania (0.0%)

#8. Atlantic County
- Born in New Jersey: 153,819 (57.8% of population)
- Born in another U.S. state or territory: 66,996 (25.2% of population)
--- Midwest (1.5%), Northeast (16.1%), South (4.1%), West (1.1%)
- Born in another country: 43,803 (16.5% of population)
--- Africa (0.4%), Asia (6.0%), Europe (1.9%), Latin America (8.1%), North America (0.1%), Oceania (0.0%)

#7. Gloucester County
- Born in New Jersey: 170,284 (58.5% of population)
- Born in another U.S. state or territory: 103,362 (35.5% of population)
--- Midwest (1.6%), Northeast (28.0%), South (4.1%), West (1.1%)
- Born in another country: 16,035 (5.5% of population)
--- Africa (0.4%), Asia (2.3%), Europe (1.1%), Latin America (1.5%), North America (0.2%), Oceania (0.0%)

#6. Hunterdon County
- Born in New Jersey: 77,745 (62.3% of population)
- Born in another U.S. state or territory: 33,984 (27.2% of population)
--- Midwest (3.2%), Northeast (18.3%), South (3.7%), West (1.8%)
- Born in another country: 12,089 (9.7% of population)
--- Africa (0.3%), Asia (3.2%), Europe (3.2%), Latin America (2.6%), North America (0.2%), Oceania (0.1%)

#5. Warren County
- Born in New Jersey: 66,392 (62.7% of population)
- Born in another U.S. state or territory: 28,410 (26.8% of population)
--- Midwest (2.2%), Northeast (19.4%), South (3.3%), West (1.2%)
- Born in another country: 10,334 (9.8% of population)
--- Africa (0.6%), Asia (2.4%), Europe (2.8%), Latin America (3.9%), North America (0.1%), Oceania (0.0%)

#4. Salem County
- Born in New Jersey: 40,324 (64.0% of population)
- Born in another U.S. state or territory: 20,012 (31.8% of population)
--- Midwest (1.7%), Northeast (13.6%), South (13.3%), West (1.3%)
- Born in another country: 2,371 (3.8% of population)
--- Africa (0.2%), Asia (0.9%), Europe (0.7%), Latin America (1.8%), North America (0.1%), Oceania (0.0%)

#3. Cumberland County
- Born in New Jersey: 101,320 (66.7% of population)
- Born in another U.S. state or territory: 34,335 (22.6% of population)
--- Midwest (1.2%), Northeast (9.3%), South (5.4%), West (1.1%)
- Born in another country: 15,161 (10.0% of population)
--- Africa (0.3%), Asia (0.8%), Europe (1.1%), Latin America (7.7%), North America (0.1%), Oceania (0.0%)

#2. Ocean County
- Born in New Jersey: 400,805 (67.2% of population)
- Born in another U.S. state or territory: 143,313 (24.0% of population)
--- Midwest (1.4%), Northeast (18.6%), South (2.4%), West (1.0%)
- Born in another country: 46,382 (7.8% of population)
--- Africa (0.3%), Asia (1.6%), Europe (2.4%), Latin America (3.2%), North America (0.2%), Oceania (0.0%)

#1. Sussex County
- Born in New Jersey: 99,224 (70.1% of population)
- Born in another U.S. state or territory: 30,767 (21.7% of population)
--- Midwest (2.2%), Northeast (14.9%), South (3.0%), West (1.1%)
- Born in another country: 10,803 (7.6% of population)
--- Africa (0.2%), Asia (1.8%), Europe (2.7%), Latin America (2.7%), North America (0.2%), Oceania (0.1%)


