
Counties with the most born-and-bred residents in South Carolina
Counties with the most born-and-bred residents in South Carolina
In certain corners of the U.S., the only way you’ll ever be considered a local is if you were born there. Elsewhere, particularly in major metropolitan centers, the constant influx of new businesses, college students, and families can transform neighborhoods every few years and certainly decade over decade.
Americans change their addresses at higher rates than most other countries, but that “move, move, move” mentality may be shifting. In 2016, the U.S. Census Bureau reported that only 11.2% of respondents had moved within the last year. Additionally, 72% of Americans reported living in or close to the city they grew up in. To learn more about where people are staying put, Stacker compiled a list of counties with the most born-and-bred residents in South Carolina using data from the U.S. Census Bureau. Counties are ranked by the highest percentage of residents that were born in the state as of 2019.
Keep reading to discover which counties in your state have the most born-and-bred residents.

#30. Pickens County
- Born in South Carolina: 75,927 (61.2% of population)
- Born in another U.S. state or territory: 42,955 (34.6% of population)
--- Midwest (6.3%), Northeast (8.5%), South (17.6%), West (2.3%)
- Born in another country: 4,445 (3.6% of population)
--- Africa (0.2%), Asia (1.6%), Europe (0.5%), Latin America (1.2%), North America (0.1%), Oceania (0.0%)
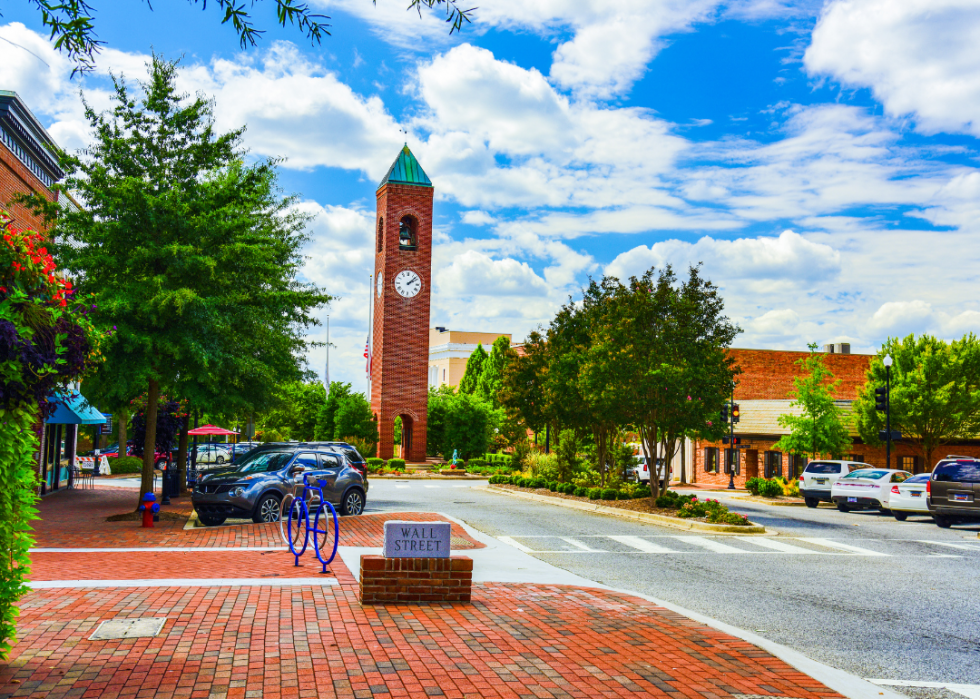
#29. Spartanburg County
- Born in South Carolina: 194,870 (63.3% of population)
- Born in another U.S. state or territory: 91,467 (29.7% of population)
--- Midwest (5.5%), Northeast (6.8%), South (14.9%), West (2.3%)
- Born in another country: 19,419 (6.3% of population)
--- Africa (0.1%), Asia (1.5%), Europe (1.4%), Latin America (3.2%), North America (0.1%), Oceania (0.0%)

#28. Chesterfield County
- Born in South Carolina: 29,707 (64.6% of population)
- Born in another U.S. state or territory: 14,861 (32.3% of population)
--- Midwest (2.2%), Northeast (3.6%), South (25.2%), West (1.0%)
- Born in another country: 1,244 (2.7% of population)
--- Africa (0.0%), Asia (0.5%), Europe (0.3%), Latin America (1.8%), North America (0.2%), Oceania (0.0%)

#27. Kershaw County
- Born in South Carolina: 42,749 (65.7% of population)
- Born in another U.S. state or territory: 20,240 (31.1% of population)
--- Midwest (5.6%), Northeast (7.3%), South (15.5%), West (2.4%)
- Born in another country: 1,553 (2.4% of population)
--- Africa (0.0%), Asia (0.2%), Europe (0.5%), Latin America (1.6%), North America (0.1%), Oceania (0.0%)

#26. Sumter County
- Born in South Carolina: 70,721 (66.2% of population)
- Born in another U.S. state or territory: 31,445 (29.5% of population)
--- Midwest (4.5%), Northeast (7.4%), South (13.6%), West (3.8%)
- Born in another country: 3,140 (2.9% of population)
--- Africa (0.0%), Asia (1.2%), Europe (0.4%), Latin America (1.3%), North America (0.1%), Oceania (0.0%)

#25. Anderson County
- Born in South Carolina: 131,907 (66.6% of population)
- Born in another U.S. state or territory: 58,922 (29.7% of population)
--- Midwest (5.5%), Northeast (6.7%), South (15.0%), West (2.5%)
- Born in another country: 6,079 (3.1% of population)
--- Africa (0.1%), Asia (0.7%), Europe (0.5%), Latin America (1.6%), North America (0.2%), Oceania (0.0%)

#24. Barnwell County
- Born in South Carolina: 14,438 (67.6% of population)
- Born in another U.S. state or territory: 6,554 (30.7% of population)
--- Midwest (3.2%), Northeast (4.1%), South (21.7%), West (1.5%)
- Born in another country: 332 (1.6% of population)
--- Africa (0.0%), Asia (0.1%), Europe (0.2%), Latin America (1.2%), North America (0.1%), Oceania (0.0%)

#23. Cherokee County
- Born in South Carolina: 39,940 (70.2% of population)
- Born in another U.S. state or territory: 15,192 (26.7% of population)
--- Midwest (3.1%), Northeast (4.9%), South (17.4%), West (1.3%)
- Born in another country: 1,367 (2.4% of population)
--- Africa (0.1%), Asia (0.6%), Europe (0.2%), Latin America (1.5%), North America (0.0%), Oceania (0.0%)

#22. Greenwood County
- Born in South Carolina: 50,499 (71.7% of population)
- Born in another U.S. state or territory: 16,815 (23.9% of population)
--- Midwest (3.9%), Northeast (5.3%), South (12.5%), West (2.0%)
- Born in another country: 2,944 (4.2% of population)
--- Africa (0.1%), Asia (0.9%), Europe (0.4%), Latin America (2.8%), North America (0.0%), Oceania (0.0%)

#21. Saluda County
- Born in South Carolina: 14,619 (72.0% of population)
- Born in another U.S. state or territory: 3,804 (18.7% of population)
--- Midwest (1.6%), Northeast (3.1%), South (11.8%), West (2.1%)
- Born in another country: 1,727 (8.5% of population)
--- Africa (0.0%), Asia (0.1%), Europe (0.5%), Latin America (7.9%), North America (0.0%), Oceania (0.0%)

#20. Clarendon County
- Born in South Carolina: 24,870 (73.2% of population)
- Born in another U.S. state or territory: 8,105 (23.9% of population)
--- Midwest (3.9%), Northeast (9.2%), South (9.8%), West (1.0%)
- Born in another country: 731 (2.2% of population)
--- Africa (0.0%), Asia (0.3%), Europe (0.4%), Latin America (1.4%), North America (0.1%), Oceania (0.0%)

#19. Laurens County
- Born in South Carolina: 48,963 (73.2% of population)
- Born in another U.S. state or territory: 15,624 (23.4% of population)
--- Midwest (4.3%), Northeast (5.2%), South (11.4%), West (2.0%)
- Born in another country: 1,833 (2.7% of population)
--- Africa (0.0%), Asia (0.4%), Europe (0.3%), Latin America (1.9%), North America (0.1%), Oceania (0.0%)

#18. Marlboro County
- Born in South Carolina: 19,838 (74.2% of population)
- Born in another U.S. state or territory: 6,251 (23.4% of population)
--- Midwest (1.4%), Northeast (3.1%), South (17.9%), West (0.8%)
- Born in another country: 581 (2.2% of population)
--- Africa (0.1%), Asia (0.3%), Europe (0.3%), Latin America (1.5%), North America (0.0%), Oceania (0.0%)

#17. Florence County
- Born in South Carolina: 103,234 (74.6% of population)
- Born in another U.S. state or territory: 30,841 (22.3% of population)
--- Midwest (2.9%), Northeast (6.9%), South (11.2%), West (1.2%)
- Born in another country: 3,868 (2.8% of population)
--- Africa (0.1%), Asia (1.1%), Europe (0.5%), Latin America (0.9%), North America (0.0%), Oceania (0.1%)

#16. Bamberg County
- Born in South Carolina: 10,781 (75.0% of population)
- Born in another U.S. state or territory: 3,069 (21.3% of population)
--- Midwest (1.9%), Northeast (7.5%), South (10.0%), West (1.5%)
- Born in another country: 517 (3.6% of population)
--- Africa (2.7%), Asia (0.3%), Europe (0.3%), Latin America (0.3%), North America (0.0%), Oceania (0.0%)
#15. Chester County
- Born in South Carolina: 24,400 (75.5% of population)
- Born in another U.S. state or territory: 7,412 (22.9% of population)
--- Midwest (3.0%), Northeast (3.6%), South (15.3%), West (1.0%)
- Born in another country: 422 (1.3% of population)
--- Africa (0.0%), Asia (0.1%), Europe (0.3%), Latin America (0.7%), North America (0.2%), Oceania (0.0%)

#14. Calhoun County
- Born in South Carolina: 11,123 (75.9% of population)
- Born in another U.S. state or territory: 3,209 (21.9% of population)
--- Midwest (2.5%), Northeast (6.8%), South (10.9%), West (1.6%)
- Born in another country: 273 (1.9% of population)
--- Africa (0.0%), Asia (0.1%), Europe (0.2%), Latin America (1.5%), North America (0.0%), Oceania (0.0%)

#13. Newberry County
- Born in South Carolina: 29,012 (76.0% of population)
- Born in another U.S. state or territory: 7,108 (18.6% of population)
--- Midwest (2.2%), Northeast (4.0%), South (10.8%), West (1.3%)
- Born in another country: 1,879 (4.9% of population)
--- Africa (0.3%), Asia (0.1%), Europe (0.4%), Latin America (4.0%), North America (0.1%), Oceania (0.0%)

#12. Abbeville County
- Born in South Carolina: 18,819 (76.4% of population)
- Born in another U.S. state or territory: 5,281 (21.4% of population)
--- Midwest (3.1%), Northeast (5.3%), South (11.2%), West (1.8%)
- Born in another country: 432 (1.8% of population)
--- Africa (0.0%), Asia (0.1%), Europe (1.1%), Latin America (0.4%), North America (0.1%), Oceania (0.0%)

#11. Colleton County
- Born in South Carolina: 29,334 (78.0% of population)
- Born in another U.S. state or territory: 7,200 (19.2% of population)
--- Midwest (2.4%), Northeast (6.7%), South (8.3%), West (1.7%)
- Born in another country: 874 (2.3% of population)
--- Africa (0.0%), Asia (0.1%), Europe (0.3%), Latin America (2.0%), North America (0.0%), Oceania (0.0%)

#10. Darlington County
- Born in South Carolina: 53,088 (79.2% of population)
- Born in another U.S. state or territory: 12,605 (18.8% of population)
--- Midwest (3.3%), Northeast (5.5%), South (9.0%), West (0.9%)
- Born in another country: 1,123 (1.7% of population)
--- Africa (0.0%), Asia (0.4%), Europe (0.3%), Latin America (0.9%), North America (0.1%), Oceania (0.0%)

#9. Allendale County
- Born in South Carolina: 7,163 (79.4% of population)
- Born in another U.S. state or territory: 1,635 (18.1% of population)
--- Midwest (1.0%), Northeast (5.4%), South (11.0%), West (0.5%)
- Born in another country: 154 (1.7% of population)
--- Africa (0.0%), Asia (0.1%), Europe (0.2%), Latin America (1.4%), North America (0.0%), Oceania (0.0%)

#8. Lee County
- Born in South Carolina: 13,984 (80.5% of population)
- Born in another U.S. state or territory: 3,096 (17.8% of population)
--- Midwest (1.2%), Northeast (6.0%), South (9.1%), West (1.5%)
- Born in another country: 262 (1.5% of population)
--- Africa (0.0%), Asia (0.0%), Europe (0.1%), Latin America (1.3%), North America (0.0%), Oceania (0.0%)

#7. Hampton County
- Born in South Carolina: 15,775 (80.6% of population)
- Born in another U.S. state or territory: 3,052 (15.6% of population)
--- Midwest (1.4%), Northeast (4.9%), South (8.2%), West (0.7%)
- Born in another country: 609 (3.1% of population)
--- Africa (0.1%), Asia (0.7%), Europe (0.2%), Latin America (2.1%), North America (0.0%), Oceania (0.0%)

#6. Orangeburg County
- Born in South Carolina: 71,292 (81.3% of population)
- Born in another U.S. state or territory: 14,957 (17.1% of population)
--- Midwest (2.2%), Northeast (6.2%), South (7.3%), West (1.2%)
- Born in another country: 1,140 (1.3% of population)
--- Africa (0.2%), Asia (0.5%), Europe (0.3%), Latin America (0.3%), North America (0.0%), Oceania (0.0%)

#5. Dillon County
- Born in South Carolina: 25,093 (81.8% of population)
- Born in another U.S. state or territory: 4,756 (15.5% of population)
--- Midwest (0.9%), Northeast (4.3%), South (9.5%), West (0.9%)
- Born in another country: 695 (2.3% of population)
--- Africa (0.7%), Asia (0.0%), Europe (0.0%), Latin America (1.5%), North America (0.0%), Oceania (0.0%)

#4. Marion County
- Born in South Carolina: 25,606 (81.8% of population)
- Born in another U.S. state or territory: 4,919 (15.7% of population)
--- Midwest (1.2%), Northeast (3.8%), South (9.6%), West (1.1%)
- Born in another country: 684 (2.2% of population)
--- Africa (0.0%), Asia (0.5%), Europe (0.1%), Latin America (1.7%), North America (0.0%), Oceania (0.0%)

#3. Fairfield County
- Born in South Carolina: 18,626 (82.5% of population)
- Born in another U.S. state or territory: 3,636 (16.1% of population)
--- Midwest (1.8%), Northeast (4.6%), South (8.7%), West (1.0%)
- Born in another country: 163 (0.7% of population)
--- Africa (0.0%), Asia (0.0%), Europe (0.0%), Latin America (0.7%), North America (0.0%), Oceania (0.0%)

#2. Williamsburg County
- Born in South Carolina: 25,947 (82.8% of population)
- Born in another U.S. state or territory: 4,659 (14.9% of population)
--- Midwest (0.5%), Northeast (4.9%), South (8.0%), West (0.7%)
- Born in another country: 571 (1.8% of population)
--- Africa (0.0%), Asia (0.4%), Europe (0.0%), Latin America (1.3%), North America (0.1%), Oceania (0.0%)
#1. Union County
- Born in South Carolina: 22,835 (83.1% of population)
- Born in another U.S. state or territory: 4,318 (15.7% of population)
--- Midwest (2.1%), Northeast (3.6%), South (8.9%), West (1.2%)
- Born in another country: 261 (0.9% of population)
--- Africa (0.0%), Asia (0.0%), Europe (0.1%), Latin America (0.8%), North America (0.0%), Oceania (0.0%)


