
Counties with the highest COVID-19 vaccination rate in California
Counties with the highest COVID-19 vaccination rate in California
As has been true throughout America’s COVID-19 history, every state—and every county threin—has its own COVID-19 story, driven by local policies and behaviors. The United States as of April 20 had reached 568,439 COVID-19-related deaths and more than 31.8 million COVID-19 cases, according to Johns Hopkins University. Amid the grim numbers come two bright spots: As of Feb. 2, more Americans had been vaccinated for COVID-19 than had been infected; and since then, rolling averages for case counts and deaths have been on the decline.
Stacker compiled a list of the counties with highest COVID-19 vaccination rates in California using data from the U.S. Department of Health & Human Services. Counties are ranked by the highest vaccination rate as of April 19, 2021. In California, 25.4% of the total population has been fully vaccinated, compared to 25.6% nationwide. Keep reading to see whether your county ranks among the highest COVID-19 vaccination rates in your state.

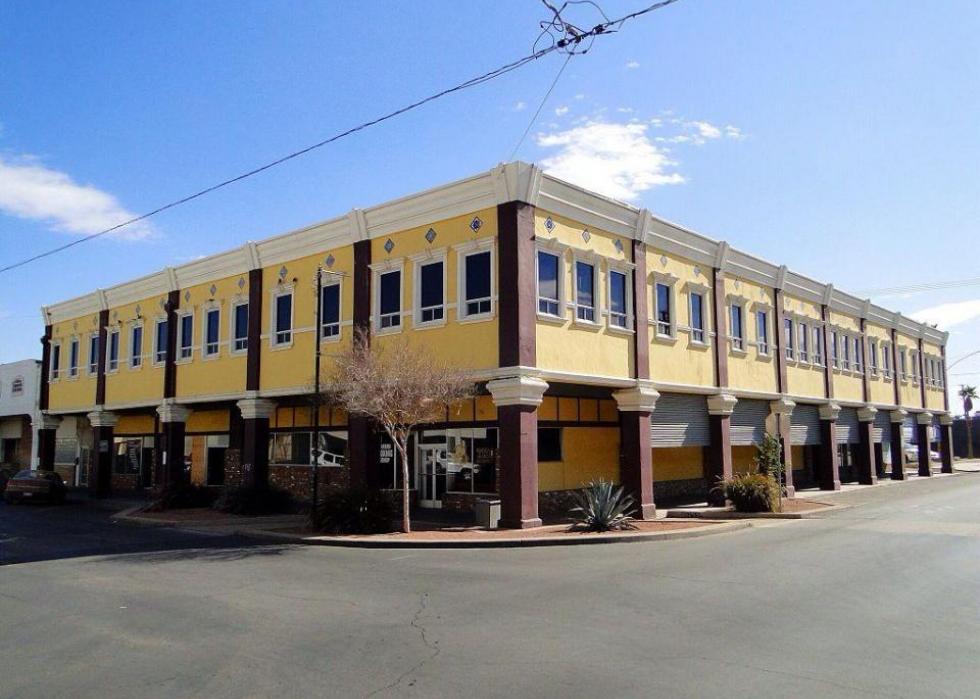
#50. Kings County
--- 39.8% lower vaccination rate than California
- Population over 65 that is fully vaccinated: 43.6% (6,987 fully vaccinated)
--- 31.2% lower vaccination rate than California
- Cumulative deaths per 100k: 160 (245 total deaths)
--- 6.0% more deaths per 100k residents than California
- Cumulative cases per 100k: 14,891 (22,774 total cases)
--- 62.7% more cases per 100k residents than California

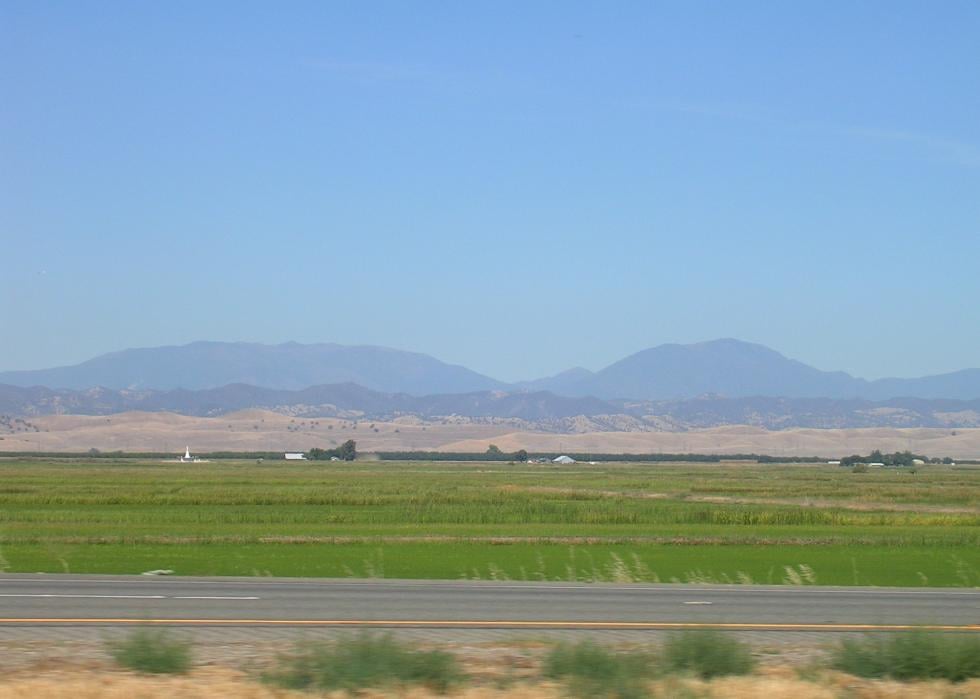
#49. Merced County
--- 37.4% lower vaccination rate than California
- Population over 65 that is fully vaccinated: 51.2% (16,201 fully vaccinated)
--- 19.2% lower vaccination rate than California
- Cumulative deaths per 100k: 163 (452 total deaths)
--- 7.9% more deaths per 100k residents than California
- Cumulative cases per 100k: 11,235 (31,196 total cases)
--- 22.7% more cases per 100k residents than California

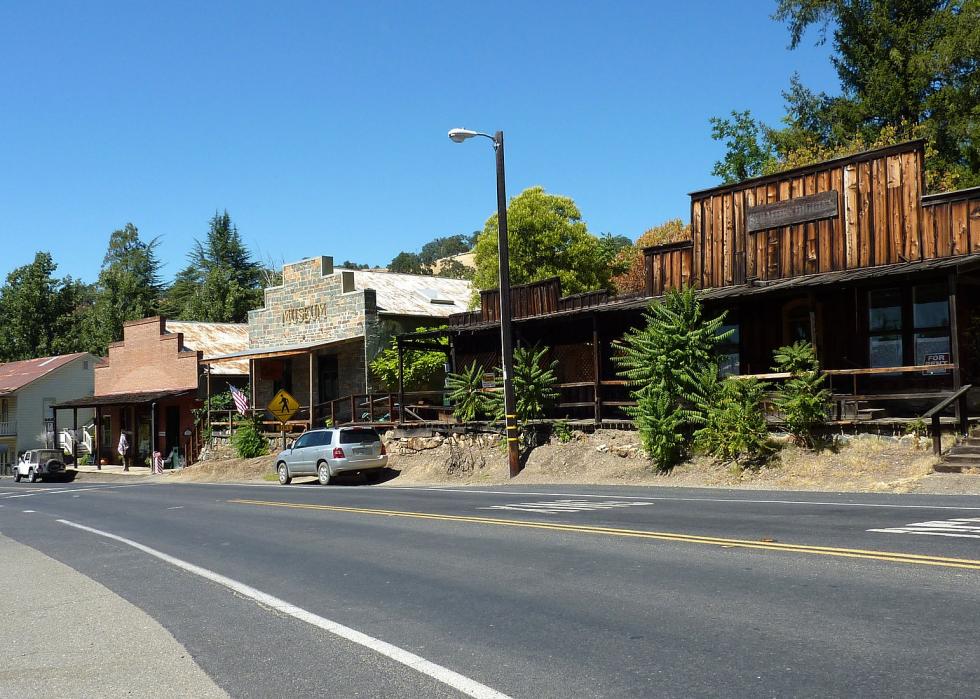
#48. Tehama County
--- 36.2% lower vaccination rate than California
- Population over 65 that is fully vaccinated: 40.2% (5,136 fully vaccinated)
--- 36.6% lower vaccination rate than California
- Cumulative deaths per 100k: 86 (56 total deaths)
--- 43.0% less deaths per 100k residents than California
- Cumulative cases per 100k: 8,343 (5,430 total cases)
--- 8.9% less cases per 100k residents than California

#47. Del Norte County
--- 33.9% lower vaccination rate than California
- Population over 65 that is fully vaccinated: 46.4% (2,379 fully vaccinated)
--- 26.8% lower vaccination rate than California
- Cumulative deaths per 100k: 25 (7 total deaths)
--- 83.4% less deaths per 100k residents than California
- Cumulative cases per 100k: 4,581 (1,274 total cases)
--- 50.0% less cases per 100k residents than California

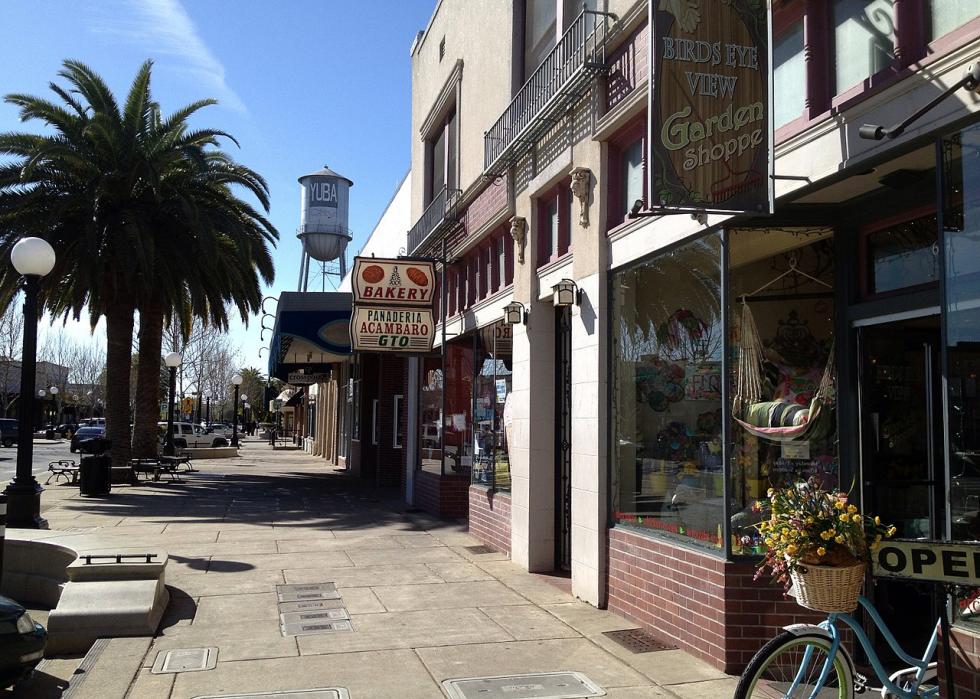
#46. Yuba County
--- 33.5% lower vaccination rate than California
- Population over 65 that is fully vaccinated: 53.4% (5,480 fully vaccinated)
--- 15.8% lower vaccination rate than California
- Cumulative deaths per 100k: 56 (44 total deaths)
--- 62.9% less deaths per 100k residents than California
- Cumulative cases per 100k: 7,752 (6,098 total cases)
--- 15.3% less cases per 100k residents than California

#45. Shasta County
--- 31.1% lower vaccination rate than California
- Population over 65 that is fully vaccinated: 44.0% (16,768 fully vaccinated)
--- 30.6% lower vaccination rate than California
- Cumulative deaths per 100k: 121 (217 total deaths)
--- 19.9% less deaths per 100k residents than California
- Cumulative cases per 100k: 6,484 (11,677 total cases)
--- 29.2% less cases per 100k residents than California

#44. Lassen County
--- 30.7% lower vaccination rate than California
- Population over 65 that is fully vaccinated: 56.9% (2,698 fully vaccinated)
--- 10.3% lower vaccination rate than California
- Cumulative deaths per 100k: 79 (24 total deaths)
--- 47.7% less deaths per 100k residents than California
- Cumulative cases per 100k: 18,543 (5,669 total cases)
--- 102.6% more cases per 100k residents than California

#43. San Bernardino County
--- 28.0% lower vaccination rate than California
- Population over 65 that is fully vaccinated: 56.2% (146,355 fully vaccinated)
--- 11.4% lower vaccination rate than California
- Cumulative deaths per 100k: 209 (4,555 total deaths)
--- 38.4% more deaths per 100k residents than California
- Cumulative cases per 100k: 13,521 (294,779 total cases)
--- 47.7% more cases per 100k residents than California

#42. Kern County
--- 28.0% lower vaccination rate than California
- Population over 65 that is fully vaccinated: 56.3% (56,938 fully vaccinated)
--- 11.2% lower vaccination rate than California
- Cumulative deaths per 100k: 147 (1,322 total deaths)
--- 2.6% less deaths per 100k residents than California
- Cumulative cases per 100k: 11,982 (107,859 total cases)
--- 30.9% more cases per 100k residents than California

#41. Stanislaus County
--- 27.6% lower vaccination rate than California
- Population over 65 that is fully vaccinated: 53.1% (39,266 fully vaccinated)
--- 16.2% lower vaccination rate than California
- Cumulative deaths per 100k: 187 (1,028 total deaths)
--- 23.8% more deaths per 100k residents than California
- Cumulative cases per 100k: 10,966 (60,383 total cases)
--- 19.8% more cases per 100k residents than California

#40. San Diego County
--- 25.2% lower vaccination rate than California
- Population over 65 that is fully vaccinated: 49.8% (241,461 fully vaccinated)
--- 21.5% lower vaccination rate than California
- Cumulative deaths per 100k: 110 (3,674 total deaths)
--- 27.2% less deaths per 100k residents than California
- Cumulative cases per 100k: 8,236 (274,960 total cases)
--- 10.0% less cases per 100k residents than California

#39. San Joaquin County
--- 24.4% lower vaccination rate than California
- Population over 65 that is fully vaccinated: 59.7% (59,594 fully vaccinated)
--- 5.8% lower vaccination rate than California
- Cumulative deaths per 100k: 175 (1,334 total deaths)
--- 15.9% more deaths per 100k residents than California
- Cumulative cases per 100k: 9,372 (71,431 total cases)
--- 2.4% more cases per 100k residents than California
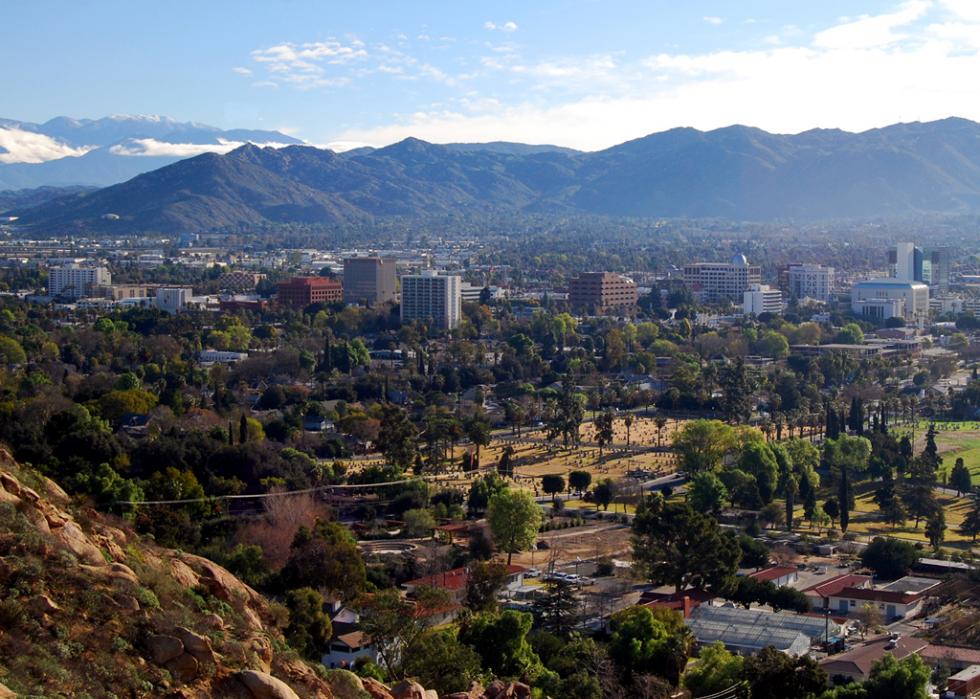
#38. Riverside County
--- 22.0% lower vaccination rate than California
- Population over 65 that is fully vaccinated: 58.6% (214,557 fully vaccinated)
--- 7.6% lower vaccination rate than California
- Cumulative deaths per 100k: 183 (4,525 total deaths)
--- 21.2% more deaths per 100k residents than California
- Cumulative cases per 100k: 12,030 (297,215 total cases)
--- 31.4% more cases per 100k residents than California
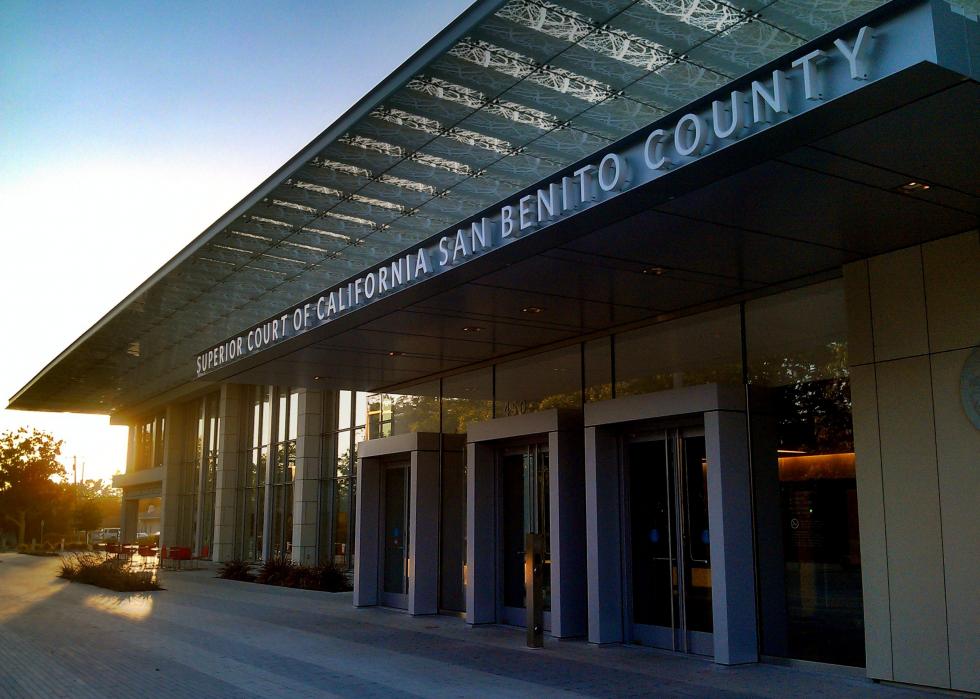
#37. San Benito County
--- 18.9% lower vaccination rate than California
- Population over 65 that is fully vaccinated: 57.6% (4,755 fully vaccinated)
--- 9.1% lower vaccination rate than California
- Cumulative deaths per 100k: 100 (63 total deaths)
--- 33.8% less deaths per 100k residents than California
- Cumulative cases per 100k: 9,531 (5,986 total cases)
--- 4.1% more cases per 100k residents than California
#36. Tulare County
--- 17.7% lower vaccination rate than California
- Population over 65 that is fully vaccinated: 58.2% (31,602 fully vaccinated)
--- 8.2% lower vaccination rate than California
- Cumulative deaths per 100k: 178 (830 total deaths)
--- 17.9% more deaths per 100k residents than California
- Cumulative cases per 100k: 10,593 (49,383 total cases)
--- 15.7% more cases per 100k residents than California
#35. Madera County
--- 17.7% lower vaccination rate than California
- Population over 65 that is fully vaccinated: 59.7% (13,483 fully vaccinated)
--- 5.8% lower vaccination rate than California
- Cumulative deaths per 100k: 152 (239 total deaths)
--- 0.7% more deaths per 100k residents than California
- Cumulative cases per 100k: 10,335 (16,260 total cases)
--- 12.9% more cases per 100k residents than California

#34. Colusa County
--- 16.5% lower vaccination rate than California
- Population over 65 that is fully vaccinated: 55.0% (1,769 fully vaccinated)
--- 13.2% lower vaccination rate than California
- Cumulative deaths per 100k: 74 (16 total deaths)
--- 51.0% less deaths per 100k residents than California
- Cumulative cases per 100k: 10,201 (2,198 total cases)
--- 11.4% more cases per 100k residents than California
#33. Imperial County
--- 15.7% lower vaccination rate than California
- Population over 65 that is fully vaccinated: 53.6% (12,941 fully vaccinated)
--- 15.5% lower vaccination rate than California
- Cumulative deaths per 100k: 397 (719 total deaths)
--- 162.9% more deaths per 100k residents than California
- Cumulative cases per 100k: 15,444 (27,987 total cases)
--- 68.7% more cases per 100k residents than California
#32. Glenn County
--- 12.6% lower vaccination rate than California
- Population over 65 that is fully vaccinated: 64.5% (2,887 fully vaccinated)
--- 1.7% higher vaccination rate than California
- Cumulative deaths per 100k: 88 (25 total deaths)
--- 41.7% less deaths per 100k residents than California
- Cumulative cases per 100k: 8,301 (2,357 total cases)
--- 9.3% less cases per 100k residents than California

#31. San Luis Obispo County
--- 11.0% lower vaccination rate than California
- Population over 65 that is fully vaccinated: 57.8% (34,155 fully vaccinated)
--- 8.8% lower vaccination rate than California
- Cumulative deaths per 100k: 90 (256 total deaths)
--- 40.4% less deaths per 100k residents than California
- Cumulative cases per 100k: 7,388 (20,917 total cases)
--- 19.3% less cases per 100k residents than California
#30. Amador County
--- 9.8% lower vaccination rate than California
- Population over 65 that is fully vaccinated: 51.9% (5,682 fully vaccinated)
--- 18.1% lower vaccination rate than California
- Cumulative deaths per 100k: 128 (51 total deaths)
--- 15.2% less deaths per 100k residents than California
- Cumulative cases per 100k: 9,119 (3,625 total cases)
--- 0.4% less cases per 100k residents than California

#29. Calaveras County
--- 8.7% lower vaccination rate than California
- Population over 65 that is fully vaccinated: 54.8% (7,055 fully vaccinated)
--- 13.6% lower vaccination rate than California
- Cumulative deaths per 100k: 111 (51 total deaths)
--- 26.5% less deaths per 100k residents than California
- Cumulative cases per 100k: 4,477 (2,055 total cases)
--- 51.1% less cases per 100k residents than California
#28. Sutter County
--- 7.9% lower vaccination rate than California
- Population over 65 that is fully vaccinated: 61.6% (9,294 fully vaccinated)
--- 2.8% lower vaccination rate than California
- Cumulative deaths per 100k: 112 (109 total deaths)
--- 25.8% less deaths per 100k residents than California
- Cumulative cases per 100k: 9,557 (9,268 total cases)
--- 4.4% more cases per 100k residents than California

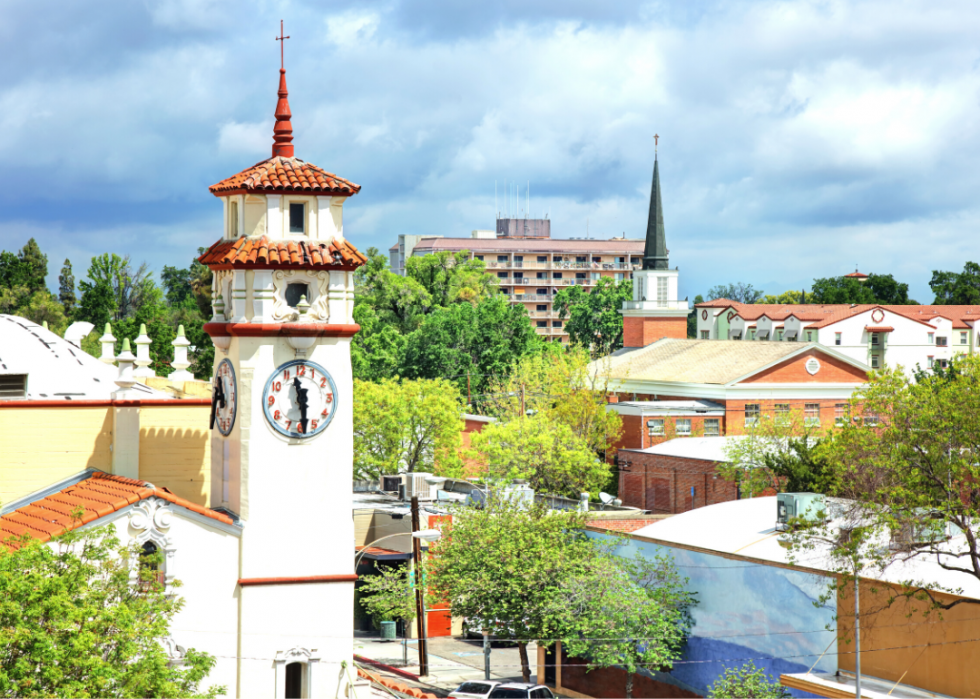
#27. Fresno County
--- 7.1% lower vaccination rate than California
- Population over 65 that is fully vaccinated: 63.3% (79,347 fully vaccinated)
--- 0.2% lower vaccination rate than California
- Cumulative deaths per 100k: 165 (1,646 total deaths)
--- 9.3% more deaths per 100k residents than California
- Cumulative cases per 100k: 10,065 (100,562 total cases)
--- 10.0% more cases per 100k residents than California

#26. Monterey County
--- 5.1% lower vaccination rate than California
- Population over 65 that is fully vaccinated: 62.2% (37,757 fully vaccinated)
--- 1.9% lower vaccination rate than California
- Cumulative deaths per 100k: 82 (357 total deaths)
--- 45.7% less deaths per 100k residents than California
- Cumulative cases per 100k: 9,968 (43,267 total cases)
--- 8.9% more cases per 100k residents than California

#25. Sacramento County
--- 4.3% lower vaccination rate than California
- Population over 65 that is fully vaccinated: 63.8% (143,528 fully vaccinated)
--- 0.6% higher vaccination rate than California
- Cumulative deaths per 100k: 106 (1,646 total deaths)
--- 29.8% less deaths per 100k residents than California
- Cumulative cases per 100k: 6,519 (101,172 total cases)
--- 28.8% less cases per 100k residents than California
#24. Solano County
--- 4.3% lower vaccination rate than California
- Population over 65 that is fully vaccinated: 57.2% (41,852 fully vaccinated)
--- 9.8% lower vaccination rate than California
- Cumulative deaths per 100k: 53 (239 total deaths)
--- 64.9% less deaths per 100k residents than California
- Cumulative cases per 100k: 7,121 (31,875 total cases)
--- 22.2% less cases per 100k residents than California

#23. Humboldt County
--- 2.4% lower vaccination rate than California
- Population over 65 that is fully vaccinated: 61.8% (15,559 fully vaccinated)
--- 2.5% lower vaccination rate than California
- Cumulative deaths per 100k: 27 (37 total deaths)
--- 82.1% less deaths per 100k residents than California
- Cumulative cases per 100k: 2,646 (3,587 total cases)
--- 71.1% less cases per 100k residents than California

#22. Butte County
--- 1.6% lower vaccination rate than California
- Population over 65 that is fully vaccinated: 60.6% (24,370 fully vaccinated)
--- 4.4% lower vaccination rate than California
- Cumulative deaths per 100k: 89 (196 total deaths)
--- 41.1% less deaths per 100k residents than California
- Cumulative cases per 100k: 5,280 (11,573 total cases)
--- 42.3% less cases per 100k residents than California
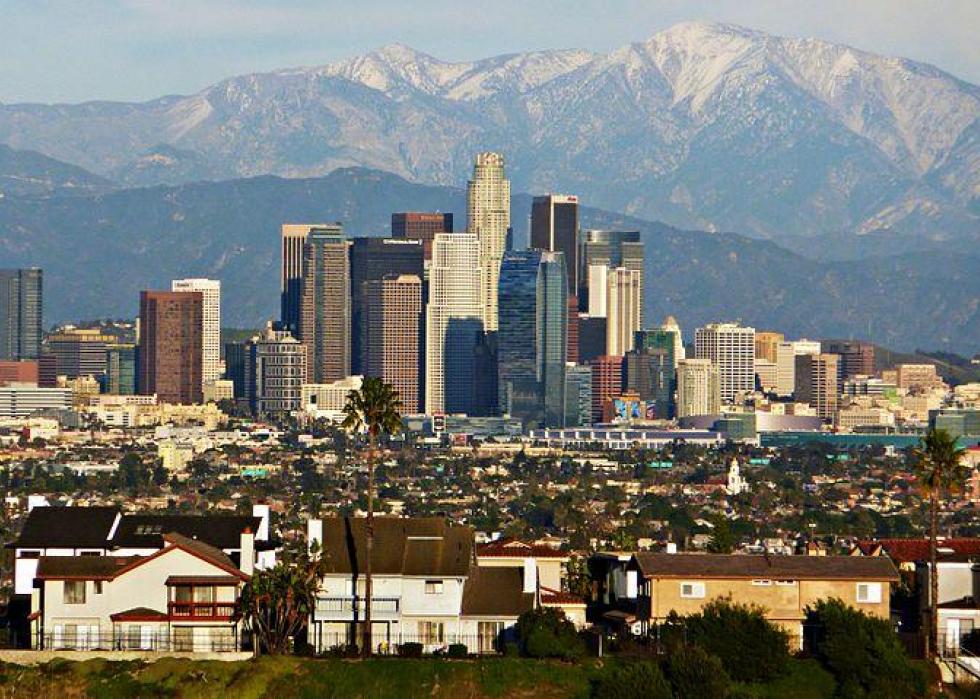
#21. Los Angeles County
--- 1.2% lower vaccination rate than California
- Population over 65 that is fully vaccinated: 59.4% (839,426 fully vaccinated)
--- 6.3% lower vaccination rate than California
- Cumulative deaths per 100k: 236 (23,653 total deaths)
--- 56.3% more deaths per 100k residents than California
- Cumulative cases per 100k: 12,242 (1,228,997 total cases)
--- 33.7% more cases per 100k residents than California

#20. Santa Barbara County
--- 0.4% lower vaccination rate than California
- Population over 65 that is fully vaccinated: 67.8% (47,549 fully vaccinated)
--- 6.9% higher vaccination rate than California
- Cumulative deaths per 100k: 100 (446 total deaths)
--- 33.8% less deaths per 100k residents than California
- Cumulative cases per 100k: 7,592 (33,896 total cases)
--- 17.1% less cases per 100k residents than California
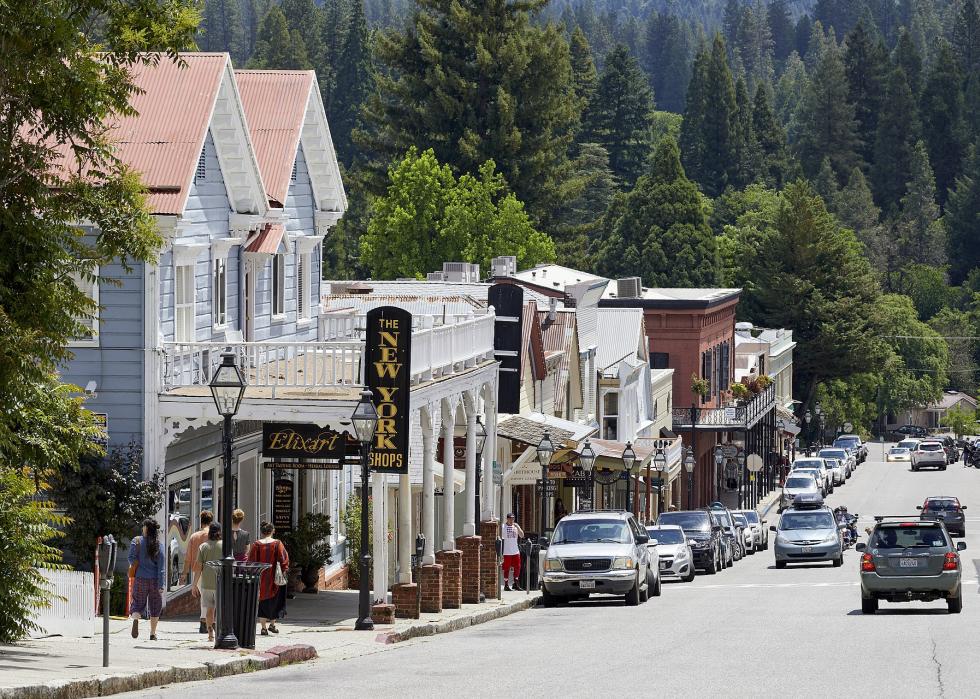
#19. Nevada County
--- 1.2% higher vaccination rate than California
- Population over 65 that is fully vaccinated: 54.0% (15,272 fully vaccinated)
--- 14.8% lower vaccination rate than California
- Cumulative deaths per 100k: 75 (75 total deaths)
--- 50.3% less deaths per 100k residents than California
- Cumulative cases per 100k: 4,468 (4,457 total cases)
--- 51.2% less cases per 100k residents than California

#18. Orange County
--- 2.0% higher vaccination rate than California
- Population over 65 that is fully vaccinated: 65.8% (319,274 fully vaccinated)
--- 3.8% higher vaccination rate than California
- Cumulative deaths per 100k: 154 (4,896 total deaths)
--- 2.0% more deaths per 100k residents than California
- Cumulative cases per 100k: 8,469 (268,962 total cases)
--- 7.5% less cases per 100k residents than California

#17. El Dorado County
--- 2.8% higher vaccination rate than California
- Population over 65 that is fully vaccinated: 60.5% (25,575 fully vaccinated)
--- 4.6% lower vaccination rate than California
- Cumulative deaths per 100k: 57 (109 total deaths)
--- 62.3% less deaths per 100k residents than California
- Cumulative cases per 100k: 5,040 (9,719 total cases)
--- 44.9% less cases per 100k residents than California

#16. Siskiyou County
--- 4.7% higher vaccination rate than California
- Population over 65 that is fully vaccinated: 54.9% (6,250 fully vaccinated)
--- 13.4% lower vaccination rate than California
- Cumulative deaths per 100k: 48 (21 total deaths)
--- 68.2% less deaths per 100k residents than California
- Cumulative cases per 100k: 4,456 (1,940 total cases)
--- 51.3% less cases per 100k residents than California
#15. Lake County
--- 6.3% higher vaccination rate than California
- Population over 65 that is fully vaccinated: 59.3% (8,812 fully vaccinated)
--- 6.5% lower vaccination rate than California
- Cumulative deaths per 100k: 67 (43 total deaths)
--- 55.6% less deaths per 100k residents than California
- Cumulative cases per 100k: 5,295 (3,409 total cases)
--- 42.2% less cases per 100k residents than California

#14. Santa Clara County
--- 6.7% higher vaccination rate than California
- Population over 65 that is fully vaccinated: 71.2% (190,875 fully vaccinated)
--- 12.3% higher vaccination rate than California
- Cumulative deaths per 100k: 104 (2,013 total deaths)
--- 31.1% less deaths per 100k residents than California
- Cumulative cases per 100k: 6,073 (117,081 total cases)
--- 33.7% less cases per 100k residents than California

#13. Yolo County
--- 10.6% higher vaccination rate than California
- Population over 65 that is fully vaccinated: 70.8% (20,179 fully vaccinated)
--- 11.7% higher vaccination rate than California
- Cumulative deaths per 100k: 91 (200 total deaths)
--- 39.7% less deaths per 100k residents than California
- Cumulative cases per 100k: 6,159 (13,580 total cases)
--- 32.7% less cases per 100k residents than California
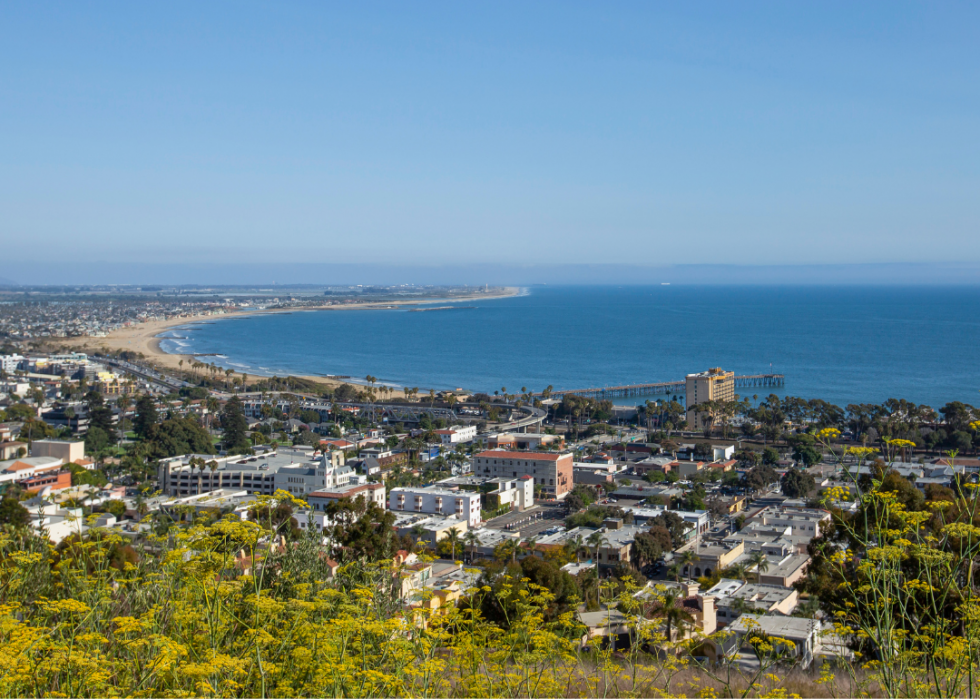
#12. Ventura County
--- 11.0% higher vaccination rate than California
- Population over 65 that is fully vaccinated: 69.1% (94,459 fully vaccinated)
--- 9.0% higher vaccination rate than California
- Cumulative deaths per 100k: 118 (1,000 total deaths)
--- 21.9% less deaths per 100k residents than California
- Cumulative cases per 100k: 9,483 (80,230 total cases)
--- 3.6% more cases per 100k residents than California

#11. Placer County
--- 13.0% higher vaccination rate than California
- Population over 65 that is fully vaccinated: 69.0% (54,774 fully vaccinated)
--- 8.8% higher vaccination rate than California
- Cumulative deaths per 100k: 71 (283 total deaths)
--- 53.0% less deaths per 100k residents than California
- Cumulative cases per 100k: 5,461 (21,751 total cases)
--- 40.3% less cases per 100k residents than California

#10. Tuolumne County
--- 14.6% higher vaccination rate than California
- Population over 65 that is fully vaccinated: 65.2% (9,589 fully vaccinated)
--- 2.8% higher vaccination rate than California
- Cumulative deaths per 100k: 117 (64 total deaths)
--- 22.5% less deaths per 100k residents than California
- Cumulative cases per 100k: 7,464 (4,066 total cases)
--- 18.5% less cases per 100k residents than California

#9. Santa Cruz County
--- 18.9% higher vaccination rate than California
- Population over 65 that is fully vaccinated: 68.8% (32,463 fully vaccinated)
--- 8.5% higher vaccination rate than California
- Cumulative deaths per 100k: 75 (204 total deaths)
--- 50.3% less deaths per 100k residents than California
- Cumulative cases per 100k: 5,699 (15,571 total cases)
--- 37.7% less cases per 100k residents than California
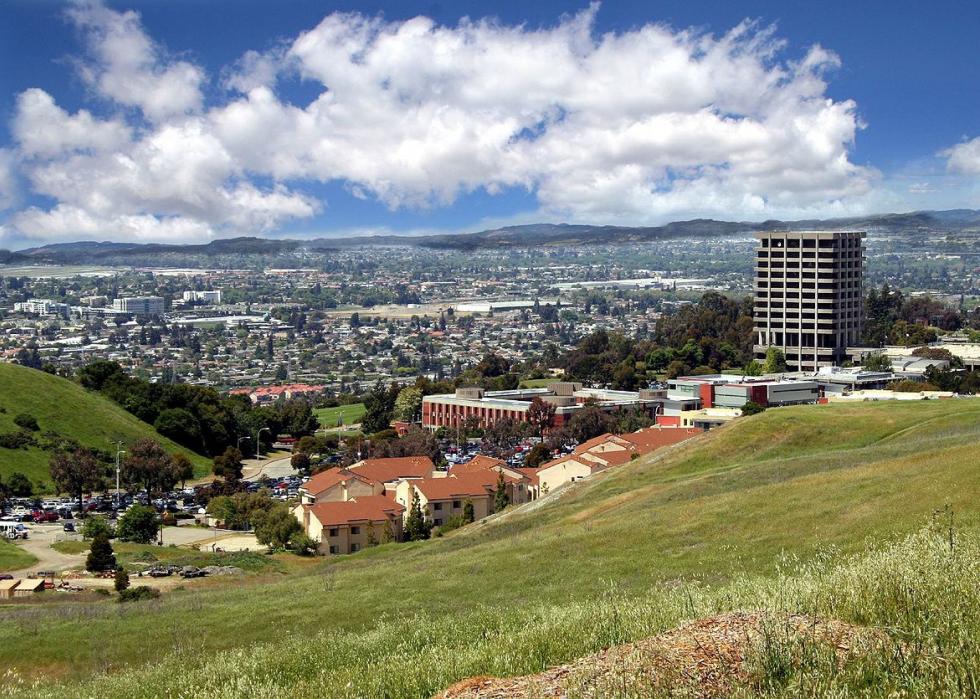
#8. Alameda County
--- 24.4% higher vaccination rate than California
- Population over 65 that is fully vaccinated: 72.1% (172,171 fully vaccinated)
--- 13.7% higher vaccination rate than California
- Cumulative deaths per 100k: 88 (1,477 total deaths)
--- 41.7% less deaths per 100k residents than California
- Cumulative cases per 100k: 5,108 (85,367 total cases)
--- 44.2% less cases per 100k residents than California

#7. Contra Costa County
--- 26.4% higher vaccination rate than California
- Population over 65 that is fully vaccinated: 77.6% (145,747 fully vaccinated)
--- 22.4% higher vaccination rate than California
- Cumulative deaths per 100k: 68 (782 total deaths)
--- 55.0% less deaths per 100k residents than California
- Cumulative cases per 100k: 5,810 (67,019 total cases)
--- 36.5% less cases per 100k residents than California

#6. Mendocino County
--- 28.0% higher vaccination rate than California
- Population over 65 that is fully vaccinated: 64.4% (12,895 fully vaccinated)
--- 1.6% higher vaccination rate than California
- Cumulative deaths per 100k: 54 (47 total deaths)
--- 64.2% less deaths per 100k residents than California
- Cumulative cases per 100k: 4,596 (3,987 total cases)
--- 49.8% less cases per 100k residents than California

#5. Sonoma County
--- 31.1% higher vaccination rate than California
- Population over 65 that is fully vaccinated: 70.3% (71,896 fully vaccinated)
--- 10.9% higher vaccination rate than California
- Cumulative deaths per 100k: 63 (311 total deaths)
--- 58.3% less deaths per 100k residents than California
- Cumulative cases per 100k: 6,007 (29,696 total cases)
--- 34.4% less cases per 100k residents than California
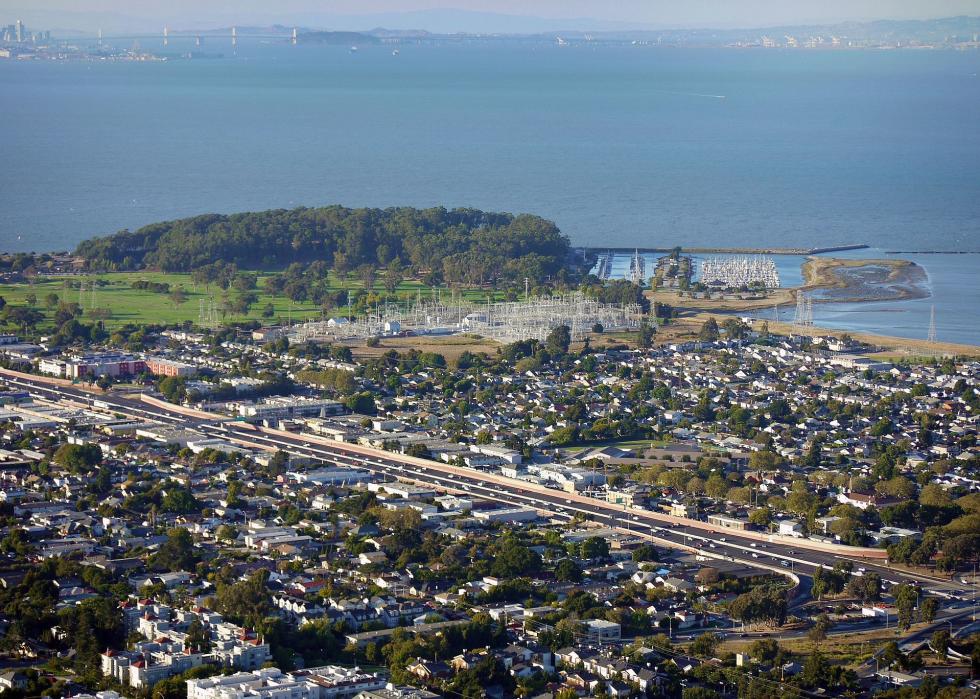
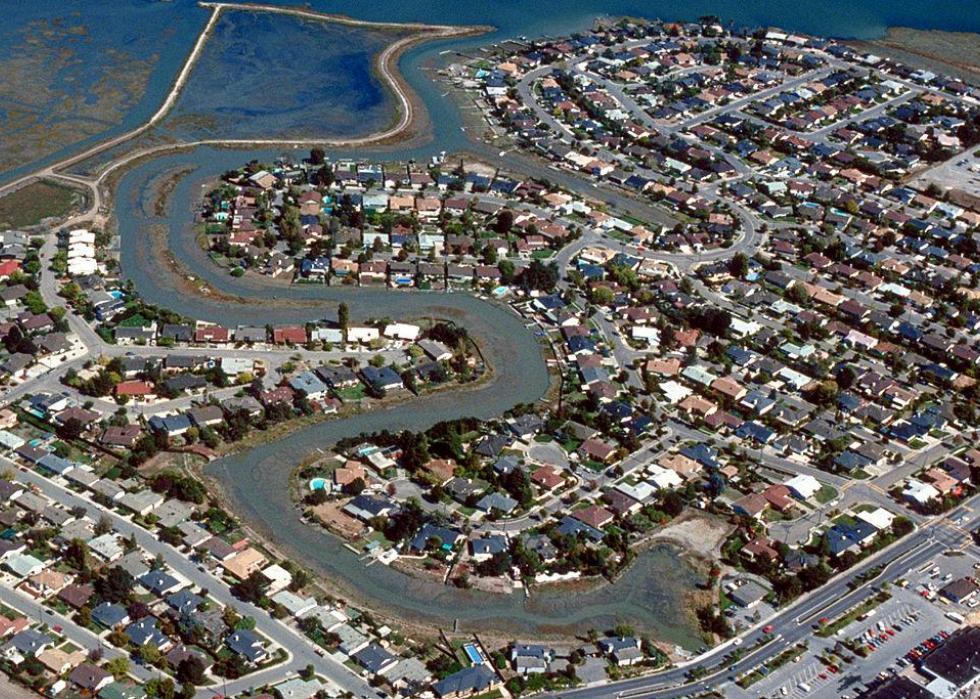
#4. San Mateo County
--- 32.7% higher vaccination rate than California
- Population over 65 that is fully vaccinated: 72.5% (91,937 fully vaccinated)
--- 14.4% higher vaccination rate than California
- Cumulative deaths per 100k: 73 (560 total deaths)
--- 51.7% less deaths per 100k residents than California
- Cumulative cases per 100k: 5,369 (41,157 total cases)
--- 41.3% less cases per 100k residents than California

#3. Napa County
--- 33.5% higher vaccination rate than California
- Population over 65 that is fully vaccinated: 70.6% (19,160 fully vaccinated)
--- 11.4% higher vaccination rate than California
- Cumulative deaths per 100k: 57 (79 total deaths)
--- 62.3% less deaths per 100k residents than California
- Cumulative cases per 100k: 7,017 (9,666 total cases)
--- 23.3% less cases per 100k residents than California

#2. San Francisco County
--- 42.1% higher vaccination rate than California
- Population over 65 that is fully vaccinated: 66.6% (94,476 fully vaccinated)
--- 5.0% higher vaccination rate than California
- Cumulative deaths per 100k: 59 (523 total deaths)
--- 60.9% less deaths per 100k residents than California
- Cumulative cases per 100k: 4,087 (36,032 total cases)
--- 55.4% less cases per 100k residents than California
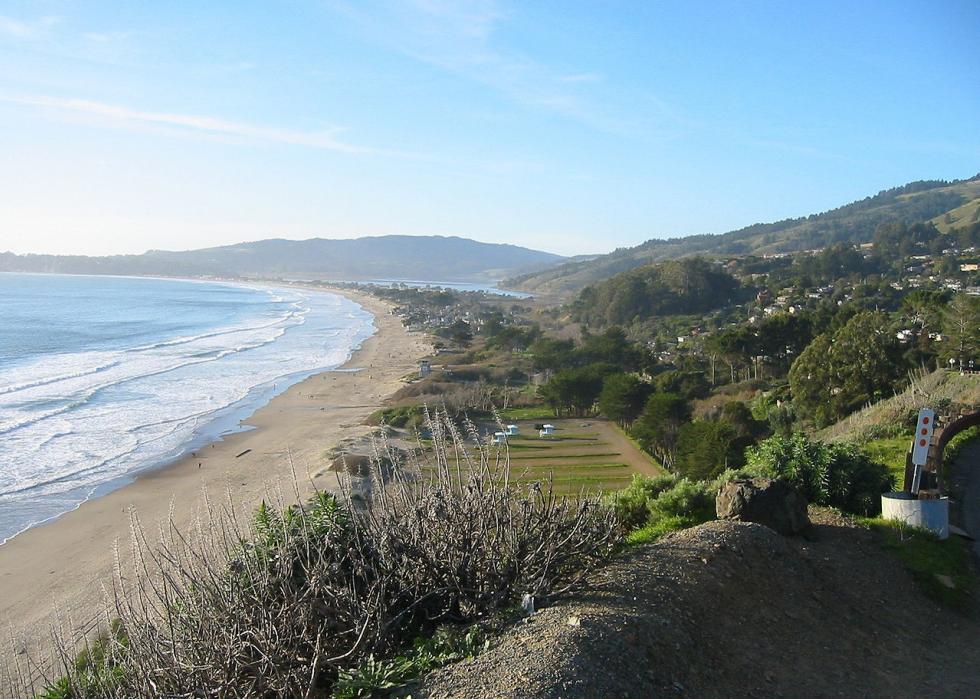
#1. Marin County
--- 67.7% higher vaccination rate than California
- Population over 65 that is fully vaccinated: 78.1% (46,366 fully vaccinated)
--- 23.2% higher vaccination rate than California
- Cumulative deaths per 100k: 87 (226 total deaths)
--- 42.4% less deaths per 100k residents than California
- Cumulative cases per 100k: 5,355 (13,861 total cases)
--- 41.5% less cases per 100k residents than California


