
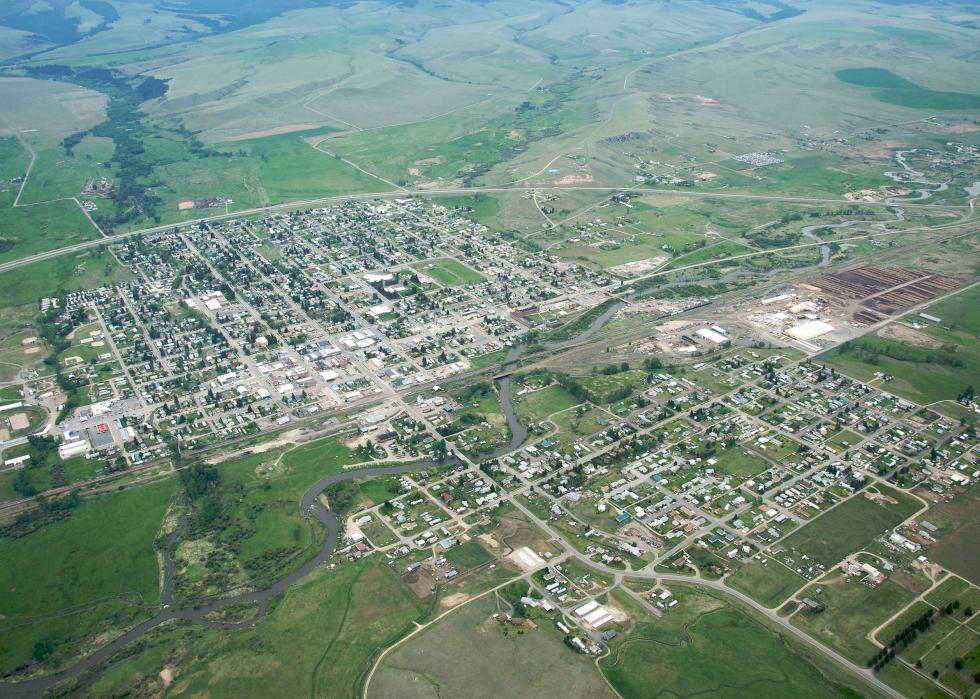
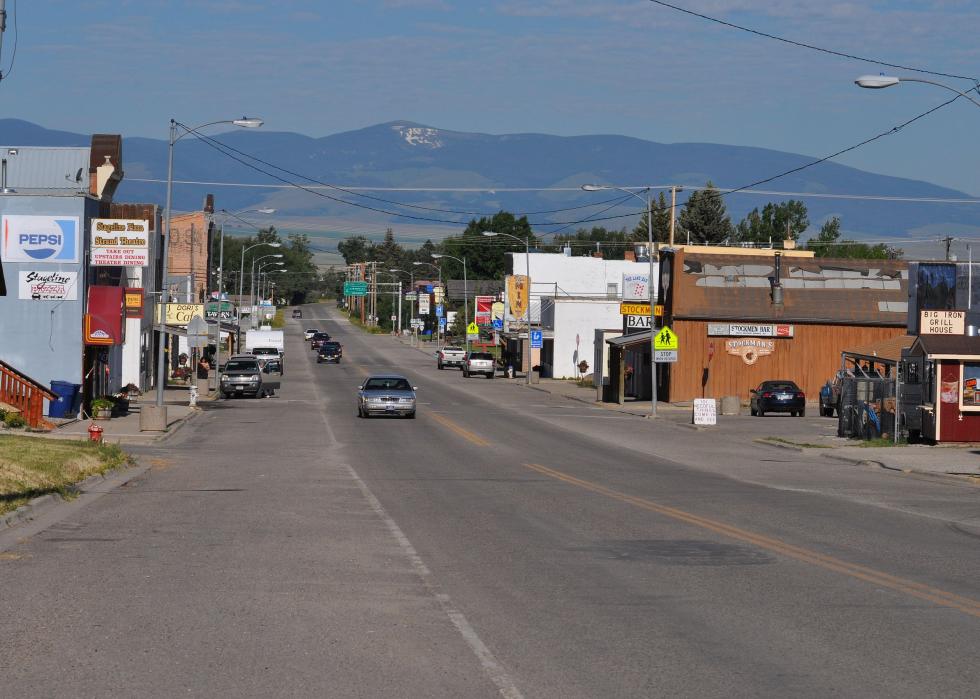
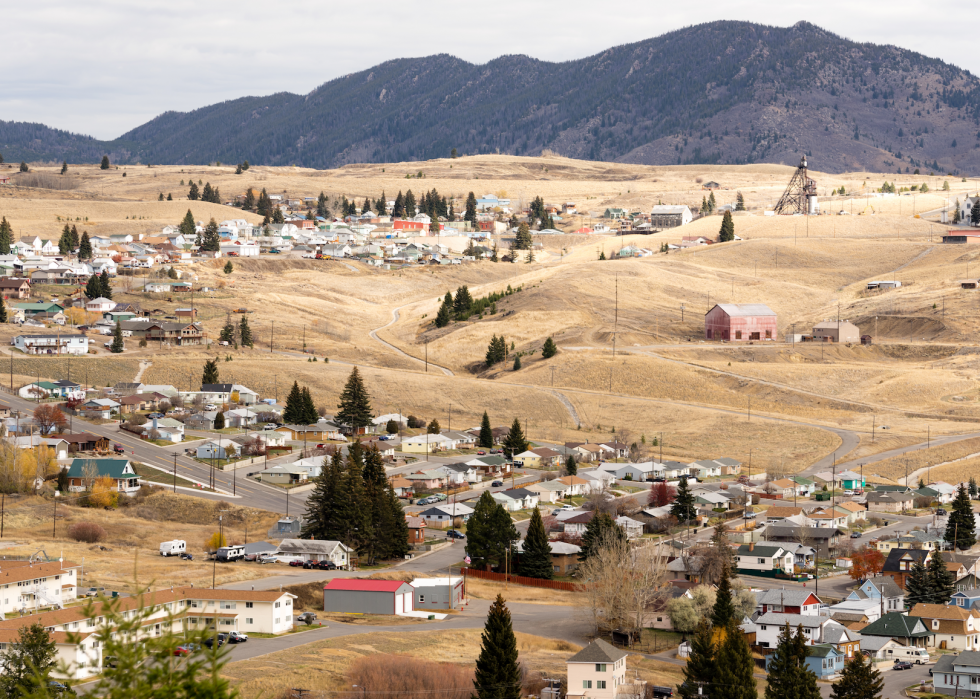
Counties with the highest COVID-19 vaccination rate in Montana
Counties with the highest COVID-19 vaccination rate in Montana
As has been true throughout America’s COVID-19 history, every state—and every county threin—has its own COVID-19 story, driven by local policies and behaviors. The United States as of April 20 had reached 568,439 COVID-19-related deaths and more than 31.8 million COVID-19 cases, according to Johns Hopkins University. Amid the grim numbers come two bright spots: As of Feb. 2, more Americans had been vaccinated for COVID-19 than had been infected; and since then, rolling averages for case counts and deaths have been on the decline.
Stacker compiled a list of the counties with highest COVID-19 vaccination rates in Montana using data from the U.S. Department of Health & Human Services. Counties are ranked by the highest vaccination rate as of April 19, 2021. In Montana, 28.0% of the total population has been fully vaccinated, compared to 25.6% nationwide. Keep reading to see whether your county ranks among the highest COVID-19 vaccination rates in your state.

#50. Carter County
--- 36.8% lower vaccination rate than Montana
- Population over 65 that is fully vaccinated: 43.4% (142 fully vaccinated)
--- 34.4% lower vaccination rate than Montana
- Cumulative deaths per 100k: 399 (5 total deaths)
--- 175.2% more deaths per 100k residents than Montana
- Cumulative cases per 100k: 11,661 (146 total cases)
--- 16.3% more cases per 100k residents than Montana

#49. Flathead County
--- 36.1% lower vaccination rate than Montana
- Population over 65 that is fully vaccinated: 48.9% (10,263 fully vaccinated)
--- 26.1% lower vaccination rate than Montana
- Cumulative deaths per 100k: 88 (91 total deaths)
--- 39.3% less deaths per 100k residents than Montana
- Cumulative cases per 100k: 11,140 (11,564 total cases)
--- 11.1% more cases per 100k residents than Montana

#48. Richland County
--- 35.0% lower vaccination rate than Montana
- Population over 65 that is fully vaccinated: 59.8% (993 fully vaccinated)
--- 9.7% lower vaccination rate than Montana
- Cumulative deaths per 100k: 139 (15 total deaths)
--- 4.1% less deaths per 100k residents than Montana
- Cumulative cases per 100k: 10,710 (1,157 total cases)
--- 6.8% more cases per 100k residents than Montana

#47. Musselshell County
--- 33.6% lower vaccination rate than Montana
- Population over 65 that is fully vaccinated: 41.1% (526 fully vaccinated)
--- 37.9% lower vaccination rate than Montana
- Cumulative deaths per 100k: 216 (10 total deaths)
--- 49.0% more deaths per 100k residents than Montana
- Cumulative cases per 100k: 7,188 (333 total cases)
--- 28.3% less cases per 100k residents than Montana

#46. Lincoln County
--- 31.8% lower vaccination rate than Montana
- Population over 65 that is fully vaccinated: 41.1% (2,425 fully vaccinated)
--- 37.9% lower vaccination rate than Montana
- Cumulative deaths per 100k: 80 (16 total deaths)
--- 44.8% less deaths per 100k residents than Montana
- Cumulative cases per 100k: 8,023 (1,603 total cases)
--- 20.0% less cases per 100k residents than Montana

#45. Chouteau County
--- 31.1% lower vaccination rate than Montana
- Population over 65 that is fully vaccinated: 47.9% (571 fully vaccinated)
--- 27.6% lower vaccination rate than Montana
- Cumulative deaths per 100k: 106 (6 total deaths)
--- 26.9% less deaths per 100k residents than Montana
- Cumulative cases per 100k: 8,802 (496 total cases)
--- 12.2% less cases per 100k residents than Montana

#44. Granite County
--- 29.3% lower vaccination rate than Montana
- Population over 65 that is fully vaccinated: 39.1% (418 fully vaccinated)
--- 40.9% lower vaccination rate than Montana
- Cumulative deaths per 100k: 59 (2 total deaths)
--- 59.3% less deaths per 100k residents than Montana
- Cumulative cases per 100k: 5,623 (190 total cases)
--- 43.9% less cases per 100k residents than Montana

#43. Fallon County
--- 27.5% lower vaccination rate than Montana
- Population over 65 that is fully vaccinated: 60.1% (291 fully vaccinated)
--- 9.2% lower vaccination rate than Montana
- Cumulative deaths per 100k: 70 (2 total deaths)
--- 51.7% less deaths per 100k residents than Montana
- Cumulative cases per 100k: 9,838 (280 total cases)
--- 1.9% less cases per 100k residents than Montana

#42. Sanders County
--- 25.0% lower vaccination rate than Montana
- Population over 65 that is fully vaccinated: 43.8% (1,715 fully vaccinated)
--- 33.8% lower vaccination rate than Montana
- Cumulative deaths per 100k: 116 (14 total deaths)
--- 20.0% less deaths per 100k residents than Montana
- Cumulative cases per 100k: 5,168 (626 total cases)
--- 48.4% less cases per 100k residents than Montana

#41. Toole County
--- 24.3% lower vaccination rate than Montana
- Population over 65 that is fully vaccinated: 55.5% (511 fully vaccinated)
--- 16.2% lower vaccination rate than Montana
- Cumulative deaths per 100k: 211 (10 total deaths)
--- 45.5% more deaths per 100k residents than Montana
- Cumulative cases per 100k: 15,034 (712 total cases)
--- 50.0% more cases per 100k residents than Montana

#40. Petroleum County
--- 23.6% lower vaccination rate than Montana
- Population over 65 that is fully vaccinated: 53.6% (67 fully vaccinated)
--- 19.0% lower vaccination rate than Montana
- Cumulative deaths per 100k: 205 (1 total deaths)
--- 41.4% more deaths per 100k residents than Montana
- Cumulative cases per 100k: 2,464 (12 total cases)
--- 75.4% less cases per 100k residents than Montana

#39. Judith Basin County
--- 23.2% lower vaccination rate than Montana
- Population over 65 that is fully vaccinated: 51.2% (282 fully vaccinated)
--- 22.7% lower vaccination rate than Montana
- Cumulative deaths per 100k: 50 (1 total deaths)
--- 65.5% less deaths per 100k residents than Montana
- Cumulative cases per 100k: 4,484 (90 total cases)
--- 55.3% less cases per 100k residents than Montana

#38. Gallatin County
--- 22.1% lower vaccination rate than Montana
- Population over 65 that is fully vaccinated: 64.6% (9,712 fully vaccinated)
--- 2.4% lower vaccination rate than Montana
- Cumulative deaths per 100k: 52 (60 total deaths)
--- 64.1% less deaths per 100k residents than Montana
- Cumulative cases per 100k: 12,248 (14,016 total cases)
--- 22.2% more cases per 100k residents than Montana

#37. Teton County
--- 21.8% lower vaccination rate than Montana
- Population over 65 that is fully vaccinated: 54.4% (777 fully vaccinated)
--- 17.8% lower vaccination rate than Montana
- Cumulative deaths per 100k: 81 (5 total deaths)
--- 44.1% less deaths per 100k residents than Montana
- Cumulative cases per 100k: 7,321 (450 total cases)
--- 27.0% less cases per 100k residents than Montana
#36. Powell County
--- 18.6% lower vaccination rate than Montana
- Population over 65 that is fully vaccinated: 57.2% (838 fully vaccinated)
--- 13.6% lower vaccination rate than Montana
- Cumulative deaths per 100k: 145 (10 total deaths)
--- 0.0% less deaths per 100k residents than Montana
- Cumulative cases per 100k: 13,280 (915 total cases)
--- 32.5% more cases per 100k residents than Montana

#35. Liberty County
--- 18.2% lower vaccination rate than Montana
- Population over 65 that is fully vaccinated: 52.5% (271 fully vaccinated)
--- 20.7% lower vaccination rate than Montana
- Cumulative deaths per 100k: 43 (1 total deaths)
--- 70.3% less deaths per 100k residents than Montana
- Cumulative cases per 100k: 5,006 (117 total cases)
--- 50.1% less cases per 100k residents than Montana

#34. Madison County
--- 15.7% lower vaccination rate than Montana
- Population over 65 that is fully vaccinated: 52.4% (1,332 fully vaccinated)
--- 20.8% lower vaccination rate than Montana
- Cumulative deaths per 100k: 93 (8 total deaths)
--- 35.9% less deaths per 100k residents than Montana
- Cumulative cases per 100k: 8,791 (756 total cases)
--- 12.3% less cases per 100k residents than Montana

#33. Sweet Grass County
--- 15.4% lower vaccination rate than Montana
- Population over 65 that is fully vaccinated: 55.3% (567 fully vaccinated)
--- 16.5% lower vaccination rate than Montana
- Cumulative deaths per 100k: 187 (7 total deaths)
--- 29.0% more deaths per 100k residents than Montana
- Cumulative cases per 100k: 10,383 (388 total cases)
--- 3.6% more cases per 100k residents than Montana

#32. Custer County
--- 14.3% lower vaccination rate than Montana
- Population over 65 that is fully vaccinated: 61.4% (1,448 fully vaccinated)
--- 7.3% lower vaccination rate than Montana
- Cumulative deaths per 100k: 158 (18 total deaths)
--- 9.0% more deaths per 100k residents than Montana
- Cumulative cases per 100k: 10,332 (1,178 total cases)
--- 3.1% more cases per 100k residents than Montana

#31. Dawson County
--- 13.6% lower vaccination rate than Montana
- Population over 65 that is fully vaccinated: 60.5% (1,065 fully vaccinated)
--- 8.6% lower vaccination rate than Montana
- Cumulative deaths per 100k: 348 (30 total deaths)
--- 140.0% more deaths per 100k residents than Montana
- Cumulative cases per 100k: 12,795 (1,102 total cases)
--- 27.6% more cases per 100k residents than Montana

#30. Fergus County
--- 13.2% lower vaccination rate than Montana
- Population over 65 that is fully vaccinated: 59.2% (1,649 fully vaccinated)
--- 10.6% lower vaccination rate than Montana
- Cumulative deaths per 100k: 262 (29 total deaths)
--- 80.7% more deaths per 100k residents than Montana
- Cumulative cases per 100k: 9,919 (1,096 total cases)
--- 1.1% less cases per 100k residents than Montana

#29. Valley County
--- 11.1% lower vaccination rate than Montana
- Population over 65 that is fully vaccinated: 56.8% (997 fully vaccinated)
--- 14.2% lower vaccination rate than Montana
- Cumulative deaths per 100k: 243 (18 total deaths)
--- 67.6% more deaths per 100k residents than Montana
- Cumulative cases per 100k: 11,804 (873 total cases)
--- 17.7% more cases per 100k residents than Montana

#28. Stillwater County
--- 10.7% lower vaccination rate than Montana
- Population over 65 that is fully vaccinated: 60.7% (1,377 fully vaccinated)
--- 8.3% lower vaccination rate than Montana
- Cumulative deaths per 100k: 145 (14 total deaths)
--- 0.0% less deaths per 100k residents than Montana
- Cumulative cases per 100k: 7,415 (715 total cases)
--- 26.0% less cases per 100k residents than Montana

#27. Golden Valley County
--- 10.0% lower vaccination rate than Montana
- Population over 65 that is fully vaccinated: 64.0% (146 fully vaccinated)
--- 3.3% lower vaccination rate than Montana
- Cumulative deaths per 100k: 244 (2 total deaths)
--- 68.3% more deaths per 100k residents than Montana
- Cumulative cases per 100k: 6,456 (53 total cases)
--- 35.6% less cases per 100k residents than Montana

#26. Daniels County
--- 8.6% lower vaccination rate than Montana
- Population over 65 that is fully vaccinated: 47.3% (226 fully vaccinated)
--- 28.5% lower vaccination rate than Montana
- Cumulative deaths per 100k: 414 (7 total deaths)
--- 185.5% more deaths per 100k residents than Montana
- Cumulative cases per 100k: 11,657 (197 total cases)
--- 16.3% more cases per 100k residents than Montana

#25. Phillips County
--- 8.6% lower vaccination rate than Montana
- Population over 65 that is fully vaccinated: 59.8% (548 fully vaccinated)
--- 9.7% lower vaccination rate than Montana
- Cumulative deaths per 100k: 405 (16 total deaths)
--- 179.3% more deaths per 100k residents than Montana
- Cumulative cases per 100k: 13,177 (521 total cases)
--- 31.4% more cases per 100k residents than Montana

#24. Prairie County
--- 8.6% lower vaccination rate than Montana
- Population over 65 that is fully vaccinated: 47.6% (172 fully vaccinated)
--- 28.1% lower vaccination rate than Montana
- Cumulative deaths per 100k: 186 (2 total deaths)
--- 28.3% more deaths per 100k residents than Montana
- Cumulative cases per 100k: 13,092 (141 total cases)
--- 30.6% more cases per 100k residents than Montana

#23. Ravalli County
--- 7.9% lower vaccination rate than Montana
- Population over 65 that is fully vaccinated: 56.9% (6,619 fully vaccinated)
--- 14.0% lower vaccination rate than Montana
- Cumulative deaths per 100k: 68 (30 total deaths)
--- 53.1% less deaths per 100k residents than Montana
- Cumulative cases per 100k: 6,766 (2,964 total cases)
--- 32.5% less cases per 100k residents than Montana

#22. Roosevelt County
--- 5.7% lower vaccination rate than Montana
- Population over 65 that is fully vaccinated: 85.8% (1,110 fully vaccinated)
--- 29.6% higher vaccination rate than Montana
- Cumulative deaths per 100k: 473 (52 total deaths)
--- 226.2% more deaths per 100k residents than Montana
- Cumulative cases per 100k: 14,658 (1,613 total cases)
--- 46.2% more cases per 100k residents than Montana

#21. Yellowstone County
--- 4.3% lower vaccination rate than Montana
- Population over 65 that is fully vaccinated: 69.5% (19,512 fully vaccinated)
--- 5.0% higher vaccination rate than Montana
- Cumulative deaths per 100k: 162 (262 total deaths)
--- 11.7% more deaths per 100k residents than Montana
- Cumulative cases per 100k: 10,502 (16,939 total cases)
--- 4.8% more cases per 100k residents than Montana

#20. Jefferson County
--- 4.3% lower vaccination rate than Montana
- Population over 65 that is fully vaccinated: 65.0% (1,767 fully vaccinated)
--- 1.8% lower vaccination rate than Montana
- Cumulative deaths per 100k: 65 (8 total deaths)
--- 55.2% less deaths per 100k residents than Montana
- Cumulative cases per 100k: 8,682 (1,061 total cases)
--- 13.4% less cases per 100k residents than Montana

#19. Carbon County
--- 1.8% lower vaccination rate than Montana
- Population over 65 that is fully vaccinated: 55.7% (1,598 fully vaccinated)
--- 15.9% lower vaccination rate than Montana
- Cumulative deaths per 100k: 131 (14 total deaths)
--- 9.7% less deaths per 100k residents than Montana
- Cumulative cases per 100k: 8,028 (861 total cases)
--- 19.9% less cases per 100k residents than Montana

#18. Cascade County
--- 1.4% lower vaccination rate than Montana
- Population over 65 that is fully vaccinated: 64.4% (10,016 fully vaccinated)
--- 2.7% lower vaccination rate than Montana
- Cumulative deaths per 100k: 204 (166 total deaths)
--- 40.7% more deaths per 100k residents than Montana
- Cumulative cases per 100k: 10,718 (8,721 total cases)
--- 6.9% more cases per 100k residents than Montana

#17. Park County
--- 1.8% higher vaccination rate than Montana
- Population over 65 that is fully vaccinated: 56.9% (2,243 fully vaccinated)
--- 14.0% lower vaccination rate than Montana
- Cumulative deaths per 100k: 108 (18 total deaths)
--- 25.5% less deaths per 100k residents than Montana
- Cumulative cases per 100k: 7,473 (1,241 total cases)
--- 25.5% less cases per 100k residents than Montana

#16. Hill County
--- 4.3% higher vaccination rate than Montana
- Population over 65 that is fully vaccinated: 69.5% (1,752 fully vaccinated)
--- 5.0% higher vaccination rate than Montana
- Cumulative deaths per 100k: 267 (44 total deaths)
--- 84.1% more deaths per 100k residents than Montana
- Cumulative cases per 100k: 11,830 (1,950 total cases)
--- 18.0% more cases per 100k residents than Montana

#15. Pondera County
--- 5.0% higher vaccination rate than Montana
- Population over 65 that is fully vaccinated: 65.5% (797 fully vaccinated)
--- 1.1% lower vaccination rate than Montana
- Cumulative deaths per 100k: 68 (4 total deaths)
--- 53.1% less deaths per 100k residents than Montana
- Cumulative cases per 100k: 7,782 (460 total cases)
--- 22.4% less cases per 100k residents than Montana

#14. Lewis and Clark County
--- 6.8% higher vaccination rate than Montana
- Population over 65 that is fully vaccinated: 72.9% (9,817 fully vaccinated)
--- 10.1% higher vaccination rate than Montana
- Cumulative deaths per 100k: 124 (86 total deaths)
--- 14.5% less deaths per 100k residents than Montana
- Cumulative cases per 100k: 9,628 (6,685 total cases)
--- 4.0% less cases per 100k residents than Montana

#13. Mineral County
--- 7.9% higher vaccination rate than Montana
- Population over 65 that is fully vaccinated: 59.6% (775 fully vaccinated)
--- 10.0% lower vaccination rate than Montana
- Cumulative deaths per 100k: ( total deaths)
--- 100.0% less deaths per 100k residents than Montana
- Cumulative cases per 100k: 5,708 (251 total cases)
--- 43.1% less cases per 100k residents than Montana

#12. Treasure County
--- 8.2% higher vaccination rate than Montana
- Population over 65 that is fully vaccinated: 71.1% (143 fully vaccinated)
--- 7.4% higher vaccination rate than Montana
- Cumulative deaths per 100k: 144 (1 total deaths)
--- 0.7% less deaths per 100k residents than Montana
- Cumulative cases per 100k: 7,902 (55 total cases)
--- 21.2% less cases per 100k residents than Montana

#11. Beaverhead County
--- 9.6% higher vaccination rate than Montana
- Population over 65 that is fully vaccinated: 72.9% (1,537 fully vaccinated)
--- 10.1% higher vaccination rate than Montana
- Cumulative deaths per 100k: 95 (9 total deaths)
--- 34.5% less deaths per 100k residents than Montana
- Cumulative cases per 100k: 9,542 (902 total cases)
--- 4.8% less cases per 100k residents than Montana

#10. Sheridan County
--- 11.8% higher vaccination rate than Montana
- Population over 65 that is fully vaccinated: 74.7% (575 fully vaccinated)
--- 12.8% higher vaccination rate than Montana
- Cumulative deaths per 100k: 151 (5 total deaths)
--- 4.1% more deaths per 100k residents than Montana
- Cumulative cases per 100k: 12,723 (421 total cases)
--- 26.9% more cases per 100k residents than Montana

#9. Missoula County
--- 16.4% higher vaccination rate than Montana
- Population over 65 that is fully vaccinated: 74.5% (14,415 fully vaccinated)
--- 12.5% higher vaccination rate than Montana
- Cumulative deaths per 100k: 77 (92 total deaths)
--- 46.9% less deaths per 100k residents than Montana
- Cumulative cases per 100k: 7,446 (8,905 total cases)
--- 25.7% less cases per 100k residents than Montana
#8. Meagher County
--- 18.9% higher vaccination rate than Montana
- Population over 65 that is fully vaccinated: 52.8% (311 fully vaccinated)
--- 20.2% lower vaccination rate than Montana
- Cumulative deaths per 100k: 376 (7 total deaths)
--- 159.3% more deaths per 100k residents than Montana
- Cumulative cases per 100k: 7,358 (137 total cases)
--- 26.6% less cases per 100k residents than Montana

#7. Lake County
--- 20.0% higher vaccination rate than Montana
- Population over 65 that is fully vaccinated: 75.9% (5,234 fully vaccinated)
--- 14.7% higher vaccination rate than Montana
- Cumulative deaths per 100k: 118 (36 total deaths)
--- 18.6% less deaths per 100k residents than Montana
- Cumulative cases per 100k: 6,583 (2,005 total cases)
--- 34.3% less cases per 100k residents than Montana

#6. Deer Lodge County
--- 22.5% higher vaccination rate than Montana
- Population over 65 that is fully vaccinated: 72.2% (1,619 fully vaccinated)
--- 9.1% higher vaccination rate than Montana
- Cumulative deaths per 100k: 164 (15 total deaths)
--- 13.1% more deaths per 100k residents than Montana
- Cumulative cases per 100k: 11,849 (1,083 total cases)
--- 18.2% more cases per 100k residents than Montana
#5. Silver Bow County
--- 23.6% higher vaccination rate than Montana
- Population over 65 that is fully vaccinated: 74.3% (5,061 fully vaccinated)
--- 12.2% higher vaccination rate than Montana
- Cumulative deaths per 100k: 235 (82 total deaths)
--- 62.1% more deaths per 100k residents than Montana
- Cumulative cases per 100k: 11,568 (4,039 total cases)
--- 15.4% more cases per 100k residents than Montana
#4. Big Horn County
--- 49.3% higher vaccination rate than Montana
- Population over 65 that is fully vaccinated: 90.5% (1,606 fully vaccinated)
--- 36.7% higher vaccination rate than Montana
- Cumulative deaths per 100k: 563 (75 total deaths)
--- 288.3% more deaths per 100k residents than Montana
- Cumulative cases per 100k: 18,935 (2,522 total cases)
--- 88.9% more cases per 100k residents than Montana

#3. Rosebud County
--- 58.6% higher vaccination rate than Montana
- Population over 65 that is fully vaccinated: 86.6% (1,275 fully vaccinated)
--- 30.8% higher vaccination rate than Montana
- Cumulative deaths per 100k: 537 (48 total deaths)
--- 270.3% more deaths per 100k residents than Montana
- Cumulative cases per 100k: 13,360 (1,194 total cases)
--- 33.3% more cases per 100k residents than Montana

#2. Glacier County
--- 74.3% higher vaccination rate than Montana
- Population over 65 that is fully vaccinated: 99.9% (2,222 fully vaccinated)
--- 50.9% higher vaccination rate than Montana
- Cumulative deaths per 100k: 305 (42 total deaths)
--- 110.3% more deaths per 100k residents than Montana
- Cumulative cases per 100k: 11,118 (1,529 total cases)
--- 10.9% more cases per 100k residents than Montana

#1. Blaine County
--- 75.4% higher vaccination rate than Montana
- Population over 65 that is fully vaccinated: 88.7% (938 fully vaccinated)
--- 34.0% higher vaccination rate than Montana
- Cumulative deaths per 100k: 344 (23 total deaths)
--- 137.2% more deaths per 100k residents than Montana
- Cumulative cases per 100k: 10,912 (729 total cases)
--- 8.8% more cases per 100k residents than Montana


