
Counties with the highest COVID-19 vaccination rate in North Dakota
Counties with the highest COVID-19 vaccination rate in North Dakota
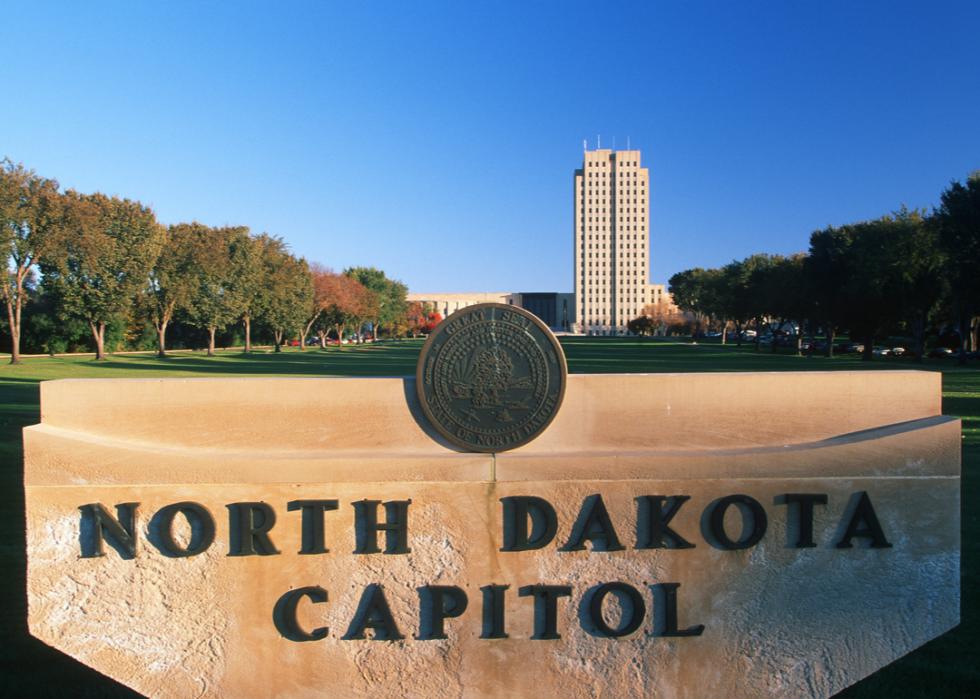
As has been true throughout America’s COVID-19 history, every state—and every county threin—has its own COVID-19 story, driven by local policies and behaviors. The United States as of April 20 had reached 568,439 COVID-19-related deaths and more than 31.8 million COVID-19 cases, according to Johns Hopkins University. Amid the grim numbers come two bright spots: As of Feb. 2, more Americans had been vaccinated for COVID-19 than had been infected; and since then, rolling averages for case counts and deaths have been on the decline.
Stacker compiled a list of the counties with highest COVID-19 vaccination rates in North Dakota using data from the U.S. Department of Health & Human Services. Counties are ranked by the highest vaccination rate as of April 19, 2021. In North Dakota, 29.8% of the total population has been fully vaccinated, compared to 25.6% nationwide. Keep reading to see whether your county ranks among the highest COVID-19 vaccination rates in your state.
#50. Grant County
--- 64.4% lower vaccination rate than North Dakota
- Population over 65 that is fully vaccinated: 23.6% (164 fully vaccinated)
--- 66.0% lower vaccination rate than North Dakota
- Cumulative deaths per 100k: 308 (7 total deaths)
--- 58.8% more deaths per 100k residents than North Dakota
- Cumulative cases per 100k: 8,619 (196 total cases)
--- 37.9% less cases per 100k residents than North Dakota
#49. Dunn County
--- 59.7% lower vaccination rate than North Dakota
- Population over 65 that is fully vaccinated: 41.9% (299 fully vaccinated)
--- 39.6% lower vaccination rate than North Dakota
- Cumulative deaths per 100k: 158 (7 total deaths)
--- 18.6% less deaths per 100k residents than North Dakota
- Cumulative cases per 100k: 8,454 (374 total cases)
--- 39.1% less cases per 100k residents than North Dakota

#48. Williams County
--- 55.0% lower vaccination rate than North Dakota
- Population over 65 that is fully vaccinated: 58.4% (2,020 fully vaccinated)
--- 15.9% lower vaccination rate than North Dakota
- Cumulative deaths per 100k: 101 (38 total deaths)
--- 47.9% less deaths per 100k residents than North Dakota
- Cumulative cases per 100k: 12,392 (4,658 total cases)
--- 10.7% less cases per 100k residents than North Dakota

#47. Oliver County
--- 49.3% lower vaccination rate than North Dakota
- Population over 65 that is fully vaccinated: 42.8% (190 fully vaccinated)
--- 38.3% lower vaccination rate than North Dakota
- Cumulative deaths per 100k: 153 (3 total deaths)
--- 21.1% less deaths per 100k residents than North Dakota
- Cumulative cases per 100k: 7,912 (155 total cases)
--- 43.0% less cases per 100k residents than North Dakota
#46. Sioux County
--- 45.3% lower vaccination rate than North Dakota
- Population over 65 that is fully vaccinated: 56.5% (203 fully vaccinated)
--- 18.6% lower vaccination rate than North Dakota
- Cumulative deaths per 100k: 260 (11 total deaths)
--- 34.0% more deaths per 100k residents than North Dakota
- Cumulative cases per 100k: 15,319 (648 total cases)
--- 10.3% more cases per 100k residents than North Dakota

#45. Golden Valley County
--- 41.6% lower vaccination rate than North Dakota
- Population over 65 that is fully vaccinated: 39.9% (180 fully vaccinated)
--- 42.5% lower vaccination rate than North Dakota
- Cumulative deaths per 100k: 170 (3 total deaths)
--- 12.4% less deaths per 100k residents than North Dakota
- Cumulative cases per 100k: 14,537 (256 total cases)
--- 4.7% more cases per 100k residents than North Dakota

#44. Stark County
--- 36.6% lower vaccination rate than North Dakota
- Population over 65 that is fully vaccinated: 58.8% (2,569 fully vaccinated)
--- 15.3% lower vaccination rate than North Dakota
- Cumulative deaths per 100k: 162 (51 total deaths)
--- 16.5% less deaths per 100k residents than North Dakota
- Cumulative cases per 100k: 14,707 (4,631 total cases)
--- 5.9% more cases per 100k residents than North Dakota

#43. Kidder County
--- 35.2% lower vaccination rate than North Dakota
- Population over 65 that is fully vaccinated: 43.9% (277 fully vaccinated)
--- 36.7% lower vaccination rate than North Dakota
- Cumulative deaths per 100k: 403 (10 total deaths)
--- 107.7% more deaths per 100k residents than North Dakota
- Cumulative cases per 100k: 10,565 (262 total cases)
--- 23.9% less cases per 100k residents than North Dakota
#42. Benson County
--- 30.2% lower vaccination rate than North Dakota
- Population over 65 that is fully vaccinated: 61.7% (607 fully vaccinated)
--- 11.1% lower vaccination rate than North Dakota
- Cumulative deaths per 100k: 263 (18 total deaths)
--- 35.6% more deaths per 100k residents than North Dakota
- Cumulative cases per 100k: 15,325 (1,047 total cases)
--- 10.4% more cases per 100k residents than North Dakota
#41. Emmons County
--- 29.9% lower vaccination rate than North Dakota
- Population over 65 that is fully vaccinated: 47.4% (432 fully vaccinated)
--- 31.7% lower vaccination rate than North Dakota
- Cumulative deaths per 100k: 401 (13 total deaths)
--- 106.7% more deaths per 100k residents than North Dakota
- Cumulative cases per 100k: 12,650 (410 total cases)
--- 8.9% less cases per 100k residents than North Dakota

#40. Logan County
--- 29.2% lower vaccination rate than North Dakota
- Population over 65 that is fully vaccinated: 51.4% (253 fully vaccinated)
--- 25.9% lower vaccination rate than North Dakota
- Cumulative deaths per 100k: 432 (8 total deaths)
--- 122.7% more deaths per 100k residents than North Dakota
- Cumulative cases per 100k: 13,189 (244 total cases)
--- 5.0% less cases per 100k residents than North Dakota

#39. Burke County
--- 27.2% lower vaccination rate than North Dakota
- Population over 65 that is fully vaccinated: 61.0% (274 fully vaccinated)
--- 12.1% lower vaccination rate than North Dakota
- Cumulative deaths per 100k: 47 (1 total deaths)
--- 75.8% less deaths per 100k residents than North Dakota
- Cumulative cases per 100k: 11,017 (233 total cases)
--- 20.6% less cases per 100k residents than North Dakota

#38. Mountrail County
--- 26.8% lower vaccination rate than North Dakota
- Population over 65 that is fully vaccinated: 60.7% (744 fully vaccinated)
--- 12.5% lower vaccination rate than North Dakota
- Cumulative deaths per 100k: 161 (17 total deaths)
--- 17.0% less deaths per 100k residents than North Dakota
- Cumulative cases per 100k: 12,347 (1,302 total cases)
--- 11.1% less cases per 100k residents than North Dakota

#37. Renville County
--- 25.2% lower vaccination rate than North Dakota
- Population over 65 that is fully vaccinated: 61.9% (299 fully vaccinated)
--- 10.8% lower vaccination rate than North Dakota
- Cumulative deaths per 100k: 602 (14 total deaths)
--- 210.3% more deaths per 100k residents than North Dakota
- Cumulative cases per 100k: 13,666 (318 total cases)
--- 1.6% less cases per 100k residents than North Dakota

#36. Bowman County
--- 24.5% lower vaccination rate than North Dakota
- Population over 65 that is fully vaccinated: 63.6% (427 fully vaccinated)
--- 8.4% lower vaccination rate than North Dakota
- Cumulative deaths per 100k: 165 (5 total deaths)
--- 14.9% less deaths per 100k residents than North Dakota
- Cumulative cases per 100k: 13,194 (399 total cases)
--- 5.0% less cases per 100k residents than North Dakota

#35. Mercer County
--- 21.1% lower vaccination rate than North Dakota
- Population over 65 that is fully vaccinated: 61.9% (1,017 fully vaccinated)
--- 10.8% lower vaccination rate than North Dakota
- Cumulative deaths per 100k: 122 (10 total deaths)
--- 37.1% less deaths per 100k residents than North Dakota
- Cumulative cases per 100k: 13,497 (1,105 total cases)
--- 2.8% less cases per 100k residents than North Dakota
#34. Hettinger County
--- 20.1% lower vaccination rate than North Dakota
- Population over 65 that is fully vaccinated: 66.4% (366 fully vaccinated)
--- 4.3% lower vaccination rate than North Dakota
- Cumulative deaths per 100k: 160 (4 total deaths)
--- 17.5% less deaths per 100k residents than North Dakota
- Cumulative cases per 100k: 12,965 (324 total cases)
--- 6.6% less cases per 100k residents than North Dakota
#33. Morton County
--- 19.1% lower vaccination rate than North Dakota
- Population over 65 that is fully vaccinated: 63.8% (3,394 fully vaccinated)
--- 8.1% lower vaccination rate than North Dakota
- Cumulative deaths per 100k: 312 (98 total deaths)
--- 60.8% more deaths per 100k residents than North Dakota
- Cumulative cases per 100k: 16,328 (5,121 total cases)
--- 17.6% more cases per 100k residents than North Dakota
#32. Ward County
--- 17.8% lower vaccination rate than North Dakota
- Population over 65 that is fully vaccinated: 67.2% (5,994 fully vaccinated)
--- 3.2% lower vaccination rate than North Dakota
- Cumulative deaths per 100k: 287 (194 total deaths)
--- 47.9% more deaths per 100k residents than North Dakota
- Cumulative cases per 100k: 14,020 (9,483 total cases)
--- 1.0% more cases per 100k residents than North Dakota

#31. McHenry County
--- 16.4% lower vaccination rate than North Dakota
- Population over 65 that is fully vaccinated: 66.8% (803 fully vaccinated)
--- 3.7% lower vaccination rate than North Dakota
- Cumulative deaths per 100k: 383 (22 total deaths)
--- 97.4% more deaths per 100k residents than North Dakota
- Cumulative cases per 100k: 11,001 (632 total cases)
--- 20.8% less cases per 100k residents than North Dakota
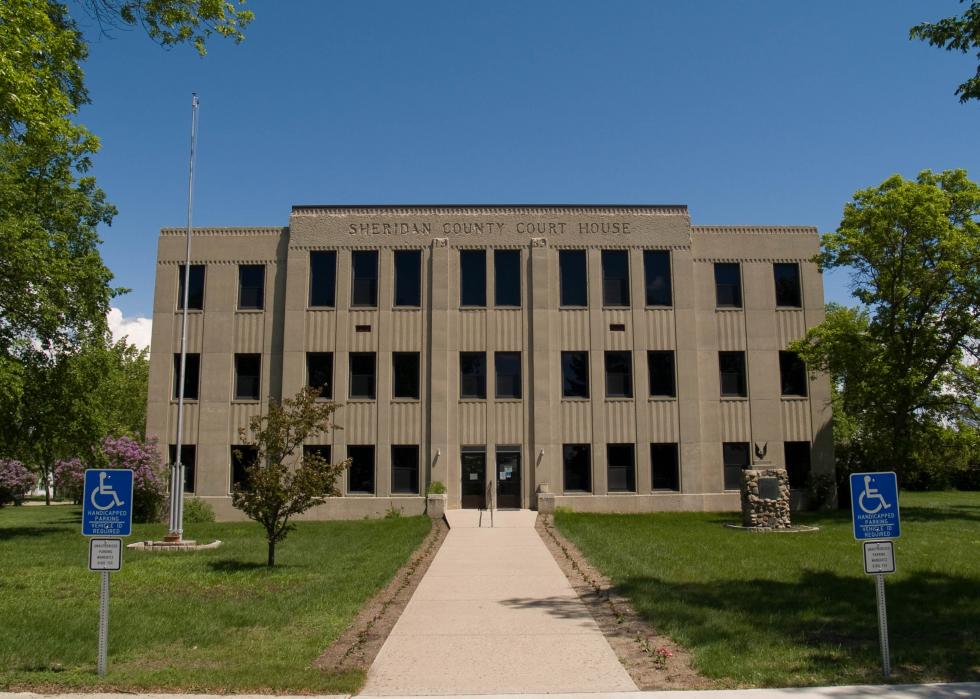
#30. Sheridan County
--- 15.1% lower vaccination rate than North Dakota
- Population over 65 that is fully vaccinated: 46.2% (207 fully vaccinated)
--- 33.4% lower vaccination rate than North Dakota
- Cumulative deaths per 100k: 152 (2 total deaths)
--- 21.6% less deaths per 100k residents than North Dakota
- Cumulative cases per 100k: 8,745 (115 total cases)
--- 37.0% less cases per 100k residents than North Dakota
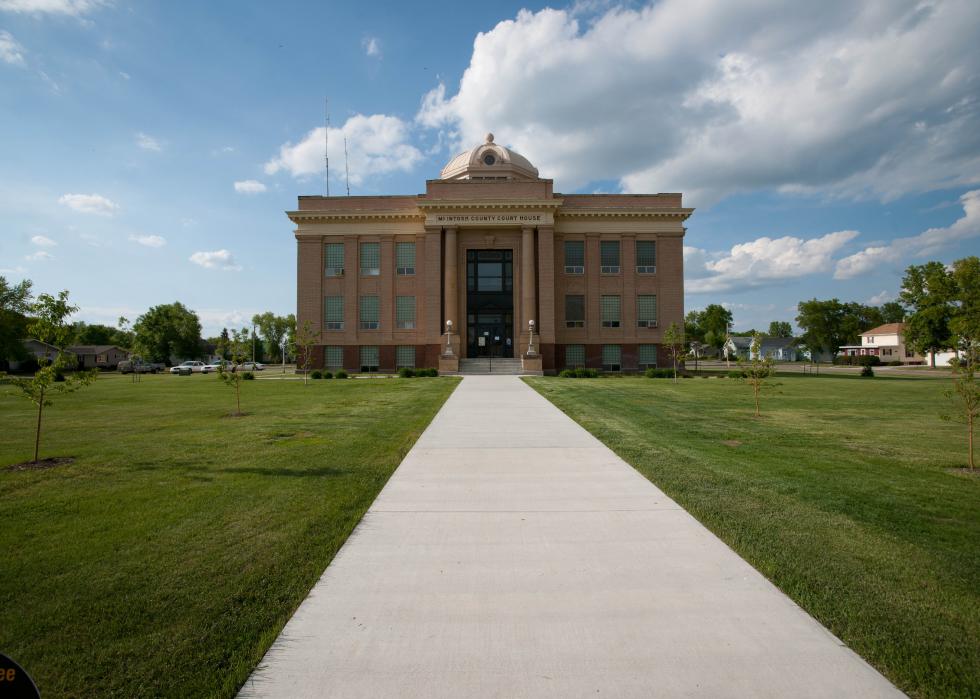
#29. McIntosh County
--- 10.4% lower vaccination rate than North Dakota
- Population over 65 that is fully vaccinated: 51.4% (413 fully vaccinated)
--- 25.9% lower vaccination rate than North Dakota
- Cumulative deaths per 100k: 280 (7 total deaths)
--- 44.3% more deaths per 100k residents than North Dakota
- Cumulative cases per 100k: 13,216 (330 total cases)
--- 4.8% less cases per 100k residents than North Dakota
#28. Divide County
--- 10.1% lower vaccination rate than North Dakota
- Population over 65 that is fully vaccinated: 52.4% (301 fully vaccinated)
--- 24.5% lower vaccination rate than North Dakota
- Cumulative deaths per 100k: 88 (2 total deaths)
--- 54.6% less deaths per 100k residents than North Dakota
- Cumulative cases per 100k: 7,641 (173 total cases)
--- 45.0% less cases per 100k residents than North Dakota

#27. McLean County
--- 9.1% lower vaccination rate than North Dakota
- Population over 65 that is fully vaccinated: 59.4% (1,361 fully vaccinated)
--- 14.4% lower vaccination rate than North Dakota
- Cumulative deaths per 100k: 317 (30 total deaths)
--- 63.4% more deaths per 100k residents than North Dakota
- Cumulative cases per 100k: 13,259 (1,253 total cases)
--- 4.5% less cases per 100k residents than North Dakota
#26. Burleigh County
--- 7.7% lower vaccination rate than North Dakota
- Population over 65 that is fully vaccinated: 65.9% (10,451 fully vaccinated)
--- 5.0% lower vaccination rate than North Dakota
- Cumulative deaths per 100k: 198 (189 total deaths)
--- 2.1% more deaths per 100k residents than North Dakota
- Cumulative cases per 100k: 15,956 (15,258 total cases)
--- 14.9% more cases per 100k residents than North Dakota

#25. Wells County
--- 7.0% lower vaccination rate than North Dakota
- Population over 65 that is fully vaccinated: 54.2% (597 fully vaccinated)
--- 21.9% lower vaccination rate than North Dakota
- Cumulative deaths per 100k: 209 (8 total deaths)
--- 7.7% more deaths per 100k residents than North Dakota
- Cumulative cases per 100k: 11,502 (441 total cases)
--- 17.2% less cases per 100k residents than North Dakota
#24. Pierce County
--- 1.7% higher vaccination rate than North Dakota
- Population over 65 that is fully vaccinated: 65.8% (622 fully vaccinated)
--- 5.2% lower vaccination rate than North Dakota
- Cumulative deaths per 100k: 629 (25 total deaths)
--- 224.2% more deaths per 100k residents than North Dakota
- Cumulative cases per 100k: 13,409 (533 total cases)
--- 3.4% less cases per 100k residents than North Dakota
#23. Walsh County
--- 5.0% higher vaccination rate than North Dakota
- Population over 65 that is fully vaccinated: 68.4% (1,567 fully vaccinated)
--- 1.4% lower vaccination rate than North Dakota
- Cumulative deaths per 100k: 226 (24 total deaths)
--- 16.5% more deaths per 100k residents than North Dakota
- Cumulative cases per 100k: 17,423 (1,854 total cases)
--- 25.5% more cases per 100k residents than North Dakota

#22. Traill County
--- 6.4% higher vaccination rate than North Dakota
- Population over 65 that is fully vaccinated: 66.3% (1,064 fully vaccinated)
--- 4.5% lower vaccination rate than North Dakota
- Cumulative deaths per 100k: 224 (18 total deaths)
--- 15.5% more deaths per 100k residents than North Dakota
- Cumulative cases per 100k: 12,842 (1,032 total cases)
--- 7.5% less cases per 100k residents than North Dakota

#21. LaMoure County
--- 6.4% higher vaccination rate than North Dakota
- Population over 65 that is fully vaccinated: 62.0% (690 fully vaccinated)
--- 10.7% lower vaccination rate than North Dakota
- Cumulative deaths per 100k: 420 (17 total deaths)
--- 116.5% more deaths per 100k residents than North Dakota
- Cumulative cases per 100k: 12,803 (518 total cases)
--- 7.8% less cases per 100k residents than North Dakota
#20. Grand Forks County
--- 7.0% higher vaccination rate than North Dakota
- Population over 65 that is fully vaccinated: 73.6% (6,810 fully vaccinated)
--- 6.1% higher vaccination rate than North Dakota
- Cumulative deaths per 100k: 111 (77 total deaths)
--- 42.8% less deaths per 100k residents than North Dakota
- Cumulative cases per 100k: 14,914 (10,358 total cases)
--- 7.4% more cases per 100k residents than North Dakota

#19. Richland County
--- 7.4% higher vaccination rate than North Dakota
- Population over 65 that is fully vaccinated: 71.0% (2,146 fully vaccinated)
--- 2.3% higher vaccination rate than North Dakota
- Cumulative deaths per 100k: 105 (17 total deaths)
--- 45.9% less deaths per 100k residents than North Dakota
- Cumulative cases per 100k: 12,104 (1,958 total cases)
--- 12.8% less cases per 100k residents than North Dakota

#18. Stutsman County
--- 8.1% higher vaccination rate than North Dakota
- Population over 65 that is fully vaccinated: 66.0% (2,725 fully vaccinated)
--- 4.9% lower vaccination rate than North Dakota
- Cumulative deaths per 100k: 386 (80 total deaths)
--- 99.0% more deaths per 100k residents than North Dakota
- Cumulative cases per 100k: 16,499 (3,416 total cases)
--- 18.8% more cases per 100k residents than North Dakota

#17. Adams County
--- 9.1% higher vaccination rate than North Dakota
- Population over 65 that is fully vaccinated: 63.0% (398 fully vaccinated)
--- 9.2% lower vaccination rate than North Dakota
- Cumulative deaths per 100k: 135 (3 total deaths)
--- 30.4% less deaths per 100k residents than North Dakota
- Cumulative cases per 100k: 12,139 (269 total cases)
--- 12.6% less cases per 100k residents than North Dakota

#16. Steele County
--- 11.4% higher vaccination rate than North Dakota
- Population over 65 that is fully vaccinated: 61.3% (292 fully vaccinated)
--- 11.7% lower vaccination rate than North Dakota
- Cumulative deaths per 100k: 106 (2 total deaths)
--- 45.4% less deaths per 100k residents than North Dakota
- Cumulative cases per 100k: 9,524 (180 total cases)
--- 31.4% less cases per 100k residents than North Dakota
#15. Towner County
--- 11.7% higher vaccination rate than North Dakota
- Population over 65 that is fully vaccinated: 60.9% (337 fully vaccinated)
--- 12.2% lower vaccination rate than North Dakota
- Cumulative deaths per 100k: 503 (11 total deaths)
--- 159.3% more deaths per 100k residents than North Dakota
- Cumulative cases per 100k: 14,207 (311 total cases)
--- 2.3% more cases per 100k residents than North Dakota

#14. Pembina County
--- 13.8% higher vaccination rate than North Dakota
- Population over 65 that is fully vaccinated: 71.9% (1,166 fully vaccinated)
--- 3.6% higher vaccination rate than North Dakota
- Cumulative deaths per 100k: 162 (11 total deaths)
--- 16.5% less deaths per 100k residents than North Dakota
- Cumulative cases per 100k: 11,763 (800 total cases)
--- 15.3% less cases per 100k residents than North Dakota

#13. Bottineau County
--- 14.8% higher vaccination rate than North Dakota
- Population over 65 that is fully vaccinated: 73.8% (1,137 fully vaccinated)
--- 6.3% higher vaccination rate than North Dakota
- Cumulative deaths per 100k: 318 (20 total deaths)
--- 63.9% more deaths per 100k residents than North Dakota
- Cumulative cases per 100k: 11,270 (708 total cases)
--- 18.8% less cases per 100k residents than North Dakota

#12. Cass County
--- 15.1% higher vaccination rate than North Dakota
- Population over 65 that is fully vaccinated: 75.2% (17,056 fully vaccinated)
--- 8.4% higher vaccination rate than North Dakota
- Cumulative deaths per 100k: 110 (200 total deaths)
--- 43.3% less deaths per 100k residents than North Dakota
- Cumulative cases per 100k: 13,079 (23,794 total cases)
--- 5.8% less cases per 100k residents than North Dakota

#11. Dickey County
--- 15.1% higher vaccination rate than North Dakota
- Population over 65 that is fully vaccinated: 79.4% (801 fully vaccinated)
--- 14.4% higher vaccination rate than North Dakota
- Cumulative deaths per 100k: 657 (32 total deaths)
--- 238.7% more deaths per 100k residents than North Dakota
- Cumulative cases per 100k: 15,907 (775 total cases)
--- 14.6% more cases per 100k residents than North Dakota

#10. Griggs County
--- 19.8% higher vaccination rate than North Dakota
- Population over 65 that is fully vaccinated: 62.9% (425 fully vaccinated)
--- 9.4% lower vaccination rate than North Dakota
- Cumulative deaths per 100k: 90 (2 total deaths)
--- 53.6% less deaths per 100k residents than North Dakota
- Cumulative cases per 100k: 13,985 (312 total cases)
--- 0.7% more cases per 100k residents than North Dakota
#9. Barnes County
--- 21.8% higher vaccination rate than North Dakota
- Population over 65 that is fully vaccinated: 69.8% (1,688 fully vaccinated)
--- 0.6% higher vaccination rate than North Dakota
- Cumulative deaths per 100k: 298 (31 total deaths)
--- 53.6% more deaths per 100k residents than North Dakota
- Cumulative cases per 100k: 13,087 (1,363 total cases)
--- 5.7% less cases per 100k residents than North Dakota

#8. Eddy County
--- 22.5% higher vaccination rate than North Dakota
- Population over 65 that is fully vaccinated: 73.6% (398 fully vaccinated)
--- 6.1% higher vaccination rate than North Dakota
- Cumulative deaths per 100k: 262 (6 total deaths)
--- 35.1% more deaths per 100k residents than North Dakota
- Cumulative cases per 100k: 20,289 (464 total cases)
--- 46.1% more cases per 100k residents than North Dakota

#7. Foster County
--- 23.5% higher vaccination rate than North Dakota
- Population over 65 that is fully vaccinated: 69.9% (508 fully vaccinated)
--- 0.7% higher vaccination rate than North Dakota
- Cumulative deaths per 100k: 592 (19 total deaths)
--- 205.2% more deaths per 100k residents than North Dakota
- Cumulative cases per 100k: 17,944 (576 total cases)
--- 29.2% more cases per 100k residents than North Dakota

#6. Sargent County
--- 24.5% higher vaccination rate than North Dakota
- Population over 65 that is fully vaccinated: 77.7% (686 fully vaccinated)
--- 12.0% higher vaccination rate than North Dakota
- Cumulative deaths per 100k: 154 (6 total deaths)
--- 20.6% less deaths per 100k residents than North Dakota
- Cumulative cases per 100k: 12,109 (472 total cases)
--- 12.8% less cases per 100k residents than North Dakota
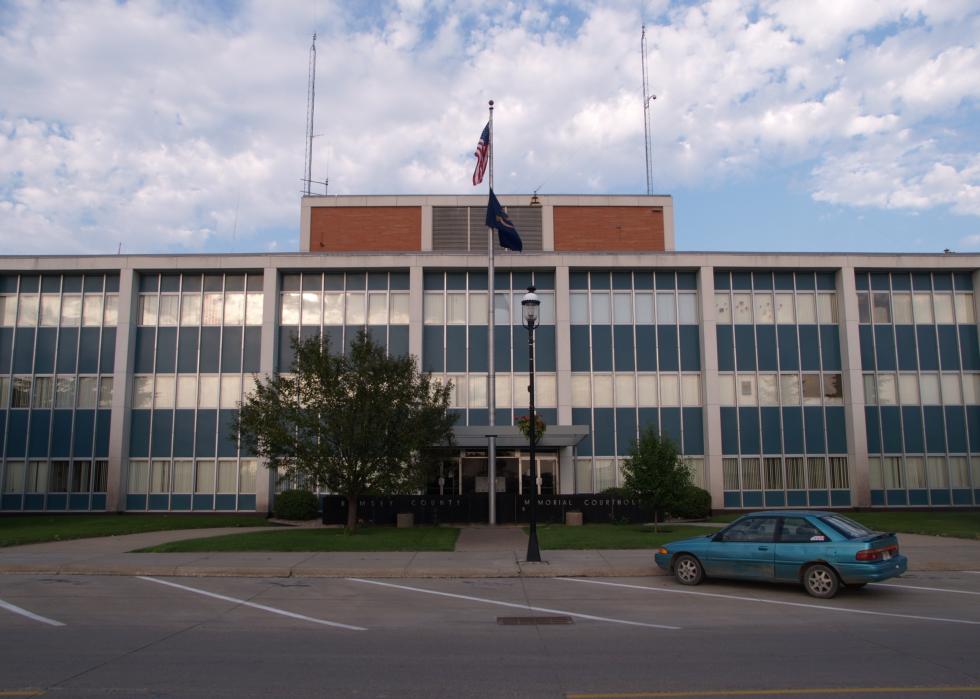
#5. Ramsey County
--- 25.2% higher vaccination rate than North Dakota
- Population over 65 that is fully vaccinated: 75.6% (1,767 fully vaccinated)
--- 8.9% higher vaccination rate than North Dakota
- Cumulative deaths per 100k: 260 (30 total deaths)
--- 34.0% more deaths per 100k residents than North Dakota
- Cumulative cases per 100k: 14,611 (1,683 total cases)
--- 5.2% more cases per 100k residents than North Dakota

#4. Ransom County
--- 26.8% higher vaccination rate than North Dakota
- Population over 65 that is fully vaccinated: 86.1% (953 fully vaccinated)
--- 24.1% higher vaccination rate than North Dakota
- Cumulative deaths per 100k: 326 (17 total deaths)
--- 68.0% more deaths per 100k residents than North Dakota
- Cumulative cases per 100k: 12,649 (660 total cases)
--- 8.9% less cases per 100k residents than North Dakota
#3. Rolette County
--- 37.6% higher vaccination rate than North Dakota
- Population over 65 that is fully vaccinated: 76.9% (1,331 fully vaccinated)
--- 10.8% higher vaccination rate than North Dakota
- Cumulative deaths per 100k: 198 (28 total deaths)
--- 2.1% more deaths per 100k residents than North Dakota
- Cumulative cases per 100k: 15,068 (2,136 total cases)
--- 8.5% more cases per 100k residents than North Dakota

#2. Cavalier County
--- 40.6% higher vaccination rate than North Dakota
- Population over 65 that is fully vaccinated: 71.3% (735 fully vaccinated)
--- 2.7% higher vaccination rate than North Dakota
- Cumulative deaths per 100k: 133 (5 total deaths)
--- 31.4% less deaths per 100k residents than North Dakota
- Cumulative cases per 100k: 11,350 (427 total cases)
--- 18.3% less cases per 100k residents than North Dakota
#1. Nelson County
--- 67.4% higher vaccination rate than North Dakota
- Population over 65 that is fully vaccinated: 93.3% (713 fully vaccinated)
--- 34.4% higher vaccination rate than North Dakota
- Cumulative deaths per 100k: 486 (14 total deaths)
--- 150.5% more deaths per 100k residents than North Dakota
- Cumulative cases per 100k: 16,325 (470 total cases)
--- 17.6% more cases per 100k residents than North Dakota


