
Counties with the highest COVID-19 vaccination rate in Virginia
Counties with the highest COVID-19 vaccination rate in Virginia
As has been true throughout America’s COVID-19 history, every state—and every county threin—has its own COVID-19 story, driven by local policies and behaviors. The United States as of April 20 had reached 568,439 COVID-19-related deaths and more than 31.8 million COVID-19 cases, according to Johns Hopkins University. Amid the grim numbers come two bright spots: As of Feb. 2, more Americans had been vaccinated for COVID-19 than had been infected; and since then, rolling averages for case counts and deaths have been on the decline.
Stacker compiled a list of the counties with highest COVID-19 vaccination rates in Virginia using data from the U.S. Department of Health & Human Services. Counties are ranked by the highest vaccination rate as of April 19, 2021. In Virginia, 27.0% of the total population has been fully vaccinated, compared to 25.6% nationwide. Keep reading to see whether your county ranks among the highest COVID-19 vaccination rates in your state.

#50. Montgomery County
--- 52.6% lower vaccination rate than Virginia
- Population over 65 that is fully vaccinated: 31.6% (4,111 fully vaccinated)
--- 52.4% lower vaccination rate than Virginia
- Cumulative deaths per 100k: 89 (88 total deaths)
--- 28.2% less deaths per 100k residents than Virginia
- Cumulative cases per 100k: 9,250 (9,114 total cases)
--- 22.0% more cases per 100k residents than Virginia

#49. Newport News city
--- 52.2% lower vaccination rate than Virginia
- Population over 65 that is fully vaccinated: 39.0% (9,313 fully vaccinated)
--- 41.3% lower vaccination rate than Virginia
- Cumulative deaths per 100k: 122 (219 total deaths)
--- 1.6% less deaths per 100k residents than Virginia
- Cumulative cases per 100k: 7,484 (13,414 total cases)
--- 1.3% less cases per 100k residents than Virginia
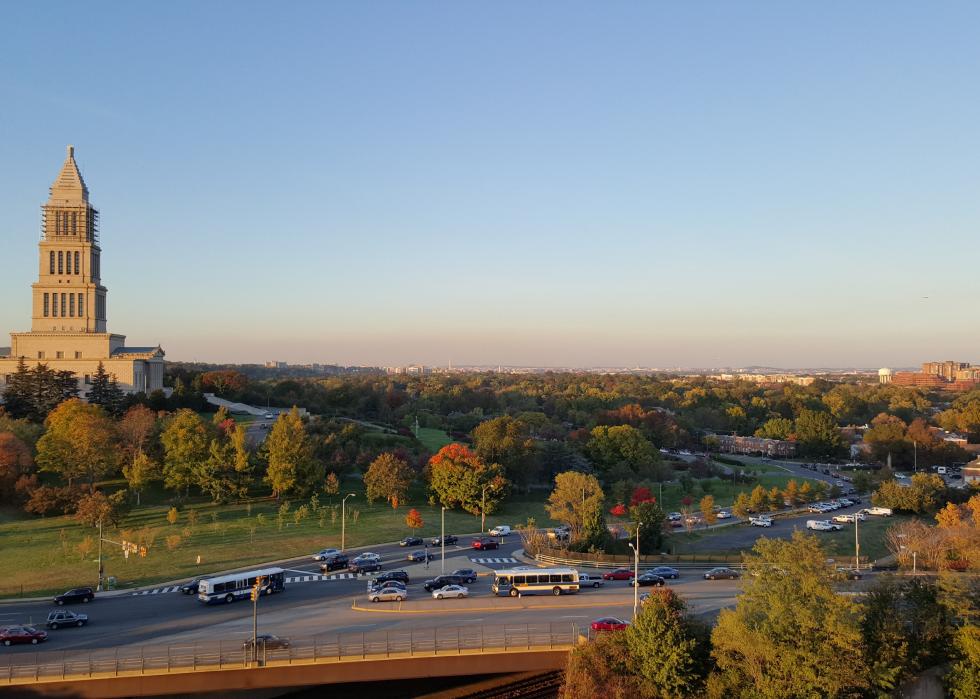
#48. Alexandria city
--- 52.2% lower vaccination rate than Virginia
- Population over 65 that is fully vaccinated: 30.7% (5,963 fully vaccinated)
--- 53.8% lower vaccination rate than Virginia
- Cumulative deaths per 100k: 83 (132 total deaths)
--- 33.1% less deaths per 100k residents than Virginia
- Cumulative cases per 100k: 7,189 (11,461 total cases)
--- 5.2% less cases per 100k residents than Virginia

#47. Franklin County
--- 52.2% lower vaccination rate than Virginia
- Population over 65 that is fully vaccinated: 28.8% (3,901 fully vaccinated)
--- 56.6% lower vaccination rate than Virginia
- Cumulative deaths per 100k: 132 (74 total deaths)
--- 6.5% more deaths per 100k residents than Virginia
- Cumulative cases per 100k: 7,041 (3,946 total cases)
--- 7.1% less cases per 100k residents than Virginia

#46. Grayson County
--- 51.9% lower vaccination rate than Virginia
- Population over 65 that is fully vaccinated: 23.9% (941 fully vaccinated)
--- 64.0% lower vaccination rate than Virginia
- Cumulative deaths per 100k: 212 (33 total deaths)
--- 71.0% more deaths per 100k residents than Virginia
- Cumulative cases per 100k: 8,920 (1,387 total cases)
--- 17.7% more cases per 100k residents than Virginia

#45. King and Queen County
--- 51.1% lower vaccination rate than Virginia
- Population over 65 that is fully vaccinated: 30.4% (505 fully vaccinated)
--- 54.2% lower vaccination rate than Virginia
- Cumulative deaths per 100k: 114 (8 total deaths)
--- 8.1% less deaths per 100k residents than Virginia
- Cumulative cases per 100k: 5,466 (384 total cases)
--- 27.9% less cases per 100k residents than Virginia

#44. Augusta County
--- 50.4% lower vaccination rate than Virginia
- Population over 65 that is fully vaccinated: 29.5% (4,882 fully vaccinated)
--- 55.6% lower vaccination rate than Virginia
- Cumulative deaths per 100k: 91 (69 total deaths)
--- 26.6% less deaths per 100k residents than Virginia
- Cumulative cases per 100k: 7,442 (5,623 total cases)
--- 1.8% less cases per 100k residents than Virginia

#43. Rappahannock County
--- 49.6% lower vaccination rate than Virginia
- Population over 65 that is fully vaccinated: 28.2% (578 fully vaccinated)
--- 57.5% lower vaccination rate than Virginia
- Cumulative deaths per 100k: 27 (2 total deaths)
--- 78.2% less deaths per 100k residents than Virginia
- Cumulative cases per 100k: 4,505 (332 total cases)
--- 40.6% less cases per 100k residents than Virginia

#42. Patrick County
--- 49.3% lower vaccination rate than Virginia
- Population over 65 that is fully vaccinated: 28.6% (1,351 fully vaccinated)
--- 56.9% lower vaccination rate than Virginia
- Cumulative deaths per 100k: 239 (42 total deaths)
--- 92.7% more deaths per 100k residents than Virginia
- Cumulative cases per 100k: 7,445 (1,311 total cases)
--- 1.8% less cases per 100k residents than Virginia

#41. King William County
--- 48.1% lower vaccination rate than Virginia
- Population over 65 that is fully vaccinated: 40.6% (1,137 fully vaccinated)
--- 38.9% lower vaccination rate than Virginia
- Cumulative deaths per 100k: 58 (10 total deaths)
--- 53.2% less deaths per 100k residents than Virginia
- Cumulative cases per 100k: 6,666 (1,143 total cases)
--- 12.1% less cases per 100k residents than Virginia

#40. Hanover County
--- 47.4% lower vaccination rate than Virginia
- Population over 65 that is fully vaccinated: 31.4% (6,217 fully vaccinated)
--- 52.7% lower vaccination rate than Virginia
- Cumulative deaths per 100k: 139 (150 total deaths)
--- 12.1% more deaths per 100k residents than Virginia
- Cumulative cases per 100k: 7,245 (7,808 total cases)
--- 4.4% less cases per 100k residents than Virginia

#39. Northumberland County
--- 46.7% lower vaccination rate than Virginia
- Population over 65 that is fully vaccinated: 26.9% (1,222 fully vaccinated)
--- 59.5% lower vaccination rate than Virginia
- Cumulative deaths per 100k: 165 (20 total deaths)
--- 33.1% more deaths per 100k residents than Virginia
- Cumulative cases per 100k: 6,069 (734 total cases)
--- 19.9% less cases per 100k residents than Virginia

#38. Nelson County
--- 45.6% lower vaccination rate than Virginia
- Population over 65 that is fully vaccinated: 32.5% (1,366 fully vaccinated)
--- 51.1% lower vaccination rate than Virginia
- Cumulative deaths per 100k: 80 (12 total deaths)
--- 35.5% less deaths per 100k residents than Virginia
- Cumulative cases per 100k: 5,914 (883 total cases)
--- 22.0% less cases per 100k residents than Virginia

#37. Chesterfield County
--- 44.8% lower vaccination rate than Virginia
- Population over 65 that is fully vaccinated: 37.4% (20,322 fully vaccinated)
--- 43.7% lower vaccination rate than Virginia
- Cumulative deaths per 100k: 116 (411 total deaths)
--- 6.5% less deaths per 100k residents than Virginia
- Cumulative cases per 100k: 7,530 (26,566 total cases)
--- 0.7% less cases per 100k residents than Virginia

#36. Stafford County
--- 44.1% lower vaccination rate than Virginia
- Population over 65 that is fully vaccinated: 40.4% (6,625 fully vaccinated)
--- 39.2% lower vaccination rate than Virginia
- Cumulative deaths per 100k: 47 (72 total deaths)
--- 62.1% less deaths per 100k residents than Virginia
- Cumulative cases per 100k: 7,024 (10,739 total cases)
--- 7.3% less cases per 100k residents than Virginia

#35. Smyth County
--- 42.2% lower vaccination rate than Virginia
- Population over 65 that is fully vaccinated: 33.5% (2,282 fully vaccinated)
--- 49.5% lower vaccination rate than Virginia
- Cumulative deaths per 100k: 302 (91 total deaths)
--- 143.5% more deaths per 100k residents than Virginia
- Cumulative cases per 100k: 9,105 (2,741 total cases)
--- 20.1% more cases per 100k residents than Virginia

#34. Fauquier County
--- 41.1% lower vaccination rate than Virginia
- Population over 65 that is fully vaccinated: 37.5% (4,526 fully vaccinated)
--- 43.5% lower vaccination rate than Virginia
- Cumulative deaths per 100k: 88 (63 total deaths)
--- 29.0% less deaths per 100k residents than Virginia
- Cumulative cases per 100k: 6,365 (4,533 total cases)
--- 16.0% less cases per 100k residents than Virginia

#33. Arlington County
--- 40.7% lower vaccination rate than Virginia
- Population over 65 that is fully vaccinated: 28.5% (7,480 fully vaccinated)
--- 57.1% lower vaccination rate than Virginia
- Cumulative deaths per 100k: 105 (249 total deaths)
--- 15.3% less deaths per 100k residents than Virginia
- Cumulative cases per 100k: 6,264 (14,835 total cases)
--- 17.4% less cases per 100k residents than Virginia

#32. Norfolk city
--- 40.4% lower vaccination rate than Virginia
- Population over 65 that is fully vaccinated: 46.0% (12,916 fully vaccinated)
--- 30.7% lower vaccination rate than Virginia
- Cumulative deaths per 100k: 100 (242 total deaths)
--- 19.4% less deaths per 100k residents than Virginia
- Cumulative cases per 100k: 7,002 (16,998 total cases)
--- 7.6% less cases per 100k residents than Virginia

#31. Virginia Beach city
--- 39.6% lower vaccination rate than Virginia
- Population over 65 that is fully vaccinated: 42.6% (28,254 fully vaccinated)
--- 35.8% lower vaccination rate than Virginia
- Cumulative deaths per 100k: 83 (375 total deaths)
--- 33.1% less deaths per 100k residents than Virginia
- Cumulative cases per 100k: 7,687 (34,588 total cases)
--- 1.4% more cases per 100k residents than Virginia

#30. Amherst County
--- 38.9% lower vaccination rate than Virginia
- Population over 65 that is fully vaccinated: 37.1% (2,535 fully vaccinated)
--- 44.1% lower vaccination rate than Virginia
- Cumulative deaths per 100k: 104 (33 total deaths)
--- 16.1% less deaths per 100k residents than Virginia
- Cumulative cases per 100k: 9,065 (2,865 total cases)
--- 19.6% more cases per 100k residents than Virginia
#29. Loudoun County
--- 38.5% lower vaccination rate than Virginia
- Population over 65 that is fully vaccinated: 50.3% (20,215 fully vaccinated)
--- 24.2% lower vaccination rate than Virginia
- Cumulative deaths per 100k: 66 (274 total deaths)
--- 46.8% less deaths per 100k residents than Virginia
- Cumulative cases per 100k: 6,455 (26,694 total cases)
--- 14.9% less cases per 100k residents than Virginia

#28. Tazewell County
--- 37.8% lower vaccination rate than Virginia
- Population over 65 that is fully vaccinated: 34.5% (3,224 fully vaccinated)
--- 48.0% lower vaccination rate than Virginia
- Cumulative deaths per 100k: 160 (65 total deaths)
--- 29.0% more deaths per 100k residents than Virginia
- Cumulative cases per 100k: 8,669 (3,519 total cases)
--- 14.4% more cases per 100k residents than Virginia

#27. Brunswick County
--- 37.4% lower vaccination rate than Virginia
- Population over 65 that is fully vaccinated: 39.7% (1,402 fully vaccinated)
--- 40.2% lower vaccination rate than Virginia
- Cumulative deaths per 100k: 123 (20 total deaths)
--- 0.8% less deaths per 100k residents than Virginia
- Cumulative cases per 100k: 7,898 (1,282 total cases)
--- 4.2% more cases per 100k residents than Virginia

#26. Shenandoah County
--- 36.3% lower vaccination rate than Virginia
- Population over 65 that is fully vaccinated: 42.1% (4,076 fully vaccinated)
--- 36.6% lower vaccination rate than Virginia
- Cumulative deaths per 100k: 296 (129 total deaths)
--- 138.7% more deaths per 100k residents than Virginia
- Cumulative cases per 100k: 9,430 (4,113 total cases)
--- 24.4% more cases per 100k residents than Virginia

#25. Hampton city
--- 34.4% lower vaccination rate than Virginia
- Population over 65 that is fully vaccinated: 43.0% (9,096 fully vaccinated)
--- 35.2% lower vaccination rate than Virginia
- Cumulative deaths per 100k: 123 (166 total deaths)
--- 0.8% less deaths per 100k residents than Virginia
- Cumulative cases per 100k: 7,446 (10,016 total cases)
--- 1.8% less cases per 100k residents than Virginia

#24. Scott County
--- 33.0% lower vaccination rate than Virginia
- Population over 65 that is fully vaccinated: 38.3% (2,055 fully vaccinated)
--- 42.3% lower vaccination rate than Virginia
- Cumulative deaths per 100k: 236 (51 total deaths)
--- 90.3% more deaths per 100k residents than Virginia
- Cumulative cases per 100k: 8,249 (1,779 total cases)
--- 8.8% more cases per 100k residents than Virginia

#23. Surry County
--- 32.2% lower vaccination rate than Virginia
- Population over 65 that is fully vaccinated: 40.1% (615 fully vaccinated)
--- 39.6% lower vaccination rate than Virginia
- Cumulative deaths per 100k: 140 (9 total deaths)
--- 12.9% more deaths per 100k residents than Virginia
- Cumulative cases per 100k: 6,431 (413 total cases)
--- 15.2% less cases per 100k residents than Virginia

#22. Dickenson County
--- 29.6% lower vaccination rate than Virginia
- Population over 65 that is fully vaccinated: 42.1% (1,385 fully vaccinated)
--- 36.6% lower vaccination rate than Virginia
- Cumulative deaths per 100k: 105 (15 total deaths)
--- 15.3% less deaths per 100k residents than Virginia
- Cumulative cases per 100k: 6,370 (912 total cases)
--- 16.0% less cases per 100k residents than Virginia
#21. Prince William County
--- 28.9% lower vaccination rate than Virginia
- Population over 65 that is fully vaccinated: 53.3% (25,863 fully vaccinated)
--- 19.7% lower vaccination rate than Virginia
- Cumulative deaths per 100k: 102 (478 total deaths)
--- 17.7% less deaths per 100k residents than Virginia
- Cumulative cases per 100k: 9,318 (43,825 total cases)
--- 22.9% more cases per 100k residents than Virginia

#20. Russell County
--- 28.5% lower vaccination rate than Virginia
- Population over 65 that is fully vaccinated: 37.9% (2,267 fully vaccinated)
--- 42.9% lower vaccination rate than Virginia
- Cumulative deaths per 100k: 135 (36 total deaths)
--- 8.9% more deaths per 100k residents than Virginia
- Cumulative cases per 100k: 8,331 (2,215 total cases)
--- 9.9% more cases per 100k residents than Virginia

#19. Buchanan County
--- 27.4% lower vaccination rate than Virginia
- Population over 65 that is fully vaccinated: 35.6% (1,723 fully vaccinated)
--- 46.4% lower vaccination rate than Virginia
- Cumulative deaths per 100k: 181 (38 total deaths)
--- 46.0% more deaths per 100k residents than Virginia
- Cumulative cases per 100k: 6,599 (1,386 total cases)
--- 13.0% less cases per 100k residents than Virginia

#18. Lunenburg County
--- 27.0% lower vaccination rate than Virginia
- Population over 65 that is fully vaccinated: 42.7% (1,181 fully vaccinated)
--- 35.7% lower vaccination rate than Virginia
- Cumulative deaths per 100k: 98 (12 total deaths)
--- 21.0% less deaths per 100k residents than Virginia
- Cumulative cases per 100k: 6,043 (737 total cases)
--- 20.3% less cases per 100k residents than Virginia

#17. York County
--- 24.8% lower vaccination rate than Virginia
- Population over 65 that is fully vaccinated: 54.3% (6,175 fully vaccinated)
--- 18.2% lower vaccination rate than Virginia
- Cumulative deaths per 100k: 73 (50 total deaths)
--- 41.1% less deaths per 100k residents than Virginia
- Cumulative cases per 100k: 5,278 (3,604 total cases)
--- 30.4% less cases per 100k residents than Virginia

#16. Fairfax County
--- 21.5% lower vaccination rate than Virginia
- Population over 65 that is fully vaccinated: 52.1% (83,543 fully vaccinated)
--- 21.5% lower vaccination rate than Virginia
- Cumulative deaths per 100k: 92 (1,061 total deaths)
--- 25.8% less deaths per 100k residents than Virginia
- Cumulative cases per 100k: 6,492 (74,499 total cases)
--- 14.4% less cases per 100k residents than Virginia

#15. Goochland County
--- 21.5% lower vaccination rate than Virginia
- Population over 65 that is fully vaccinated: 46.6% (2,531 fully vaccinated)
--- 29.8% lower vaccination rate than Virginia
- Cumulative deaths per 100k: 97 (23 total deaths)
--- 21.8% less deaths per 100k residents than Virginia
- Cumulative cases per 100k: 5,856 (1,391 total cases)
--- 22.8% less cases per 100k residents than Virginia

#14. Fluvanna County
--- 20.4% lower vaccination rate than Virginia
- Population over 65 that is fully vaccinated: 50.5% (2,830 fully vaccinated)
--- 23.9% lower vaccination rate than Virginia
- Cumulative deaths per 100k: 62 (17 total deaths)
--- 50.0% less deaths per 100k residents than Virginia
- Cumulative cases per 100k: 6,025 (1,643 total cases)
--- 20.5% less cases per 100k residents than Virginia

#13. Clarke County
--- 20.4% lower vaccination rate than Virginia
- Population over 65 that is fully vaccinated: 50.7% (1,618 fully vaccinated)
--- 23.6% lower vaccination rate than Virginia
- Cumulative deaths per 100k: 130 (19 total deaths)
--- 4.8% more deaths per 100k residents than Virginia
- Cumulative cases per 100k: 6,403 (936 total cases)
--- 15.5% less cases per 100k residents than Virginia

#12. Lancaster County
--- 17.0% lower vaccination rate than Virginia
- Population over 65 that is fully vaccinated: 41.5% (1,612 fully vaccinated)
--- 37.5% lower vaccination rate than Virginia
- Cumulative deaths per 100k: 141 (15 total deaths)
--- 13.7% more deaths per 100k residents than Virginia
- Cumulative cases per 100k: 6,658 (706 total cases)
--- 12.2% less cases per 100k residents than Virginia

#11. Lee County
--- 16.3% lower vaccination rate than Virginia
- Population over 65 that is fully vaccinated: 46.7% (2,433 fully vaccinated)
--- 29.7% lower vaccination rate than Virginia
- Cumulative deaths per 100k: 196 (46 total deaths)
--- 58.1% more deaths per 100k residents than Virginia
- Cumulative cases per 100k: 10,234 (2,397 total cases)
--- 35.0% more cases per 100k residents than Virginia

#10. Madison County
--- 13.7% lower vaccination rate than Virginia
- Population over 65 that is fully vaccinated: 50.1% (1,522 fully vaccinated)
--- 24.5% lower vaccination rate than Virginia
- Cumulative deaths per 100k: 121 (16 total deaths)
--- 2.4% less deaths per 100k residents than Virginia
- Cumulative cases per 100k: 4,464 (592 total cases)
--- 41.1% less cases per 100k residents than Virginia

#9. Washington County
--- 9.6% lower vaccination rate than Virginia
- Population over 65 that is fully vaccinated: 49.5% (6,286 fully vaccinated)
--- 25.5% lower vaccination rate than Virginia
- Cumulative deaths per 100k: 190 (102 total deaths)
--- 53.2% more deaths per 100k residents than Virginia
- Cumulative cases per 100k: 8,759 (4,707 total cases)
--- 15.5% more cases per 100k residents than Virginia

#8. Gloucester County
--- 7.0% lower vaccination rate than Virginia
- Population over 65 that is fully vaccinated: 65.1% (4,774 fully vaccinated)
--- 2.0% lower vaccination rate than Virginia
- Cumulative deaths per 100k: 126 (47 total deaths)
--- 1.6% more deaths per 100k residents than Virginia
- Cumulative cases per 100k: 5,770 (2,155 total cases)
--- 23.9% less cases per 100k residents than Virginia

#7. Mathews County
--- 1.5% higher vaccination rate than Virginia
- Population over 65 that is fully vaccinated: 57.5% (1,600 fully vaccinated)
--- 13.4% lower vaccination rate than Virginia
- Cumulative deaths per 100k: 136 (12 total deaths)
--- 9.7% more deaths per 100k residents than Virginia
- Cumulative cases per 100k: 6,701 (592 total cases)
--- 11.6% less cases per 100k residents than Virginia

#6. Bristol city
--- 6.7% higher vaccination rate than Virginia
- Population over 65 that is fully vaccinated: 70.8% (2,566 fully vaccinated)
--- 6.6% higher vaccination rate than Virginia
- Cumulative deaths per 100k: 191 (32 total deaths)
--- 54.0% more deaths per 100k residents than Virginia
- Cumulative cases per 100k: 8,275 (1,387 total cases)
--- 9.2% more cases per 100k residents than Virginia

#5. Middlesex County
--- 7.0% higher vaccination rate than Virginia
- Population over 65 that is fully vaccinated: 58.8% (1,993 fully vaccinated)
--- 11.4% lower vaccination rate than Virginia
- Cumulative deaths per 100k: 189 (20 total deaths)
--- 52.4% more deaths per 100k residents than Virginia
- Cumulative cases per 100k: 5,349 (566 total cases)
--- 29.4% less cases per 100k residents than Virginia

#4. Northampton County
--- 10.7% higher vaccination rate than Virginia
- Population over 65 that is fully vaccinated: 61.1% (1,936 fully vaccinated)
--- 8.0% lower vaccination rate than Virginia
- Cumulative deaths per 100k: 299 (35 total deaths)
--- 141.1% more deaths per 100k residents than Virginia
- Cumulative cases per 100k: 6,695 (784 total cases)
--- 11.7% less cases per 100k residents than Virginia

#3. Accomack County
--- 13.7% higher vaccination rate than Virginia
- Population over 65 that is fully vaccinated: 68.3% (5,417 fully vaccinated)
--- 2.9% higher vaccination rate than Virginia
- Cumulative deaths per 100k: 124 (40 total deaths)
--- 0.0% less deaths per 100k residents than Virginia
- Cumulative cases per 100k: 8,581 (2,773 total cases)
--- 13.2% more cases per 100k residents than Virginia

#2. Portsmouth city
--- 26.3% higher vaccination rate than Virginia
- Population over 65 that is fully vaccinated: 62.7% (8,955 fully vaccinated)
--- 5.6% lower vaccination rate than Virginia
- Cumulative deaths per 100k: 196 (185 total deaths)
--- 58.1% more deaths per 100k residents than Virginia
- Cumulative cases per 100k: 9,218 (8,702 total cases)
--- 21.6% more cases per 100k residents than Virginia

#1. Highland County
--- 34.8% higher vaccination rate than Virginia
- Population over 65 that is fully vaccinated: 63.6% (495 fully vaccinated)
--- 4.2% lower vaccination rate than Virginia
- Cumulative deaths per 100k: 46 (1 total deaths)
--- 62.9% less deaths per 100k residents than Virginia
- Cumulative cases per 100k: 4,932 (108 total cases)
--- 34.9% less cases per 100k residents than Virginia


