
Lowest-paying jobs in Baltimore
Lowest-paying jobs in Baltimore
If you’ve ever found yourself saying, “I get paid nothing,” then cozy up to your screen with a 15-cent pack of ramen noodles—you won’t want to miss this list.
Unemployment is at its lowest rate since 2000. But having a job, and having a job that pays a living wage, are not necessarily the same thing. So while 250,000 non-farm jobs were added to the U.S. economy in October, it’s a different dataset entirely to explore which of those jobs actually pay a living wage. How do things shake out in your hometown? To determine which jobs in the U.S. pay the lowest in Baltimore, Stacker analyzed information from the U.S. Bureau of Labor Statistics (BLS). The data was collected in May 2017 and ranked by average annual salary, with ties being broken by average hourly wage. Aside from the cool fact that the occupation of hand-sewer still exists, the data provides interesting insights as to who truly should get to complain about their wages. Did your job make the list?
RELATED: Highest-paying jobs in Baltimore
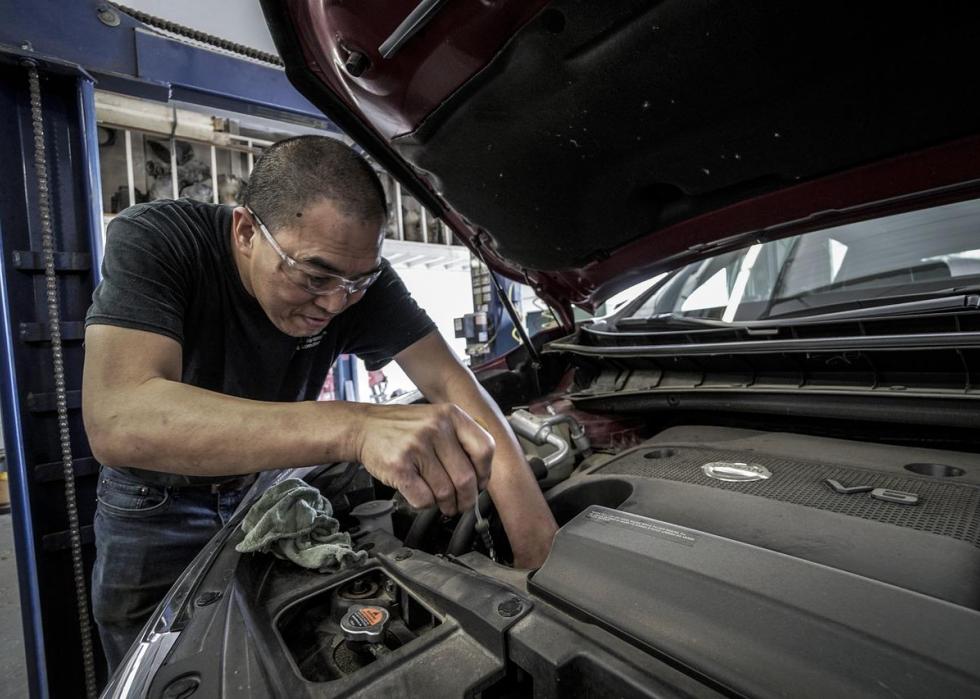
#25. Automotive and watercraft service attendants
Average annual salary: $24,030
Average hourly wage: $11.55
Total employment in Baltimore: 1,820

#24. Childcare workers
Average annual salary: $23,860
Average hourly wage: $11.47
Total employment in Baltimore: 4,220

#23. Cooks, short order
Average annual salary: $23,770
Average hourly wage: $11.43
Total employment in Baltimore: 2,230
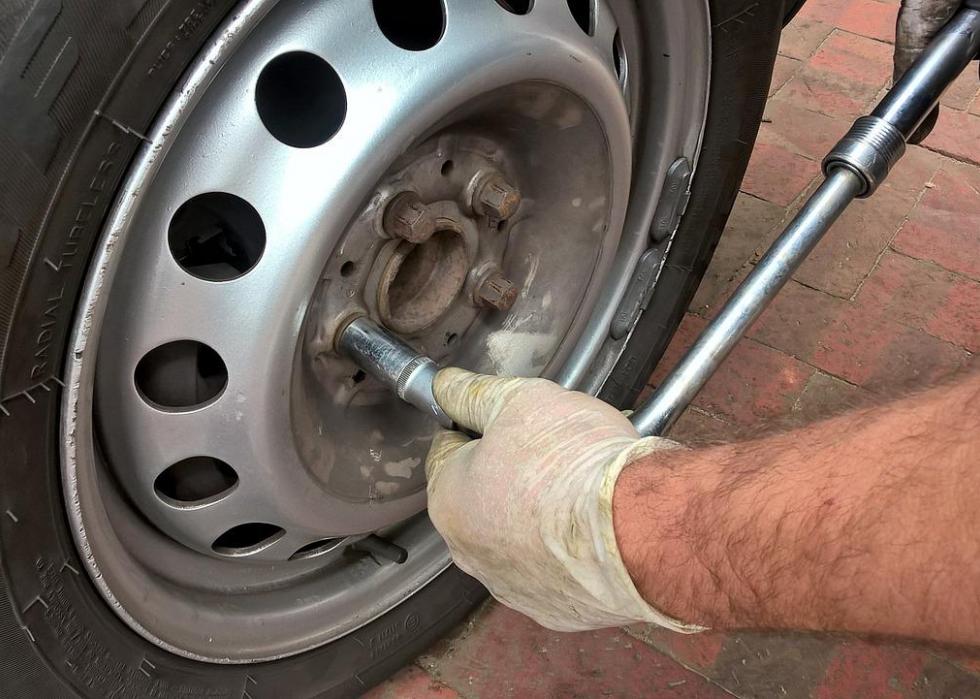
#22. Tire repairers and changers
Average annual salary: $23,750
Average hourly wage: $11.42
Total employment in Baltimore: 850
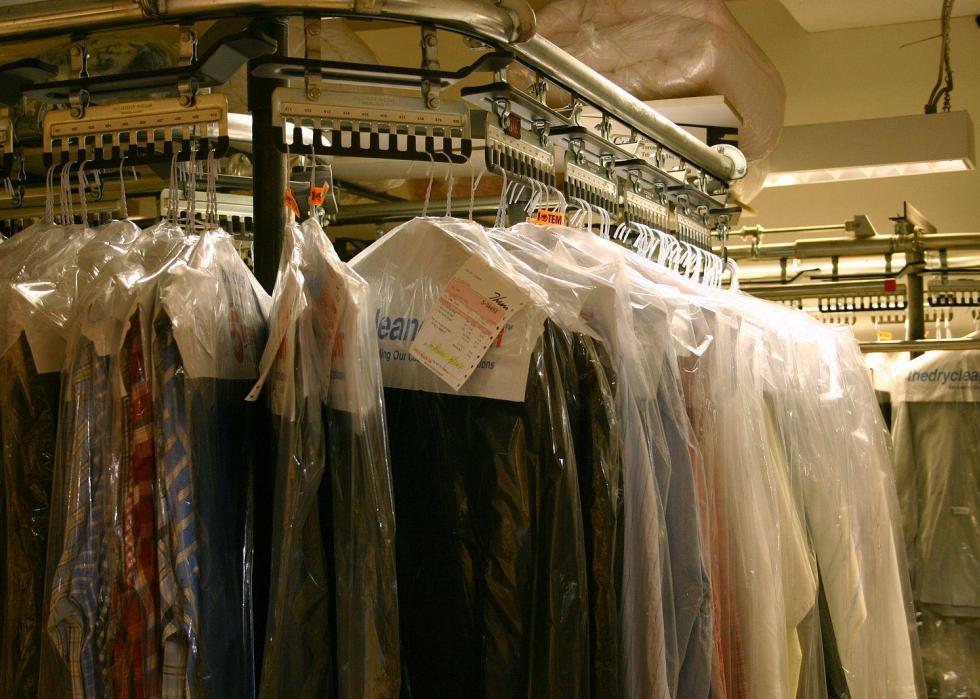
#21. Laundry and dry-cleaning workers
Average annual salary: $23,650
Average hourly wage: $11.37
Total employment in Baltimore: 2,260

#20. bartenders
Average annual salary: $23,640
Average hourly wage: $11.37
Total employment in Baltimore: 5,690
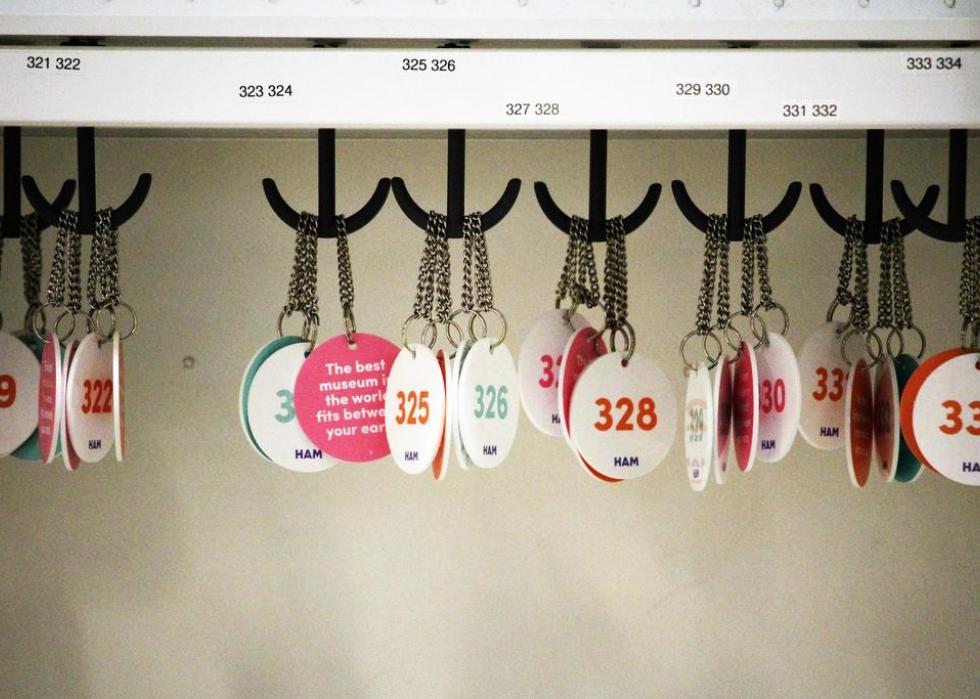
#19. Locker room, coatroom, and dressing room attendants
Average annual salary: $23,580
Average hourly wage: $11.34
Total employment in Baltimore: 100

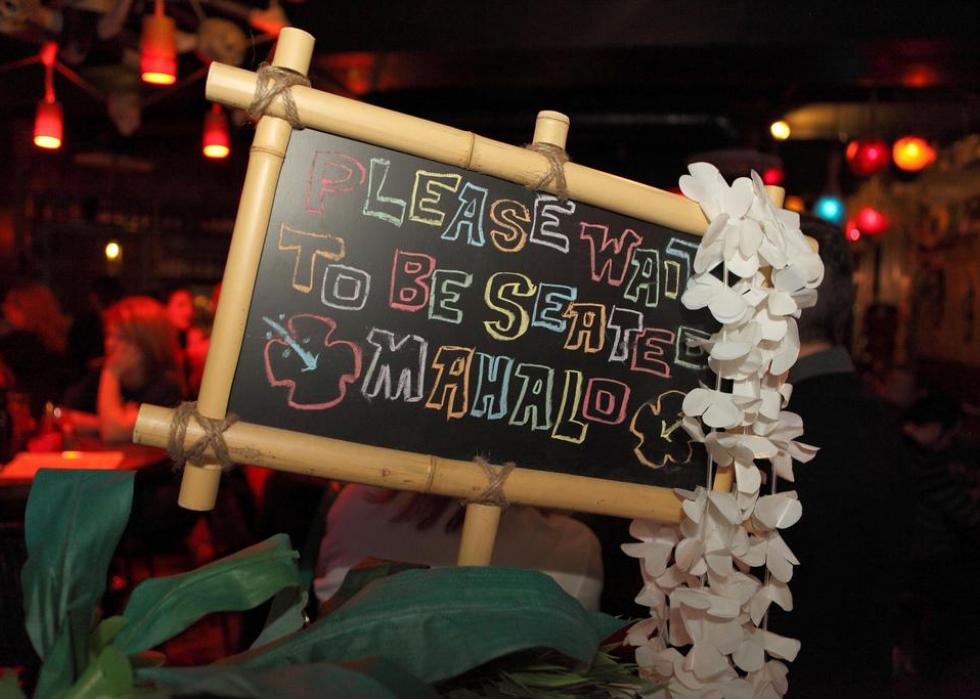
#18. Waiters and waitresses
Average annual salary: $23,200
Average hourly wage: $11.15
Total employment in Baltimore: 21,400
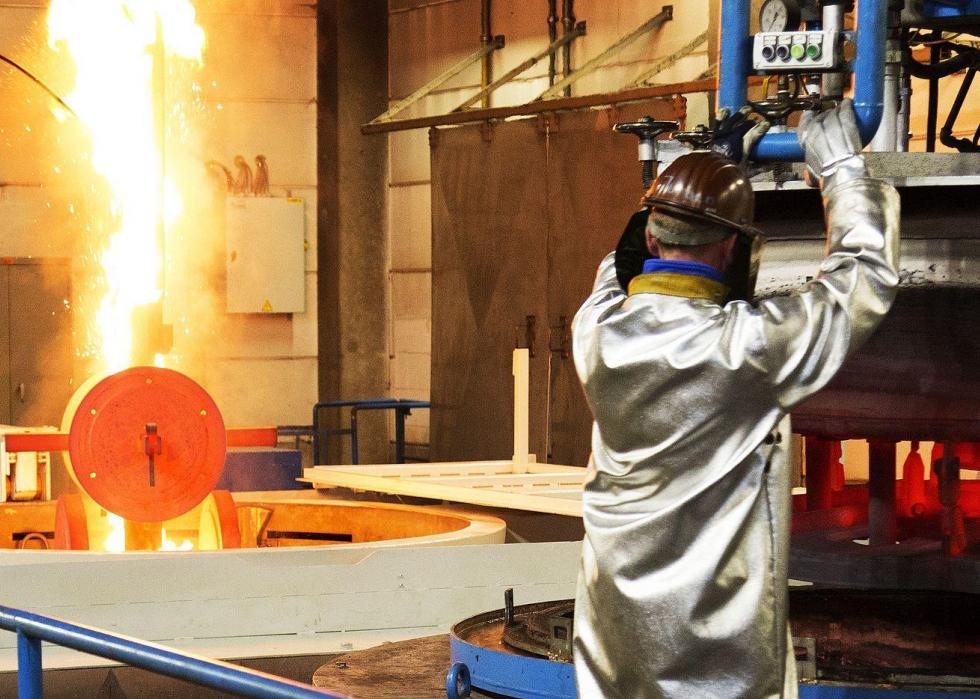
#17. Heat treating equipment setters, operators, and tenders, metal and plastic
Average annual salary: $23,180
Average hourly wage: $11.14
Total employment in Baltimore: N/A
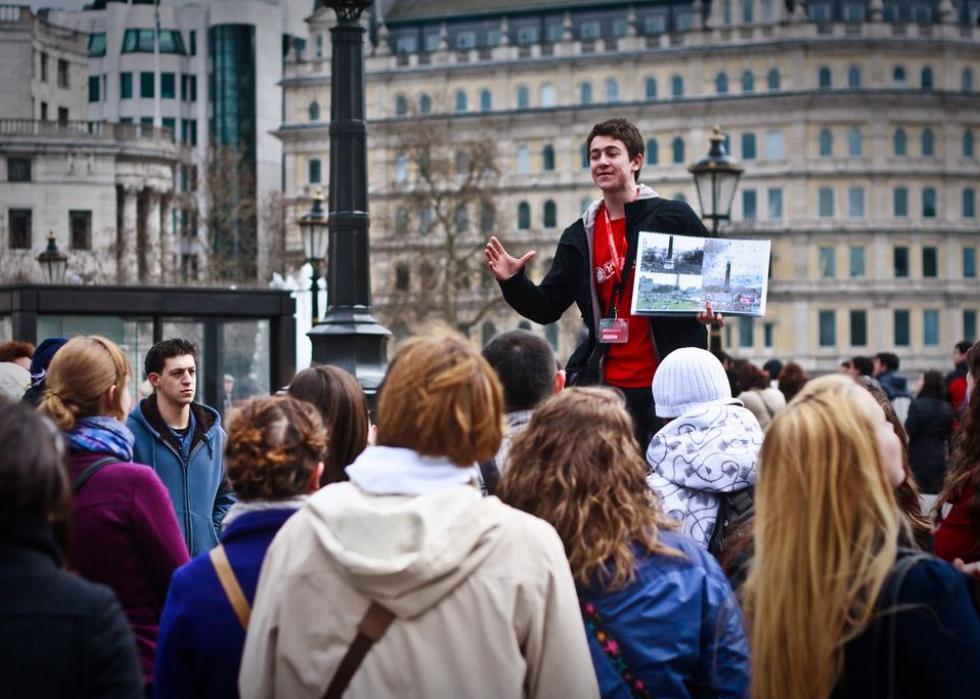
#16. Tour and travel guides
Average annual salary: $22,880
Average hourly wage: $11.00
Total employment in Baltimore: 190
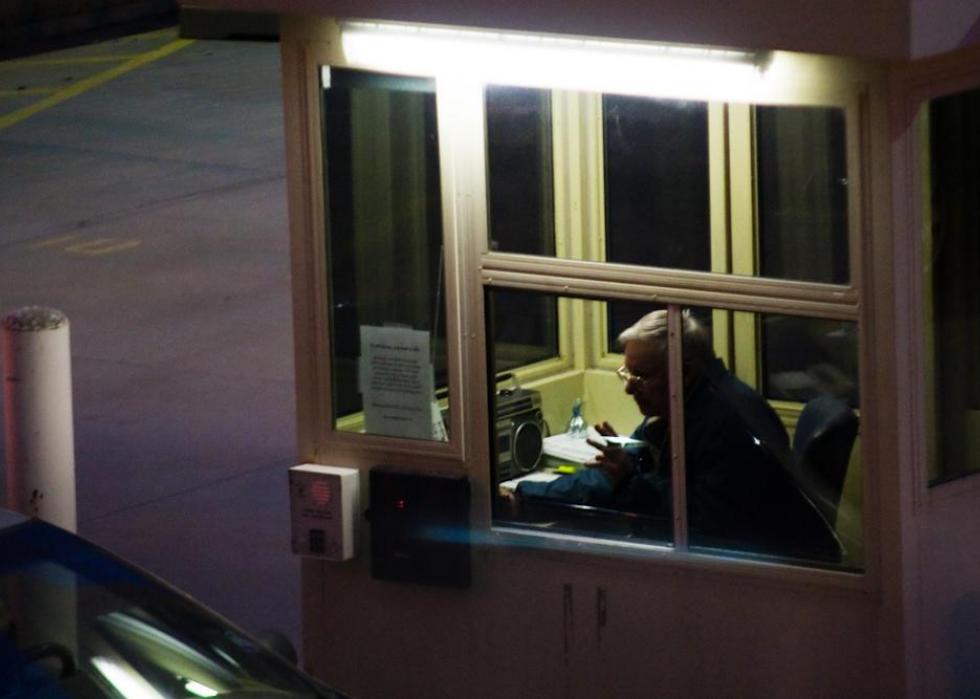
#15. Parking lot attendants
Average annual salary: $22,580
Average hourly wage: $10.86
Total employment in Baltimore: 1,600

#14. Helpers, construction trades, all other
Average annual salary: $22,580
Average hourly wage: $10.86
Total employment in Baltimore: N/A

#13. Amusement and recreation attendants
Average annual salary: $22,400
Average hourly wage: $10.77
Total employment in Baltimore: 2,060

#12. Food servers, non-restaurant
Average annual salary: $22,290
Average hourly wage: $10.72
Total employment in Baltimore: 3,100
#11. Hosts and hostesses, restaurant, lounge, and coffee shop
Average annual salary: $22,160
Average hourly wage: $10.65
Total employment in Baltimore: 3,810

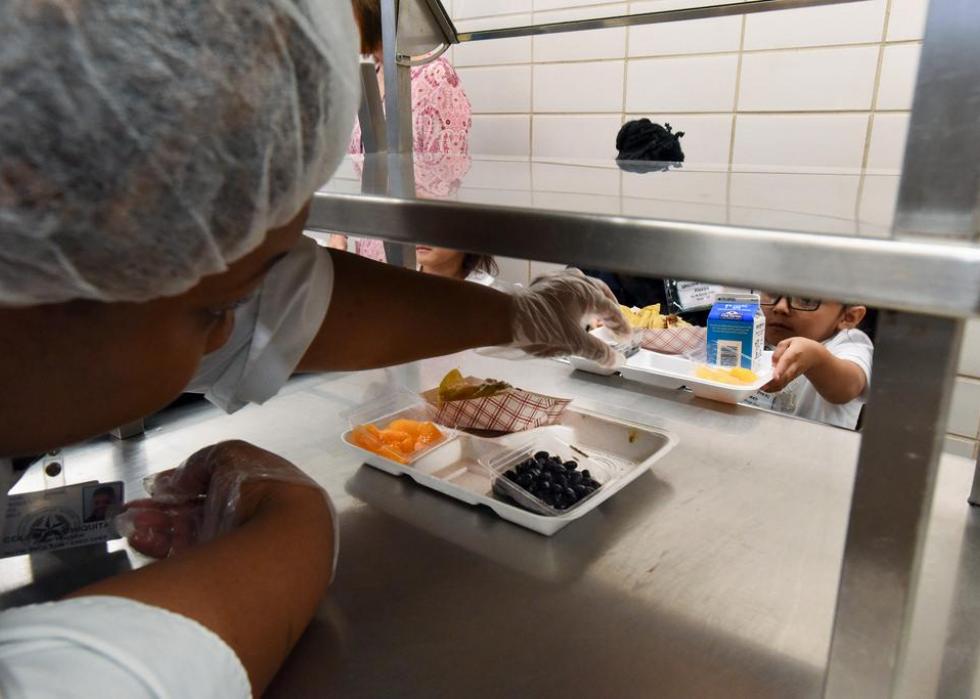
#10. Dining room and cafeteria attendants and bartender helpers
Average annual salary: $22,140
Average hourly wage: $10.64
Total employment in Baltimore: 5,770

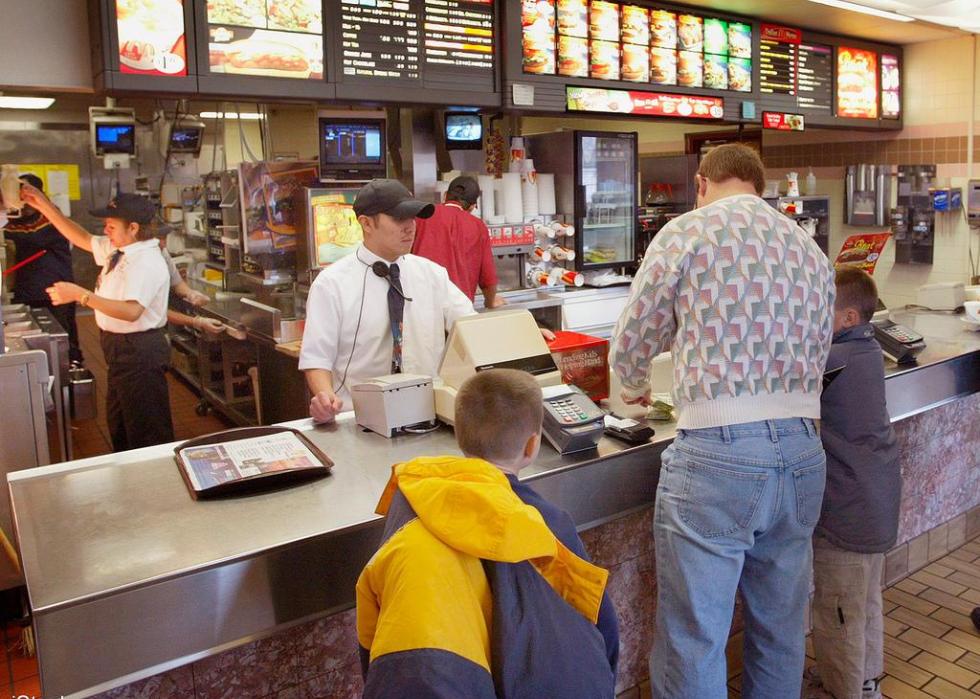
#9. Cooks, fast food
Average annual salary: $22,130
Average hourly wage: $10.64
Total employment in Baltimore: 3,390
#8. Counter attendants, cafeteria, food concession, and coffee shop
Average annual salary: $22,080
Average hourly wage: $10.61
Total employment in Baltimore: 6,620

#7. Cashiers
Average annual salary: $21,990
Average hourly wage: $10.57
Total employment in Baltimore: 37,570
#6. Combined food preparation and serving workers, including fast food
Average annual salary: $21,770
Average hourly wage: $10.47
Total employment in Baltimore: 22,880

#5. Dishwashers
Average annual salary: $21,560
Average hourly wage: $10.37
Total employment in Baltimore: 4,740

#4. Building cleaning workers, all other
Average annual salary: $21,350
Average hourly wage: $10.26
Total employment in Baltimore: N/A

#3. Ushers, lobby attendants, and ticket takers
Average annual salary: $21,340
Average hourly wage: $10.26
Total employment in Baltimore: 1,250
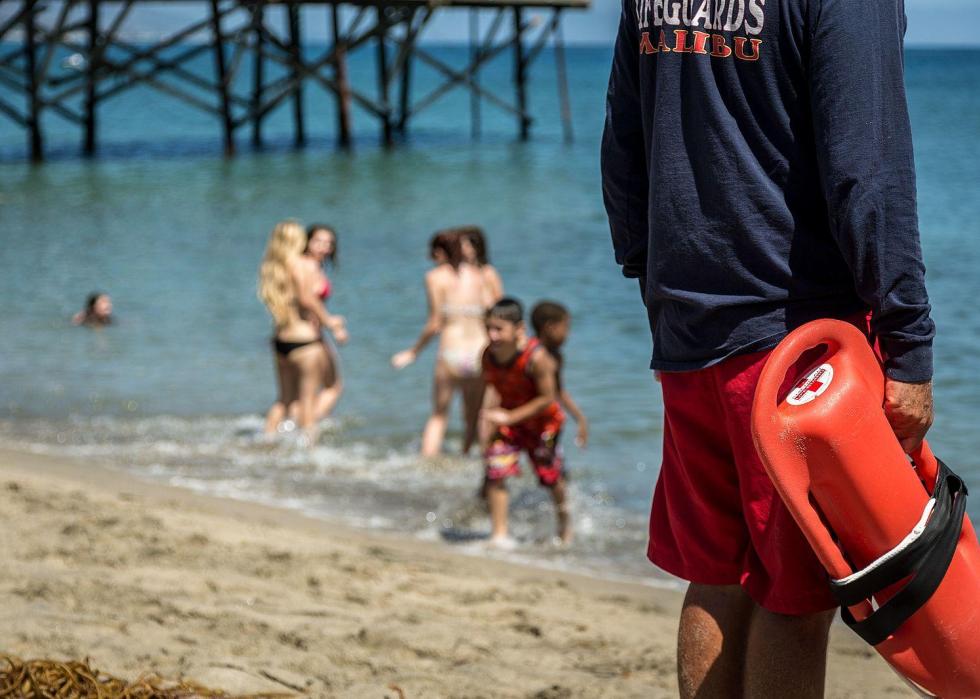
#2. Lifeguards, ski patrol, and other recreational protective service workers
Average annual salary: $20,790
Average hourly wage: $10.00
Total employment in Baltimore: 1,150

#1. Shampooers
Average annual salary: $20,530
Average hourly wage: $9.87
Total employment in Baltimore: 680


