
Where people in Boston are moving to most
Written by:
April 18, 2021
Sean Pavone // Shutterstock
Where people in Boston are moving to most
Stacker compiled a list of where people in Boston are moving to the most using data from the U.S. Census Bureau. Metros are ranked by the estimated number of people who moved to the metro from Boston between 2014 and 2018. Ties were broken by gross migration.

1 / 50
Akhenaton06 // Wikicommons
#50. Columbia, SC Metro Area
- Migration to Columbia in 2014-2018: 549
- Migration from Columbia to Boston: 75 (#70 most common destination from Columbia)
- Net migration: 474 to Columbia
- Migration from Columbia to Boston: 75 (#70 most common destination from Columbia)
- Net migration: 474 to Columbia

2 / 50
Sherry V Smith // Shutterstock
#49. Virginia Beach-Norfolk-Newport News, VA-NC Metro Area
- Migration to Virginia Beach in 2014-2018: 550
- Migration from Virginia Beach to Boston: 647 (#28 most common destination from Virginia Beach)
- Net migration: 97 to Boston
- Migration from Virginia Beach to Boston: 647 (#28 most common destination from Virginia Beach)
- Net migration: 97 to Boston

3 / 50
Atlpedia// Wikimedia
#48. Durham-Chapel Hill, NC Metro Area
- Migration to Durham in 2014-2018: 553
- Migration from Durham to Boston: 589 (#12 most common destination from Durham)
- Net migration: 36 to Boston
- Migration from Durham to Boston: 589 (#12 most common destination from Durham)
- Net migration: 36 to Boston

4 / 50
Arina P Habich // Shutterstock
#47. Boulder, CO Metro Area
- Migration to Boulder in 2014-2018: 574
- Migration from Boulder to Boston: 299 (#8 most common destination from Boulder)
- Net migration: 275 to Boulder
- Migration from Boulder to Boston: 299 (#8 most common destination from Boulder)
- Net migration: 275 to Boulder

5 / 50
Lewis Liu // Shutterstock
#46. Ithaca, NY Metro Area
- Migration to Ithaca in 2014-2018: 597
- Migration from Ithaca to Boston: 455 (#2 most common destination from Ithaca)
- Net migration: 142 to Ithaca
- Migration from Ithaca to Boston: 455 (#2 most common destination from Ithaca)
- Net migration: 142 to Ithaca

6 / 50
PhotosByMahin // Pixabay
#45. Detroit-Warren-Dearborn, MI Metro Area
- Migration to Detroit in 2014-2018: 606
- Migration from Detroit to Boston: 240 (#72 most common destination from Detroit)
- Net migration: 366 to Detroit
- Migration from Detroit to Boston: 240 (#72 most common destination from Detroit)
- Net migration: 366 to Detroit

7 / 50
Zereshk // Wikimedia
#44. Tucson, AZ Metro Area
- Migration to Tucson in 2014-2018: 642
- Migration from Tucson to Boston: 286 (#29 most common destination from Tucson)
- Net migration: 356 to Tucson
- Migration from Tucson to Boston: 286 (#29 most common destination from Tucson)
- Net migration: 356 to Tucson

8 / 50
Canva
#43. Cincinnati, OH-KY-IN Metro Area
- Migration to Cincinnati in 2014-2018: 658
- Migration from Cincinnati to Boston: 347 (#37 most common destination from Cincinnati)
- Net migration: 311 to Cincinnati
- Migration from Cincinnati to Boston: 347 (#37 most common destination from Cincinnati)
- Net migration: 311 to Cincinnati

9 / 50
Protophobic // Wikicommons
#42. Pittsfield, MA Metro Area
- Migration to Pittsfield in 2014-2018: 664
- Migration from Pittsfield to Boston: 619 (#2 most common destination from Pittsfield)
- Net migration: 45 to Pittsfield
- Migration from Pittsfield to Boston: 619 (#2 most common destination from Pittsfield)
- Net migration: 45 to Pittsfield
10 / 50
Sanibel Sun // WikiCommons
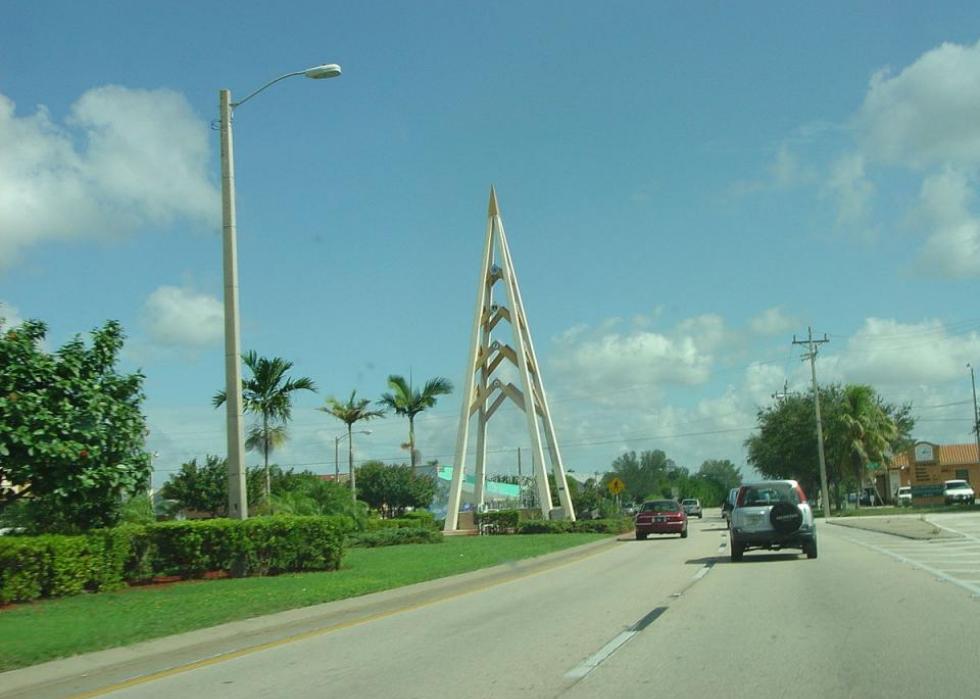
#41. Cape Coral-Fort Myers, FL Metro Area
- Migration to Cape Coral in 2014-2018: 693
- Migration from Cape Coral to Boston: 313 (#15 most common destination from Cape Coral)
- Net migration: 380 to Cape Coral
- Migration from Cape Coral to Boston: 313 (#15 most common destination from Cape Coral)
- Net migration: 380 to Cape Coral

11 / 50
FloridaStock // Shutterstock
#40. Naples-Immokalee-Marco Island, FL Metro Area
- Migration to Naples in 2014-2018: 695
- Migration from Naples to Boston: 220 (#15 most common destination from Naples)
- Net migration: 475 to Naples
- Migration from Naples to Boston: 220 (#15 most common destination from Naples)
- Net migration: 475 to Naples
12 / 50
Tony Webster // Wikicommons
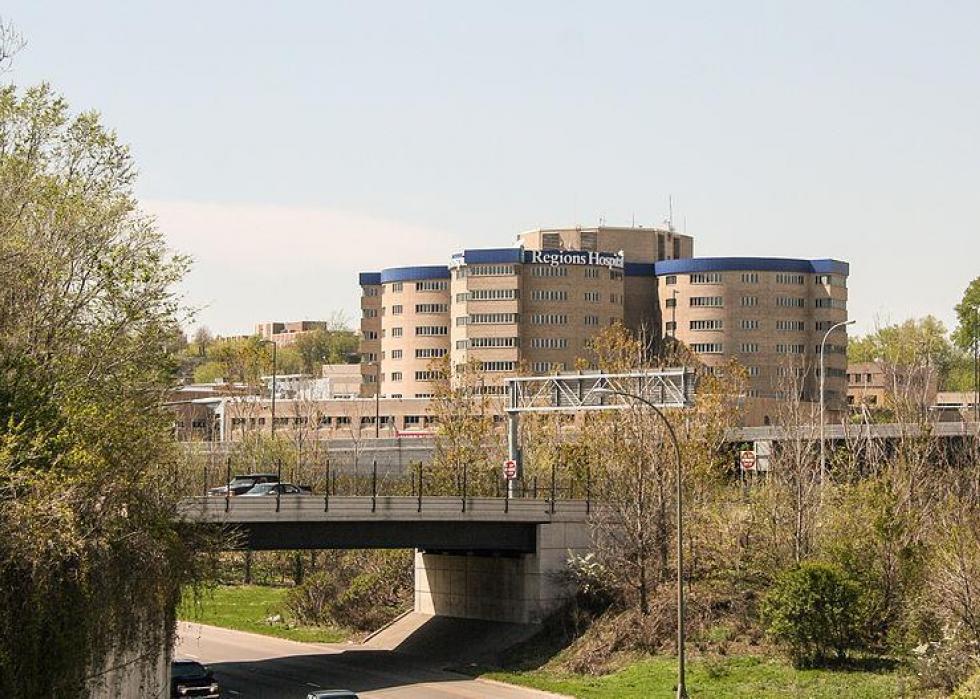
#39. Minneapolis-St. Paul-Bloomington, MN-WI Metro Area
- Migration to Minneapolis in 2014-2018: 698
- Migration from Minneapolis to Boston: 670 (#32 most common destination from Minneapolis)
- Net migration: 28 to Minneapolis
- Migration from Minneapolis to Boston: 670 (#32 most common destination from Minneapolis)
- Net migration: 28 to Minneapolis
13 / 50
Yinan Chen // Wikimedia
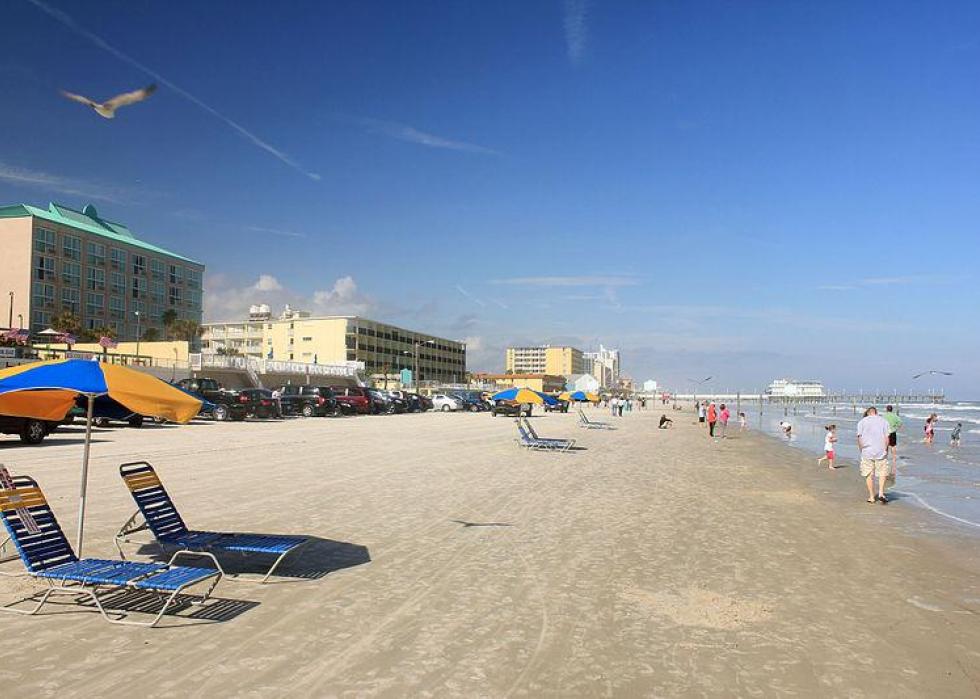
#38. Deltona-Daytona Beach-Ormond Beach, FL Metro Area
- Migration to Deltona in 2014-2018: 723
- Migration from Deltona to Boston: 160 (#34 most common destination from Deltona)
- Net migration: 563 to Deltona
- Migration from Deltona to Boston: 160 (#34 most common destination from Deltona)
- Net migration: 563 to Deltona

14 / 50
f11photo // Shutterstock
#37. Nashville-Davidson--Murfreesboro--Franklin, TN Metro Area
- Migration to Nashville in 2014-2018: 768
- Migration from Nashville to Boston: 519 (#20 most common destination from Nashville)
- Net migration: 249 to Nashville
- Migration from Nashville to Boston: 519 (#20 most common destination from Nashville)
- Net migration: 249 to Nashville
15 / 50
Wangkun Jia // Shutterstock
#36. Bangor, ME Metro Area
- Migration to Bangor in 2014-2018: 826
- Migration from Bangor to Boston: 274 (#3 most common destination from Bangor)
- Net migration: 552 to Bangor
- Migration from Bangor to Boston: 274 (#3 most common destination from Bangor)
- Net migration: 552 to Bangor
16 / 50
Pat McGinley // Shutterstock
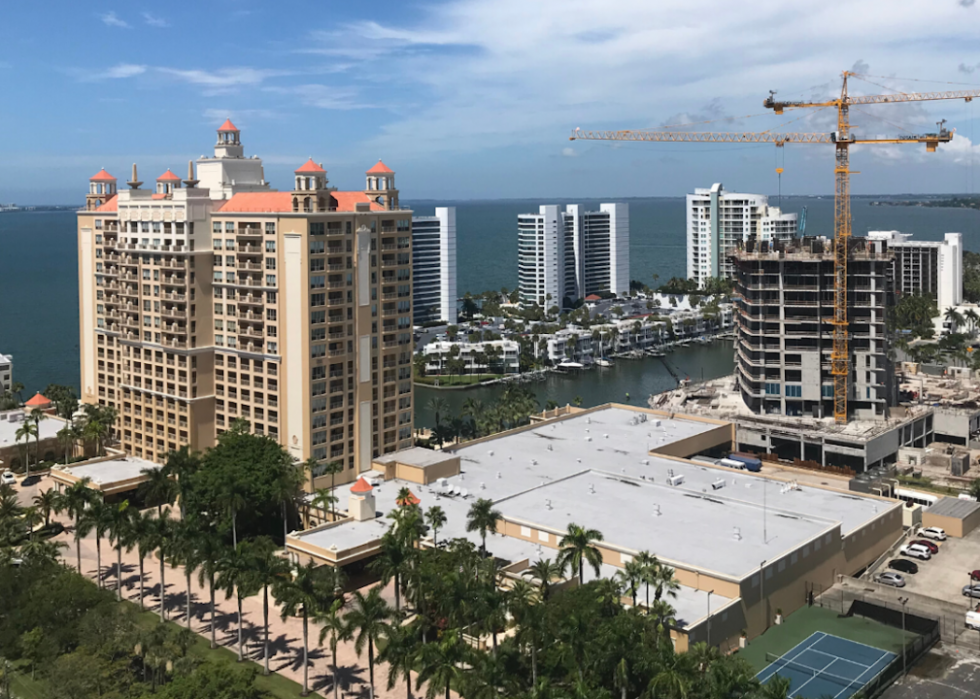
#35. North Port-Sarasota-Bradenton, FL Metro Area
- Migration to North Port in 2014-2018: 831
- Migration from North Port to Boston: 441 (#17 most common destination from North Port)
- Net migration: 390 to North Port
- Migration from North Port to Boston: 441 (#17 most common destination from North Port)
- Net migration: 390 to North Port

17 / 50
John Phelan // Wikimedia Commons
#34. New Haven-Milford, CT Metro Area
- Migration to New Haven in 2014-2018: 838
- Migration from New Haven to Boston: 1,530 (#5 most common destination from New Haven)
- Net migration: 692 to Boston
- Migration from New Haven to Boston: 1,530 (#5 most common destination from New Haven)
- Net migration: 692 to Boston

18 / 50
DPPed// Wikimedia
#33. Phoenix-Mesa-Scottsdale, AZ Metro Area
- Migration to Phoenix in 2014-2018: 908
- Migration from Phoenix to Boston: 665 (#42 most common destination from Phoenix)
- Net migration: 243 to Phoenix
- Migration from Phoenix to Boston: 665 (#42 most common destination from Phoenix)
- Net migration: 243 to Phoenix

19 / 50
JonathanVictor // Wikimedia
#32. Bridgeport-Stamford-Norwalk, CT Metro Area
- Migration to Bridgeport in 2014-2018: 976
- Migration from Bridgeport to Boston: 1,981 (#4 most common destination from Bridgeport)
- Net migration: 1,005 to Boston
- Migration from Bridgeport to Boston: 1,981 (#4 most common destination from Bridgeport)
- Net migration: 1,005 to Boston

20 / 50
Pixabay
#31. Austin-Round Rock, TX Metro Area
- Migration to Austin in 2014-2018: 982
- Migration from Austin to Boston: 308 (#46 most common destination from Austin)
- Net migration: 674 to Austin
- Migration from Austin to Boston: 308 (#46 most common destination from Austin)
- Net migration: 674 to Austin

21 / 50
Stuart Seeger // Wikicommons
#30. Portland-Vancouver-Hillsboro, OR-WA Metro Area
- Migration to Portland in 2014-2018: 994
- Migration from Portland to Boston: 369 (#45 most common destination from Portland)
- Net migration: 625 to Portland
- Migration from Portland to Boston: 369 (#45 most common destination from Portland)
- Net migration: 625 to Portland

22 / 50
Theresa Marconi // Wikimedia Commons
#29. Rochester, NY Metro Area
- Migration to Rochester in 2014-2018: 1,006
- Migration from Rochester to Boston: 690 (#9 most common destination from Rochester)
- Net migration: 316 to Rochester
- Migration from Rochester to Boston: 690 (#9 most common destination from Rochester)
- Net migration: 316 to Rochester

23 / 50
Sharkshock // Shutterstock
#28. Raleigh, NC Metro Area
- Migration to Raleigh in 2014-2018: 1,083
- Migration from Raleigh to Boston: 522 (#22 most common destination from Raleigh)
- Net migration: 561 to Raleigh
- Migration from Raleigh to Boston: 522 (#22 most common destination from Raleigh)
- Net migration: 561 to Raleigh

24 / 50
Famartin // Wikicommons
#27. Baltimore-Columbia-Towson, MD Metro Area
- Migration to Baltimore in 2014-2018: 1,119
- Migration from Baltimore to Boston: 1,434 (#10 most common destination from Baltimore)
- Net migration: 315 to Boston
- Migration from Baltimore to Boston: 1,434 (#10 most common destination from Baltimore)
- Net migration: 315 to Boston

25 / 50
BusinessEditorUSA // Wikimedia Commons
#26. Charlotte-Concord-Gastonia, NC-SC Metro Area
- Migration to Charlotte in 2014-2018: 1,233
- Migration from Charlotte to Boston: 578 (#33 most common destination from Charlotte)
- Net migration: 655 to Charlotte
- Migration from Charlotte to Boston: 578 (#33 most common destination from Charlotte)
- Net migration: 655 to Charlotte

26 / 50
Don Ramey Logan // Wikicommons
#25. San Jose-Sunnyvale-Santa Clara, CA Metro Area
- Migration to San Jose in 2014-2018: 1,265
- Migration from San Jose to Boston: 971 (#22 most common destination from San Jose)
- Net migration: 294 to San Jose
- Migration from San Jose to Boston: 971 (#22 most common destination from San Jose)
- Net migration: 294 to San Jose

27 / 50
f11photo // Shutterstock
#24. Denver-Aurora-Lakewood, CO Metro Area
- Migration to Denver in 2014-2018: 1,267
- Migration from Denver to Boston: 687 (#35 most common destination from Denver)
- Net migration: 580 to Denver
- Migration from Denver to Boston: 687 (#35 most common destination from Denver)
- Net migration: 580 to Denver

28 / 50
Songquan Deng // Shutterstock
#23. Orlando-Kissimmee-Sanford, FL Metro Area
- Migration to Orlando in 2014-2018: 1,304
- Migration from Orlando to Boston: 1,230 (#18 most common destination from Orlando)
- Net migration: 74 to Orlando
- Migration from Orlando to Boston: 1,230 (#18 most common destination from Orlando)
- Net migration: 74 to Orlando

29 / 50
Alan Botting // Wikimedia Commons
#22. Dallas-Fort Worth-Arlington, TX Metro Area
- Migration to Dallas in 2014-2018: 1,323
- Migration from Dallas to Boston: 1,071 (#42 most common destination from Dallas)
- Net migration: 252 to Dallas
- Migration from Dallas to Boston: 1,071 (#42 most common destination from Dallas)
- Net migration: 252 to Dallas

30 / 50
Wangkun Jia // Shutterstock
#21. Albany-Schenectady-Troy, NY Metro Area
- Migration to Albany in 2014-2018: 1,333
- Migration from Albany to Boston: 1,423 (#3 most common destination from Albany)
- Net migration: 90 to Boston
- Migration from Albany to Boston: 1,423 (#3 most common destination from Albany)
- Net migration: 90 to Boston

31 / 50
skeeze // Pixabay
#20. Houston-The Woodlands-Sugar Land, TX Metro Area
- Migration to Houston in 2014-2018: 1,356
- Migration from Houston to Boston: 957 (#31 most common destination from Houston)
- Net migration: 399 to Houston
- Migration from Houston to Boston: 957 (#31 most common destination from Houston)
- Net migration: 399 to Houston

32 / 50
Keizers // Wikimedia Commons
#19. Atlanta-Sandy Springs-Roswell, GA Metro Area
- Migration to Atlanta in 2014-2018: 1,568
- Migration from Atlanta to Boston: 1,796 (#23 most common destination from Atlanta)
- Net migration: 228 to Boston
- Migration from Atlanta to Boston: 1,796 (#23 most common destination from Atlanta)
- Net migration: 228 to Boston

33 / 50
SD Dirk // Flickr
#18. San Diego-Carlsbad, CA Metro Area
- Migration to San Diego in 2014-2018: 1,587
- Migration from San Diego to Boston: 1,553 (#18 most common destination from San Diego)
- Net migration: 34 to San Diego
- Migration from San Diego to Boston: 1,553 (#18 most common destination from San Diego)
- Net migration: 34 to San Diego

34 / 50
Albert Pego // Shutterstock
#17. Burlington-South Burlington, VT Metro Area
- Migration to Burlington in 2014-2018: 1,715
- Migration from Burlington to Boston: 758 (#1 most common destination from Burlington)
- Net migration: 957 to Burlington
- Migration from Burlington to Boston: 758 (#1 most common destination from Burlington)
- Net migration: 957 to Burlington

35 / 50
Alvesgaspar // Wikimedia
#16. Tampa-St. Petersburg-Clearwater, FL Metro Area
- Migration to Tampa in 2014-2018: 1,800
- Migration from Tampa to Boston: 768 (#30 most common destination from Tampa)
- Net migration: 1,032 to Tampa
- Migration from Tampa to Boston: 768 (#30 most common destination from Tampa)
- Net migration: 1,032 to Tampa

36 / 50
John Phelan // Wikimedia
#15. Hartford-West Hartford-East Hartford, CT Metro Area
- Migration to Hartford in 2014-2018: 1,919
- Migration from Hartford to Boston: 2,666 (#2 most common destination from Hartford)
- Net migration: 747 to Boston
- Migration from Hartford to Boston: 2,666 (#2 most common destination from Hartford)
- Net migration: 747 to Boston
37 / 50
Public Domain
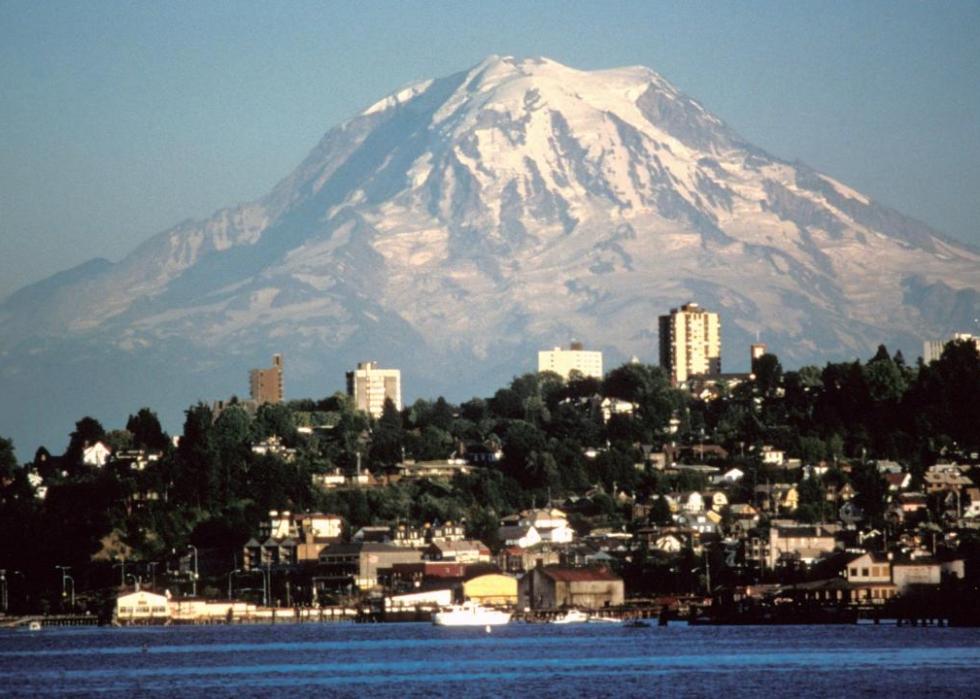
#14. Seattle-Tacoma-Bellevue, WA Metro Area
- Migration to Seattle in 2014-2018: 2,358
- Migration from Seattle to Boston: 1,001 (#33 most common destination from Seattle)
- Net migration: 1,357 to Seattle
- Migration from Seattle to Boston: 1,001 (#33 most common destination from Seattle)
- Net migration: 1,357 to Seattle

38 / 50
Christopher & Amy Esposito // Wikicommons
#13. Chicago-Naperville-Elgin, IL-IN-WI Metro Area
- Migration to Chicago in 2014-2018: 2,677
- Migration from Chicago to Boston: 2,939 (#24 most common destination from Chicago)
- Net migration: 262 to Boston
- Migration from Chicago to Boston: 2,939 (#24 most common destination from Chicago)
- Net migration: 262 to Boston

39 / 50
ktr101 // Wikimedia
#12. Barnstable Town, MA Metro Area
- Migration to Barnstable Town in 2014-2018: 2,834
- Migration from Barnstable Town to Boston: 3,149 (#1 most common destination from Barnstable Town)
- Net migration: 315 to Boston
- Migration from Barnstable Town to Boston: 3,149 (#1 most common destination from Barnstable Town)
- Net migration: 315 to Boston

40 / 50
en:User:Paul.h // Wikimedia
#11. San Francisco-Oakland-Hayward, CA Metro Area
- Migration to San Francisco in 2014-2018: 2,929
- Migration from San Francisco to Boston: 2,937 (#16 most common destination from San Francisco)
- Net migration: 8 to Boston
- Migration from San Francisco to Boston: 2,937 (#16 most common destination from San Francisco)
- Net migration: 8 to Boston

41 / 50
f11photo // Shutterstock
#10. Philadelphia-Camden-Wilmington, PA-NJ-DE-MD Metro Area
- Migration to Philadelphia in 2014-2018: 2,962
- Migration from Philadelphia to Boston: 3,872 (#8 most common destination from Philadelphia)
- Net migration: 910 to Boston
- Migration from Philadelphia to Boston: 3,872 (#8 most common destination from Philadelphia)
- Net migration: 910 to Boston

42 / 50
Andrew Bossi // Wikimedia
#9. Washington-Arlington-Alexandria, DC-VA-MD-WV Metro Area
- Migration to Washington in 2014-2018: 4,395
- Migration from Washington to Boston: 4,705 (#8 most common destination from Washington)
- Net migration: 310 to Boston
- Migration from Washington to Boston: 4,705 (#8 most common destination from Washington)
- Net migration: 310 to Boston

43 / 50
BDS2006 // Wikimedia
#8. Los Angeles-Long Beach-Anaheim, CA Metro Area
- Migration to Los Angeles in 2014-2018: 4,500
- Migration from Los Angeles to Boston: 3,467 (#19 most common destination from Los Angeles)
- Net migration: 1,033 to Los Angeles
- Migration from Los Angeles to Boston: 3,467 (#19 most common destination from Los Angeles)
- Net migration: 1,033 to Los Angeles

44 / 50
Kolossos // Wikimedia Commons
#7. Miami-Fort Lauderdale-West Palm Beach, FL Metro Area
- Migration to Miami in 2014-2018: 4,623
- Migration from Miami to Boston: 2,745 (#13 most common destination from Miami)
- Net migration: 1,878 to Miami
- Migration from Miami to Boston: 2,745 (#13 most common destination from Miami)
- Net migration: 1,878 to Miami

45 / 50
Joseph Sohm // Shutterstock
#6. Portland-South Portland, ME Metro Area
- Migration to Portland in 2014-2018: 4,669
- Migration from Portland to Boston: 3,191 (#1 most common destination from Portland)
- Net migration: 1,478 to Portland
- Migration from Portland to Boston: 3,191 (#1 most common destination from Portland)
- Net migration: 1,478 to Portland

46 / 50
John Phelan // Wikimedia Commons
#5. Springfield, MA Metro Area
- Migration to Springfield in 2014-2018: 7,594
- Migration from Springfield to Boston: 4,795 (#1 most common destination from Springfield)
- Net migration: 2,799 to Springfield
- Migration from Springfield to Boston: 4,795 (#1 most common destination from Springfield)
- Net migration: 2,799 to Springfield

47 / 50
King of Hearts // Wikimedia
#4. New York-Newark-Jersey City, NY-NJ-PA Metro Area
- Migration to New York in 2014-2018: 9,565
- Migration from New York to Boston: 16,264 (#3 most common destination from New York)
- Net migration: 6,699 to Boston
- Migration from New York to Boston: 16,264 (#3 most common destination from New York)
- Net migration: 6,699 to Boston

48 / 50
Sean Pavone // Shutterstock
#3. Manchester-Nashua, NH Metro Area
- Migration to Manchester in 2014-2018: 10,384
- Migration from Manchester to Boston: 5,628 (#1 most common destination from Manchester)
- Net migration: 4,756 to Manchester
- Migration from Manchester to Boston: 5,628 (#1 most common destination from Manchester)
- Net migration: 4,756 to Manchester

49 / 50
John Phelan // Wikimedia
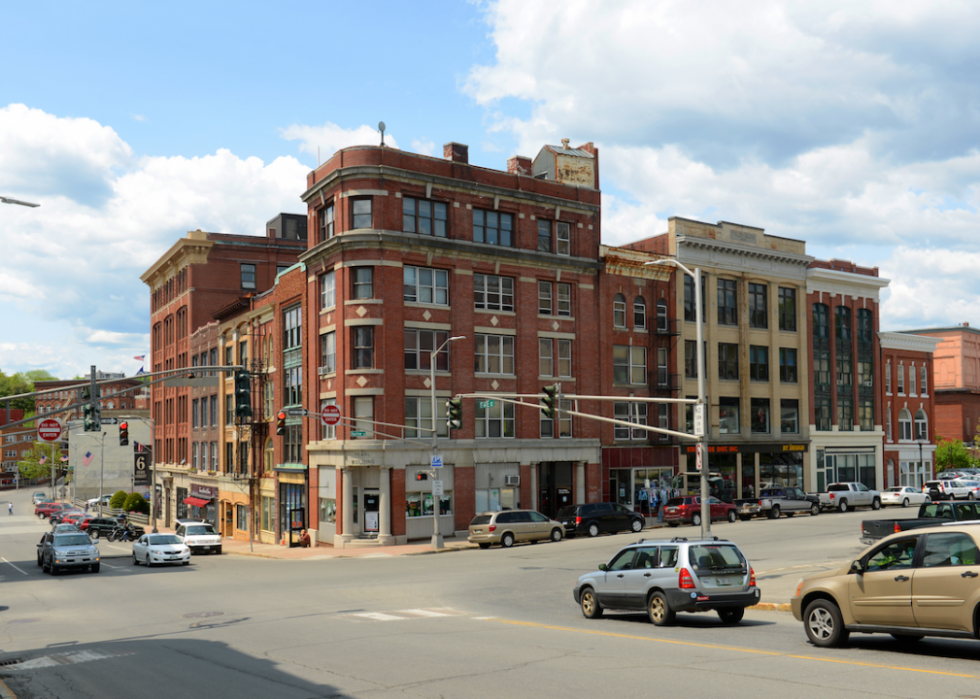
#2. Worcester, MA-CT Metro Area
- Migration to Worcester in 2014-2018: 13,683
- Migration from Worcester to Boston: 11,420 (#1 most common destination from Worcester)
- Net migration: 2,263 to Worcester
- Migration from Worcester to Boston: 11,420 (#1 most common destination from Worcester)
- Net migration: 2,263 to Worcester

50 / 50
spablab // Flickr
#1. Providence-Warwick, RI-MA Metro Area
- Migration to Providence in 2014-2018: 17,188
- Migration from Providence to Boston: 12,145 (#1 most common destination from Providence)
- Net migration: 5,043 to Providence
- Migration from Providence to Boston: 12,145 (#1 most common destination from Providence)
- Net migration: 5,043 to Providence


