
Where people in Detroit are moving to most
Written by:
April 18, 2021
PhotosByMahin // Pixabay
Where people in Detroit are moving to most
Stacker compiled a list of where people in Detroit are moving to the most using data from the U.S. Census Bureau. Metros are ranked by the estimated number of people who moved to the metro from Detroit between 2014 and 2018. Ties were broken by gross migration.

1 / 50
Chris Watson // Wikicommons
#50. Louisville/Jefferson County, KY-IN Metro Area
- Migration to Louisville/Jefferson County in 2014-2018: 423
- Migration from Louisville/Jefferson County to Detroit: 522 (#9 most common destination from Louisville/Jefferson County)
- Net migration: 99 to Detroit
- Migration from Louisville/Jefferson County to Detroit: 522 (#9 most common destination from Louisville/Jefferson County)
- Net migration: 99 to Detroit

2 / 50
VisitCentralFL // Flickr
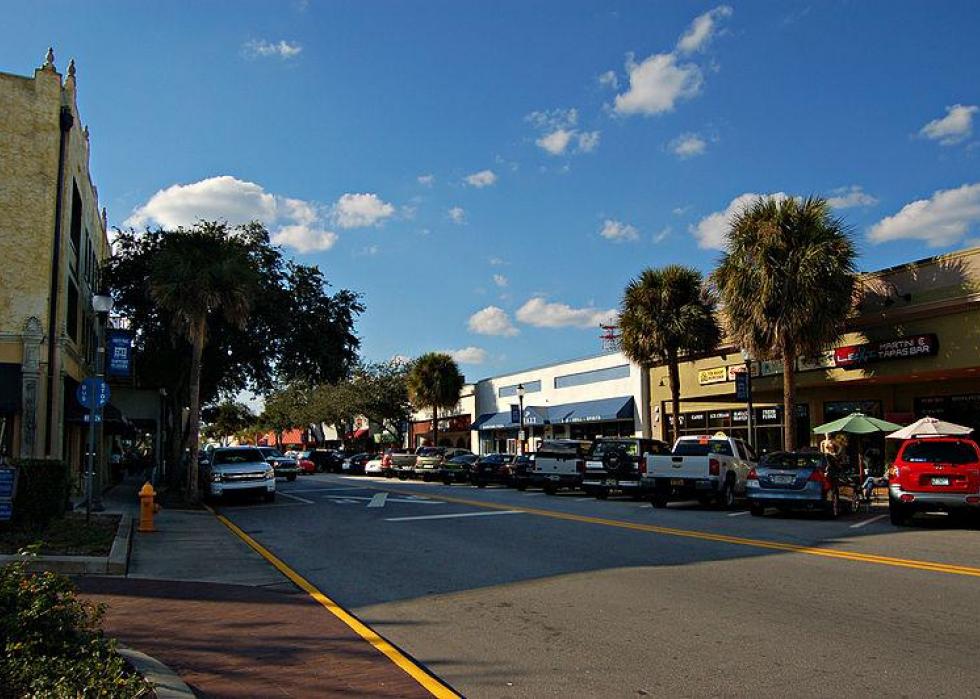
#49. Lakeland-Winter Haven, FL Metro Area
- Migration to Lakeland in 2014-2018: 425
- Migration from Lakeland to Detroit: 83 (#52 most common destination from Lakeland)
- Net migration: 342 to Lakeland
- Migration from Lakeland to Detroit: 83 (#52 most common destination from Lakeland)
- Net migration: 342 to Lakeland
3 / 50
MicheleHaro // Wikimedia
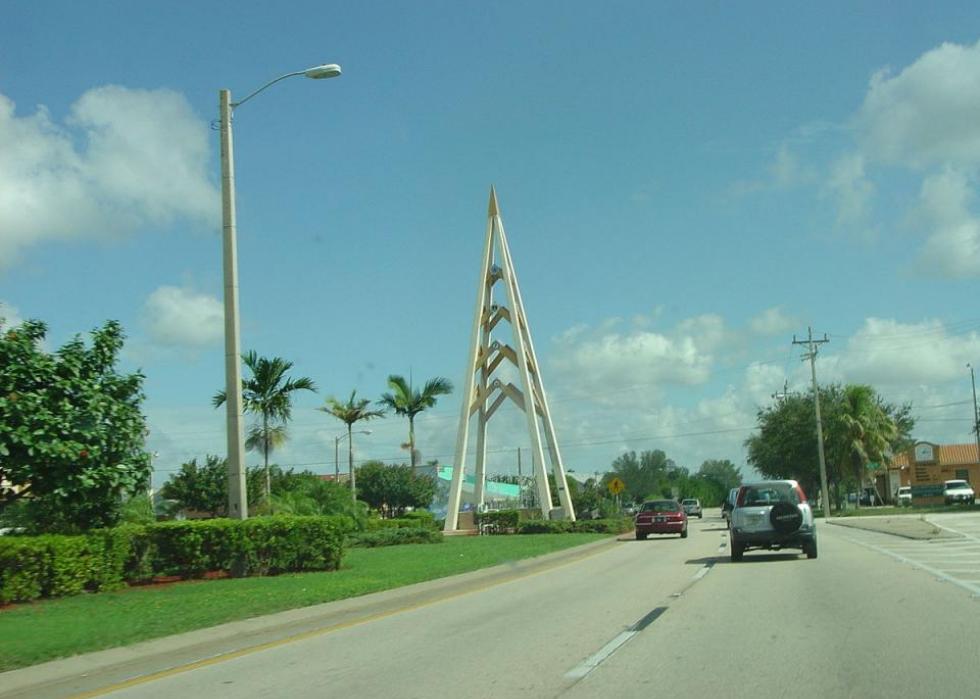
#48. Palm Bay-Melbourne-Titusville, FL Metro Area
- Migration to Palm Bay in 2014-2018: 431
- Migration from Palm Bay to Detroit: 185 (#27 most common destination from Palm Bay)
- Net migration: 246 to Palm Bay
- Migration from Palm Bay to Detroit: 185 (#27 most common destination from Palm Bay)
- Net migration: 246 to Palm Bay

4 / 50
David Wilson // Flickr
#47. Knoxville, TN Metro Area
- Migration to Knoxville in 2014-2018: 438
- Migration from Knoxville to Detroit: 317 (#17 most common destination from Knoxville)
- Net migration: 121 to Knoxville
- Migration from Knoxville to Detroit: 317 (#17 most common destination from Knoxville)
- Net migration: 121 to Knoxville

5 / 50
Jdcollins13 // Wikimedia Commons
#46. Jacksonville, NC Metro Area
- Migration to Jacksonville in 2014-2018: 459
- Migration from Jacksonville to Detroit: 49 (#89 most common destination from Jacksonville)
- Net migration: 410 to Jacksonville
- Migration from Jacksonville to Detroit: 49 (#89 most common destination from Jacksonville)
- Net migration: 410 to Jacksonville

6 / 50
TommyBrison // Shutterstock
#45. Kansas City, MO-KS Metro Area
- Migration to Kansas City in 2014-2018: 467
- Migration from Kansas City to Detroit: 244 (#57 most common destination from Kansas City)
- Net migration: 223 to Kansas City
- Migration from Kansas City to Detroit: 244 (#57 most common destination from Kansas City)
- Net migration: 223 to Kansas City

7 / 50
Sherry V Smith // Shutterstock
#44. Virginia Beach-Norfolk-Newport News, VA-NC Metro Area
- Migration to Virginia Beach in 2014-2018: 471
- Migration from Virginia Beach to Detroit: 422 (#42 most common destination from Virginia Beach)
- Net migration: 49 to Virginia Beach
- Migration from Virginia Beach to Detroit: 422 (#42 most common destination from Virginia Beach)
- Net migration: 49 to Virginia Beach

8 / 50
Pixabay
#43. Austin-Round Rock, TX Metro Area
- Migration to Austin in 2014-2018: 481
- Migration from Austin to Detroit: 252 (#56 most common destination from Austin)
- Net migration: 229 to Austin
- Migration from Austin to Detroit: 252 (#56 most common destination from Austin)
- Net migration: 229 to Austin

9 / 50
AndrewAvitus // Wikicommons'
#42. Jacksonville, FL Metro Area
- Migration to Jacksonville in 2014-2018: 492
- Migration from Jacksonville to Detroit: 536 (#24 most common destination from Jacksonville)
- Net migration: 44 to Detroit
- Migration from Jacksonville to Detroit: 536 (#24 most common destination from Jacksonville)
- Net migration: 44 to Detroit

10 / 50
Tony Webster // Wikicommons
#41. Minneapolis-St. Paul-Bloomington, MN-WI Metro Area
- Migration to Minneapolis in 2014-2018: 499
- Migration from Minneapolis to Detroit: 228 (#69 most common destination from Minneapolis)
- Net migration: 271 to Minneapolis
- Migration from Minneapolis to Detroit: 228 (#69 most common destination from Minneapolis)
- Net migration: 271 to Minneapolis

11 / 50
Daniel Orth // Flickr
#40. Riverside-San Bernardino-Ontario, CA Metro Area
- Migration to Riverside in 2014-2018: 545
- Migration from Riverside to Detroit: 435 (#53 most common destination from Riverside)
- Net migration: 110 to Riverside
- Migration from Riverside to Detroit: 435 (#53 most common destination from Riverside)
- Net migration: 110 to Riverside

12 / 50
Sean Pavone // Shutterstock
#39. St. Louis, MO-IL Metro Area
- Migration to St. Louis in 2014-2018: 562
- Migration from St. Louis to Detroit: 567 (#34 most common destination from St. Louis)
- Net migration: 5 to Detroit
- Migration from St. Louis to Detroit: 567 (#34 most common destination from St. Louis)
- Net migration: 5 to Detroit

13 / 50
Tysto // Wikimedia Commons
#38. Dayton, OH Metro Area
- Migration to Dayton in 2014-2018: 574
- Migration from Dayton to Detroit: 193 (#27 most common destination from Dayton)
- Net migration: 381 to Dayton
- Migration from Dayton to Detroit: 193 (#27 most common destination from Dayton)
- Net migration: 381 to Dayton

14 / 50
Canva
#37. Cincinnati, OH-KY-IN Metro Area
- Migration to Cincinnati in 2014-2018: 576
- Migration from Cincinnati to Detroit: 398 (#33 most common destination from Cincinnati)
- Net migration: 178 to Cincinnati
- Migration from Cincinnati to Detroit: 398 (#33 most common destination from Cincinnati)
- Net migration: 178 to Cincinnati

15 / 50
Quibik // Wikimedia Commons
#36. Battle Creek, MI Metro Area
- Migration to Battle Creek in 2014-2018: 579
- Migration from Battle Creek to Detroit: 556 (#3 most common destination from Battle Creek)
- Net migration: 23 to Battle Creek
- Migration from Battle Creek to Detroit: 556 (#3 most common destination from Battle Creek)
- Net migration: 23 to Battle Creek

16 / 50
NOAA Great Lakes Envorinmental Ressearch Laboritory // Flickr
#35. Muskegon, MI Metro Area
- Migration to Muskegon in 2014-2018: 589
- Migration from Muskegon to Detroit: 617 (#2 most common destination from Muskegon)
- Net migration: 28 to Detroit
- Migration from Muskegon to Detroit: 617 (#2 most common destination from Muskegon)
- Net migration: 28 to Detroit

17 / 50
f11photo // Shutterstock
#34. Philadelphia-Camden-Wilmington, PA-NJ-DE-MD Metro Area
- Migration to Philadelphia in 2014-2018: 590
- Migration from Philadelphia to Detroit: 805 (#40 most common destination from Philadelphia)
- Net migration: 215 to Detroit
- Migration from Philadelphia to Detroit: 805 (#40 most common destination from Philadelphia)
- Net migration: 215 to Detroit

18 / 50
Sean Pavone // Shutterstock
#33. Indianapolis-Carmel-Anderson, IN Metro Area
- Migration to Indianapolis in 2014-2018: 605
- Migration from Indianapolis to Detroit: 494 (#29 most common destination from Indianapolis)
- Net migration: 111 to Indianapolis
- Migration from Indianapolis to Detroit: 494 (#29 most common destination from Indianapolis)
- Net migration: 111 to Indianapolis

19 / 50
FloridaStock // Shutterstock
#32. Naples-Immokalee-Marco Island, FL Metro Area
- Migration to Naples in 2014-2018: 628
- Migration from Naples to Detroit: 140 (#25 most common destination from Naples)
- Net migration: 488 to Naples
- Migration from Naples to Detroit: 140 (#25 most common destination from Naples)
- Net migration: 488 to Naples
20 / 50
Sanibel Sun // WikiCommons
#31. Cape Coral-Fort Myers, FL Metro Area
- Migration to Cape Coral in 2014-2018: 648
- Migration from Cape Coral to Detroit: 316 (#14 most common destination from Cape Coral)
- Net migration: 332 to Cape Coral
- Migration from Cape Coral to Detroit: 316 (#14 most common destination from Cape Coral)
- Net migration: 332 to Cape Coral

21 / 50
Pat McGinley // Shutterstock
#30. North Port-Sarasota-Bradenton, FL Metro Area
- Migration to North Port in 2014-2018: 718
- Migration from North Port to Detroit: 534 (#12 most common destination from North Port)
- Net migration: 184 to North Port
- Migration from North Port to Detroit: 534 (#12 most common destination from North Port)
- Net migration: 184 to North Port
22 / 50
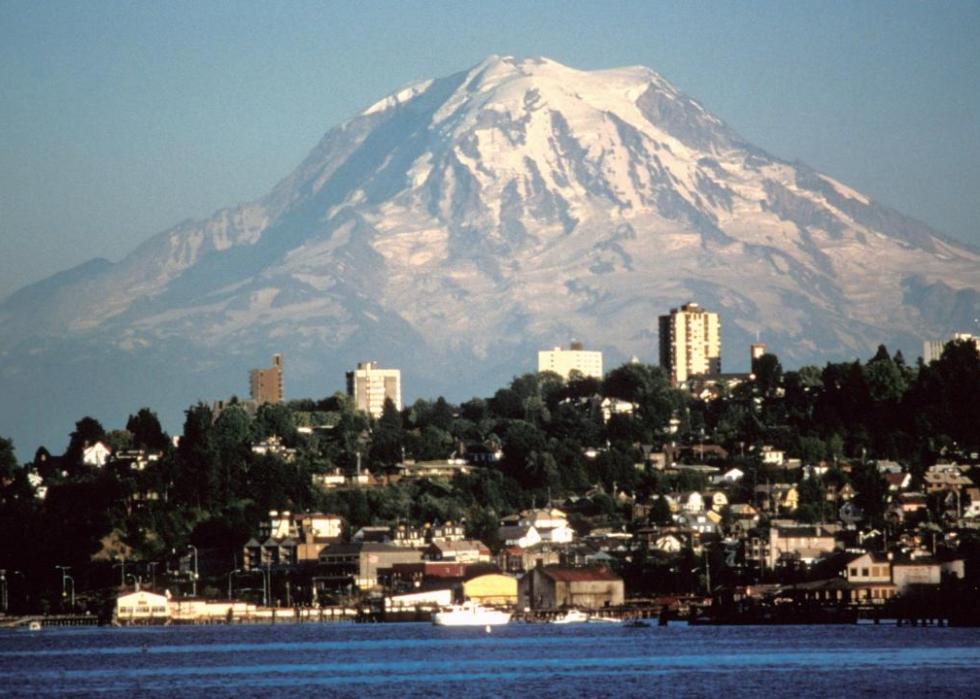
Public Domain
#29. Seattle-Tacoma-Bellevue, WA Metro Area
- Migration to Seattle in 2014-2018: 729
- Migration from Seattle to Detroit: 663 (#46 most common destination from Seattle)
- Net migration: 66 to Seattle
- Migration from Seattle to Detroit: 663 (#46 most common destination from Seattle)
- Net migration: 66 to Seattle

23 / 50
en:User:Paul.h // Wikimedia
#28. San Francisco-Oakland-Hayward, CA Metro Area
- Migration to San Francisco in 2014-2018: 739
- Migration from San Francisco to Detroit: 530 (#47 most common destination from San Francisco)
- Net migration: 209 to San Francisco
- Migration from San Francisco to Detroit: 530 (#47 most common destination from San Francisco)
- Net migration: 209 to San Francisco

24 / 50
BusinessEditorUSA // Wikimedia Commons
#27. Charlotte-Concord-Gastonia, NC-SC Metro Area
- Migration to Charlotte in 2014-2018: 740
- Migration from Charlotte to Detroit: 452 (#39 most common destination from Charlotte)
- Net migration: 288 to Charlotte
- Migration from Charlotte to Detroit: 452 (#39 most common destination from Charlotte)
- Net migration: 288 to Charlotte

25 / 50
f11photo // Shutterstock
#26. Nashville-Davidson--Murfreesboro--Franklin, TN Metro Area
- Migration to Nashville in 2014-2018: 781
- Migration from Nashville to Detroit: 679 (#15 most common destination from Nashville)
- Net migration: 102 to Nashville
- Migration from Nashville to Detroit: 679 (#15 most common destination from Nashville)
- Net migration: 102 to Nashville

26 / 50
f11photo // Shutterstock
#25. Denver-Aurora-Lakewood, CO Metro Area
- Migration to Denver in 2014-2018: 806
- Migration from Denver to Detroit: 379 (#60 most common destination from Denver)
- Net migration: 427 to Denver
- Migration from Denver to Detroit: 379 (#60 most common destination from Denver)
- Net migration: 427 to Denver

27 / 50
randy andy // Shutterstock
#24. Las Vegas-Henderson-Paradise, NV Metro Area
- Migration to Las Vegas in 2014-2018: 845
- Migration from Las Vegas to Detroit: 653 (#24 most common destination from Las Vegas)
- Net migration: 192 to Las Vegas
- Migration from Las Vegas to Detroit: 653 (#24 most common destination from Las Vegas)
- Net migration: 192 to Las Vegas

28 / 50
Canva
#23. Cleveland-Elyria, OH Metro Area
- Migration to Cleveland in 2014-2018: 910
- Migration from Cleveland to Detroit: 875 (#15 most common destination from Cleveland)
- Net migration: 35 to Cleveland
- Migration from Cleveland to Detroit: 875 (#15 most common destination from Cleveland)
- Net migration: 35 to Cleveland

29 / 50
Sean Pavone // Shutterstock
#22. Columbus, OH Metro Area
- Migration to Columbus in 2014-2018: 923
- Migration from Columbus to Detroit: 622 (#21 most common destination from Columbus)
- Net migration: 301 to Columbus
- Migration from Columbus to Detroit: 622 (#21 most common destination from Columbus)
- Net migration: 301 to Columbus

30 / 50
Songquan Deng // Shutterstock
#21. Orlando-Kissimmee-Sanford, FL Metro Area
- Migration to Orlando in 2014-2018: 1,072
- Migration from Orlando to Detroit: 414 (#44 most common destination from Orlando)
- Net migration: 658 to Orlando
- Migration from Orlando to Detroit: 414 (#44 most common destination from Orlando)
- Net migration: 658 to Orlando

31 / 50
SD Dirk // Flickr
#20. San Diego-Carlsbad, CA Metro Area
- Migration to San Diego in 2014-2018: 1,083
- Migration from San Diego to Detroit: 711 (#41 most common destination from San Diego)
- Net migration: 372 to San Diego
- Migration from San Diego to Detroit: 711 (#41 most common destination from San Diego)
- Net migration: 372 to San Diego

32 / 50
BDS2006 // Wikimedia
#19. Los Angeles-Long Beach-Anaheim, CA Metro Area
- Migration to Los Angeles in 2014-2018: 1,165
- Migration from Los Angeles to Detroit: 1,173 (#45 most common destination from Los Angeles)
- Net migration: 8 to Detroit
- Migration from Los Angeles to Detroit: 1,173 (#45 most common destination from Los Angeles)
- Net migration: 8 to Detroit

33 / 50
Alan Botting // Wikimedia Commons
#18. Dallas-Fort Worth-Arlington, TX Metro Area
- Migration to Dallas in 2014-2018: 1,236
- Migration from Dallas to Detroit: 916 (#49 most common destination from Dallas)
- Net migration: 320 to Dallas
- Migration from Dallas to Detroit: 916 (#49 most common destination from Dallas)
- Net migration: 320 to Dallas

34 / 50
Dhacim // Wikicommons
#17. Saginaw, MI Metro Area
- Migration to Saginaw in 2014-2018: 1,280
- Migration from Saginaw to Detroit: 1,529 (#1 most common destination from Saginaw)
- Net migration: 249 to Detroit
- Migration from Saginaw to Detroit: 1,529 (#1 most common destination from Saginaw)
- Net migration: 249 to Detroit

35 / 50
Kolossos // Wikimedia Commons
#16. Miami-Fort Lauderdale-West Palm Beach, FL Metro Area
- Migration to Miami in 2014-2018: 1,316
- Migration from Miami to Detroit: 1,201 (#27 most common destination from Miami)
- Net migration: 115 to Miami
- Migration from Miami to Detroit: 1,201 (#27 most common destination from Miami)
- Net migration: 115 to Miami

36 / 50
Andrew Bossi // Wikimedia
#15. Washington-Arlington-Alexandria, DC-VA-MD-WV Metro Area
- Migration to Washington in 2014-2018: 1,351
- Migration from Washington to Detroit: 964 (#52 most common destination from Washington)
- Net migration: 387 to Washington
- Migration from Washington to Detroit: 964 (#52 most common destination from Washington)
- Net migration: 387 to Washington

37 / 50
Michael Shake // Shutterstock
#14. Toledo, OH Metro Area
- Migration to Toledo in 2014-2018: 1,366
- Migration from Toledo to Detroit: 830 (#5 most common destination from Toledo)
- Net migration: 536 to Toledo
- Migration from Toledo to Detroit: 830 (#5 most common destination from Toledo)
- Net migration: 536 to Toledo

38 / 50
skeeze // Pixabay
#13. Houston-The Woodlands-Sugar Land, TX Metro Area
- Migration to Houston in 2014-2018: 1,433
- Migration from Houston to Detroit: 683 (#46 most common destination from Houston)
- Net migration: 750 to Houston
- Migration from Houston to Detroit: 683 (#46 most common destination from Houston)
- Net migration: 750 to Houston

39 / 50
King of Hearts // Wikimedia
#12. New York-Newark-Jersey City, NY-NJ-PA Metro Area
- Migration to New York in 2014-2018: 1,444
- Migration from New York to Detroit: 2,360 (#48 most common destination from New York)
- Net migration: 916 to Detroit
- Migration from New York to Detroit: 2,360 (#48 most common destination from New York)
- Net migration: 916 to Detroit

40 / 50
Phillip L. Hofmeister // Wikimedia Commons
#11. Jackson, MI Metro Area
- Migration to Jackson in 2014-2018: 1,854
- Migration from Jackson to Detroit: 1,106 (#1 most common destination from Jackson)
- Net migration: 748 to Jackson
- Migration from Jackson to Detroit: 1,106 (#1 most common destination from Jackson)
- Net migration: 748 to Jackson

41 / 50
Keizers // Wikimedia Commons
#10. Atlanta-Sandy Springs-Roswell, GA Metro Area
- Migration to Atlanta in 2014-2018: 1,968
- Migration from Atlanta to Detroit: 1,785 (#24 most common destination from Atlanta)
- Net migration: 183 to Atlanta
- Migration from Atlanta to Detroit: 1,785 (#24 most common destination from Atlanta)
- Net migration: 183 to Atlanta

42 / 50
DPPed// Wikimedia
#9. Phoenix-Mesa-Scottsdale, AZ Metro Area
- Migration to Phoenix in 2014-2018: 2,265
- Migration from Phoenix to Detroit: 1,093 (#29 most common destination from Phoenix)
- Net migration: 1,172 to Phoenix
- Migration from Phoenix to Detroit: 1,093 (#29 most common destination from Phoenix)
- Net migration: 1,172 to Phoenix

43 / 50
Alvesgaspar // Wikimedia
#8. Tampa-St. Petersburg-Clearwater, FL Metro Area
- Migration to Tampa in 2014-2018: 2,291
- Migration from Tampa to Detroit: 852 (#25 most common destination from Tampa)
- Net migration: 1,439 to Tampa
- Migration from Tampa to Detroit: 852 (#25 most common destination from Tampa)
- Net migration: 1,439 to Tampa

44 / 50
Mxobe//Wikicommons
#7. Kalamazoo-Portage, MI Metro Area
- Migration to Kalamazoo in 2014-2018: 2,451
- Migration from Kalamazoo to Detroit: 1,321 (#2 most common destination from Kalamazoo)
- Net migration: 1,130 to Kalamazoo
- Migration from Kalamazoo to Detroit: 1,321 (#2 most common destination from Kalamazoo)
- Net migration: 1,130 to Kalamazoo

45 / 50
Notorious4life // Wikimedia Commons
#6. Monroe, MI Metro Area
- Migration to Monroe in 2014-2018: 2,536
- Migration from Monroe to Detroit: 1,771 (#1 most common destination from Monroe)
- Net migration: 765 to Monroe
- Migration from Monroe to Detroit: 1,771 (#1 most common destination from Monroe)
- Net migration: 765 to Monroe

46 / 50
Christopher & Amy Esposito // Wikicommons
#5. Chicago-Naperville-Elgin, IL-IN-WI Metro Area
- Migration to Chicago in 2014-2018: 2,882
- Migration from Chicago to Detroit: 3,562 (#19 most common destination from Chicago)
- Net migration: 680 to Detroit
- Migration from Chicago to Detroit: 3,562 (#19 most common destination from Chicago)
- Net migration: 680 to Detroit

47 / 50
Flintmichigan // Wikicommons
#4. Flint, MI Metro Area
- Migration to Flint in 2014-2018: 5,416
- Migration from Flint to Detroit: 5,623 (#1 most common destination from Flint)
- Net migration: 207 to Detroit
- Migration from Flint to Detroit: 5,623 (#1 most common destination from Flint)
- Net migration: 207 to Detroit

48 / 50
Grguy2011 // Wikimedia Commons
#3. Grand Rapids-Wyoming, MI Metro Area
- Migration to Grand Rapids in 2014-2018: 6,384
- Migration from Grand Rapids to Detroit: 2,936 (#2 most common destination from Grand Rapids)
- Net migration: 3,448 to Grand Rapids
- Migration from Grand Rapids to Detroit: 2,936 (#2 most common destination from Grand Rapids)
- Net migration: 3,448 to Grand Rapids

49 / 50
Jeffness // Wikimedia Commons
#2. Lansing-East Lansing, MI Metro Area
- Migration to Lansing in 2014-2018: 7,826
- Migration from Lansing to Detroit: 3,631 (#1 most common destination from Lansing)
- Net migration: 4,195 to Lansing
- Migration from Lansing to Detroit: 3,631 (#1 most common destination from Lansing)
- Net migration: 4,195 to Lansing

50 / 50
AndrewHorne // Wikimedia Commons
#1. Ann Arbor, MI Metro Area
- Migration to Ann Arbor in 2014-2018: 11,848
- Migration from Ann Arbor to Detroit: 9,113 (#1 most common destination from Ann Arbor)
- Net migration: 2,735 to Ann Arbor
- Migration from Ann Arbor to Detroit: 9,113 (#1 most common destination from Ann Arbor)
- Net migration: 2,735 to Ann Arbor


