
Where people in El Paso are moving to most
Written by:
April 18, 2021
Epccedu // Wikimedia Commons
Where people in El Paso are moving to most
Stacker compiled a list of where people in El Paso are moving to the most using data from the U.S. Census Bureau. Metros are ranked by the estimated number of people who moved to the metro from El Paso between 2014 and 2018. Ties were broken by gross migration.

1 / 50
Kolossos // Wikimedia Commons
#50. Miami-Fort Lauderdale-West Palm Beach, FL Metro Area
- Migration to Miami in 2014-2018: 178
- Migration from Miami to El Paso: 289 (#88 most common destination from Miami)
- Net migration: 111 to El Paso
- Migration from Miami to El Paso: 289 (#88 most common destination from Miami)
- Net migration: 111 to El Paso

2 / 50
Kevin Ruck // Shutterstock
#49. Augusta-Richmond County, GA-SC Metro Area
- Migration to Augusta in 2014-2018: 193
- Migration from Augusta to El Paso: 65 (#76 most common destination from Augusta)
- Net migration: 128 to Augusta
- Migration from Augusta to El Paso: 65 (#76 most common destination from Augusta)
- Net migration: 128 to Augusta

3 / 50
Sean Pavone // Shutterstock
#48. Boston-Cambridge-Newton, MA-NH Metro Area
- Migration to Boston in 2014-2018: 200
- Migration from Boston to El Paso: 212 (#92 most common destination from Boston)
- Net migration: 12 to El Paso
- Migration from Boston to El Paso: 212 (#92 most common destination from Boston)
- Net migration: 12 to El Paso

4 / 50
randy andy // Shutterstock
#47. Las Vegas-Henderson-Paradise, NV Metro Area
- Migration to Las Vegas in 2014-2018: 202
- Migration from Las Vegas to El Paso: 369 (#43 most common destination from Las Vegas)
- Net migration: 167 to El Paso
- Migration from Las Vegas to El Paso: 369 (#43 most common destination from Las Vegas)
- Net migration: 167 to El Paso

5 / 50
Scott Catron // Wikimedia Commons
#46. Ogden-Clearfield, UT Metro Area
- Migration to Ogden in 2014-2018: 208
- Migration from Ogden to El Paso: 0
- Net migration: 208 to Ogden
- Migration from Ogden to El Paso: 0
- Net migration: 208 to Ogden

6 / 50
Alvesgaspar // Wikimedia
#45. Tampa-St. Petersburg-Clearwater, FL Metro Area
- Migration to Tampa in 2014-2018: 208
- Migration from Tampa to El Paso: 90 (#147 most common destination from Tampa)
- Net migration: 118 to Tampa
- Migration from Tampa to El Paso: 90 (#147 most common destination from Tampa)
- Net migration: 118 to Tampa

7 / 50
f11photo // Shutterstock
#44. Philadelphia-Camden-Wilmington, PA-NJ-DE-MD Metro Area
- Migration to Philadelphia in 2014-2018: 217
- Migration from Philadelphia to El Paso: 108 (#149 most common destination from Philadelphia)
- Net migration: 109 to Philadelphia
- Migration from Philadelphia to El Paso: 108 (#149 most common destination from Philadelphia)
- Net migration: 109 to Philadelphia

8 / 50
Joe Mabel // Wikicommons
#43. Olympia-Tumwater, WA Metro Area
- Migration to Olympia in 2014-2018: 225
- Migration from Olympia to El Paso: 400 (#4 most common destination from Olympia)
- Net migration: 175 to El Paso
- Migration from Olympia to El Paso: 400 (#4 most common destination from Olympia)
- Net migration: 175 to El Paso

9 / 50
AndrewAvitus // Wikicommons'
#42. Jacksonville, FL Metro Area
- Migration to Jacksonville in 2014-2018: 235
- Migration from Jacksonville to El Paso: 31 (#177 most common destination from Jacksonville)
- Net migration: 204 to Jacksonville
- Migration from Jacksonville to El Paso: 31 (#177 most common destination from Jacksonville)
- Net migration: 204 to Jacksonville

10 / 50
Barbara Brannon//Flickr
#41. Abilene, TX Metro Area
- Migration to Abilene in 2014-2018: 235
- Migration from Abilene to El Paso: 58 (#29 most common destination from Abilene)
- Net migration: 177 to Abilene
- Migration from Abilene to El Paso: 58 (#29 most common destination from Abilene)
- Net migration: 177 to Abilene

11 / 50
Sherry V Smith // Shutterstock
#40. Virginia Beach-Norfolk-Newport News, VA-NC Metro Area
- Migration to Virginia Beach in 2014-2018: 239
- Migration from Virginia Beach to El Paso: 94 (#131 most common destination from Virginia Beach)
- Net migration: 145 to Virginia Beach
- Migration from Virginia Beach to El Paso: 94 (#131 most common destination from Virginia Beach)
- Net migration: 145 to Virginia Beach

12 / 50
Pixabay
#39. Savannah, GA Metro Area
- Migration to Savannah in 2014-2018: 242
- Migration from Savannah to El Paso: 72 (#65 most common destination from Savannah)
- Net migration: 170 to Savannah
- Migration from Savannah to El Paso: 72 (#65 most common destination from Savannah)
- Net migration: 170 to Savannah

13 / 50
Ron Cogswell//Wikicommons
#38. Richmond, VA Metro Area
- Migration to Richmond in 2014-2018: 245
- Migration from Richmond to El Paso: 184 (#48 most common destination from Richmond)
- Net migration: 61 to Richmond
- Migration from Richmond to El Paso: 184 (#48 most common destination from Richmond)
- Net migration: 61 to Richmond

14 / 50
Akhenaton06 // Wikicommons
#37. Columbia, SC Metro Area
- Migration to Columbia in 2014-2018: 247
- Migration from Columbia to El Paso: 267 (#25 most common destination from Columbia)
- Net migration: 20 to El Paso
- Migration from Columbia to El Paso: 267 (#25 most common destination from Columbia)
- Net migration: 20 to El Paso

15 / 50
Zereshk // Wikimedia
#36. Tucson, AZ Metro Area
- Migration to Tucson in 2014-2018: 249
- Migration from Tucson to El Paso: 196 (#42 most common destination from Tucson)
- Net migration: 53 to Tucson
- Migration from Tucson to El Paso: 196 (#42 most common destination from Tucson)
- Net migration: 53 to Tucson

16 / 50
Frank K. // Wikicommons
#35. Anchorage, AK Metro Area
- Migration to Anchorage in 2014-2018: 250
- Migration from Anchorage to El Paso: 356 (#17 most common destination from Anchorage)
- Net migration: 106 to El Paso
- Migration from Anchorage to El Paso: 356 (#17 most common destination from Anchorage)
- Net migration: 106 to El Paso

17 / 50
Tricia Daniel // Shutterstock
#34. College Station-Bryan, TX Metro Area
- Migration to College Station in 2014-2018: 255
- Migration from College Station to El Paso: 0
- Net migration: 255 to College Station
- Migration from College Station to El Paso: 0
- Net migration: 255 to College Station

18 / 50
Daniel Orth // Flickr
#33. Riverside-San Bernardino-Ontario, CA Metro Area
- Migration to Riverside in 2014-2018: 263
- Migration from Riverside to El Paso: 371 (#63 most common destination from Riverside)
- Net migration: 108 to El Paso
- Migration from Riverside to El Paso: 371 (#63 most common destination from Riverside)
- Net migration: 108 to El Paso

19 / 50
Sean Pavone // Shutterstock
#32. Indianapolis-Carmel-Anderson, IN Metro Area
- Migration to Indianapolis in 2014-2018: 274
- Migration from Indianapolis to El Paso: 0
- Net migration: 274 to Indianapolis
- Migration from Indianapolis to El Paso: 0
- Net migration: 274 to Indianapolis

20 / 50
PghPhxNfk // Wikimedia Commons
#31. Columbus, GA-AL Metro Area
- Migration to Columbus in 2014-2018: 282
- Migration from Columbus to El Paso: 290 (#14 most common destination from Columbus)
- Net migration: 8 to El Paso
- Migration from Columbus to El Paso: 290 (#14 most common destination from Columbus)
- Net migration: 8 to El Paso

21 / 50
TommyBrison // Shutterstock
#30. Kansas City, MO-KS Metro Area
- Migration to Kansas City in 2014-2018: 309
- Migration from Kansas City to El Paso: 226 (#62 most common destination from Kansas City)
- Net migration: 83 to Kansas City
- Migration from Kansas City to El Paso: 226 (#62 most common destination from Kansas City)
- Net migration: 83 to Kansas City

22 / 50
GeorgeNeedham // Flickr
#29. Sierra Vista-Douglas, AZ Metro Area
- Migration to Sierra Vista in 2014-2018: 311
- Migration from Sierra Vista to El Paso: 313 (#5 most common destination from Sierra Vista)
- Net migration: 2 to El Paso
- Migration from Sierra Vista to El Paso: 313 (#5 most common destination from Sierra Vista)
- Net migration: 2 to El Paso

23 / 50
Keizers // Wikimedia Commons
#28. Atlanta-Sandy Springs-Roswell, GA Metro Area
- Migration to Atlanta in 2014-2018: 349
- Migration from Atlanta to El Paso: 55 (#228 most common destination from Atlanta)
- Net migration: 294 to Atlanta
- Migration from Atlanta to El Paso: 55 (#228 most common destination from Atlanta)
- Net migration: 294 to Atlanta

24 / 50
Robert Corby // Wikimedia Commons
#27. Colorado Springs, CO Metro Area
- Migration to Colorado Springs in 2014-2018: 358
- Migration from Colorado Springs to El Paso: 431 (#27 most common destination from Colorado Springs)
- Net migration: 73 to El Paso
- Migration from Colorado Springs to El Paso: 431 (#27 most common destination from Colorado Springs)
- Net migration: 73 to El Paso

25 / 50
Wikimedia
#26. Oklahoma City, OK Metro Area
- Migration to Oklahoma City in 2014-2018: 361
- Migration from Oklahoma City to El Paso: 112 (#66 most common destination from Oklahoma City)
- Net migration: 249 to Oklahoma City
- Migration from Oklahoma City to El Paso: 112 (#66 most common destination from Oklahoma City)
- Net migration: 249 to Oklahoma City

26 / 50
SG Arts // Shutterstock
#25. Midland, TX Metro Area
- Migration to Midland in 2014-2018: 379
- Migration from Midland to El Paso: 319 (#7 most common destination from Midland)
- Net migration: 60 to Midland
- Migration from Midland to El Paso: 319 (#7 most common destination from Midland)
- Net migration: 60 to Midland

27 / 50
WillHuebie // Shutterstock
#24. Lawton, OK Metro Area
- Migration to Lawton in 2014-2018: 384
- Migration from Lawton to El Paso: 481 (#3 most common destination from Lawton)
- Net migration: 97 to El Paso
- Migration from Lawton to El Paso: 481 (#3 most common destination from Lawton)
- Net migration: 97 to El Paso

28 / 50
King of Hearts // Wikimedia
#23. New York-Newark-Jersey City, NY-NJ-PA Metro Area
- Migration to New York in 2014-2018: 393
- Migration from New York to El Paso: 418 (#129 most common destination from New York)
- Net migration: 25 to El Paso
- Migration from New York to El Paso: 418 (#129 most common destination from New York)
- Net migration: 25 to El Paso

29 / 50
Famartin // Wikicommons
#22. Baltimore-Columbia-Towson, MD Metro Area
- Migration to Baltimore in 2014-2018: 403
- Migration from Baltimore to El Paso: 60 (#160 most common destination from Baltimore)
- Net migration: 343 to Baltimore
- Migration from Baltimore to El Paso: 60 (#160 most common destination from Baltimore)
- Net migration: 343 to Baltimore

30 / 50
Larry D. Moore // Wikicommons
#21. Corpus Christi, TX Metro Area
- Migration to Corpus Christi in 2014-2018: 427
- Migration from Corpus Christi to El Paso: 44 (#58 most common destination from Corpus Christi)
- Net migration: 383 to Corpus Christi
- Migration from Corpus Christi to El Paso: 44 (#58 most common destination from Corpus Christi)
- Net migration: 383 to Corpus Christi

31 / 50
Christopher & Amy Esposito // Wikicommons
#20. Chicago-Naperville-Elgin, IL-IN-WI Metro Area
- Migration to Chicago in 2014-2018: 442
- Migration from Chicago to El Paso: 954 (#64 most common destination from Chicago)
- Net migration: 512 to El Paso
- Migration from Chicago to El Paso: 954 (#64 most common destination from Chicago)
- Net migration: 512 to El Paso

32 / 50
Edmund Garman // Flickr
#19. Urban Honolulu, HI Metro Area
- Migration to Urban Honolulu in 2014-2018: 451
- Migration from Urban Honolulu to El Paso: 361 (#32 most common destination from Urban Honolulu)
- Net migration: 90 to Urban Honolulu
- Migration from Urban Honolulu to El Paso: 361 (#32 most common destination from Urban Honolulu)
- Net migration: 90 to Urban Honolulu

33 / 50
M.Bucka // Wikimedia Commons
#18. Albuquerque, NM Metro Area
- Migration to Albuquerque in 2014-2018: 481
- Migration from Albuquerque to El Paso: 311 (#21 most common destination from Albuquerque)
- Net migration: 170 to Albuquerque
- Migration from Albuquerque to El Paso: 311 (#21 most common destination from Albuquerque)
- Net migration: 170 to Albuquerque

34 / 50
Ken Lund // Flickr
#17. Charleston-North Charleston, SC Metro Area
- Migration to Charleston in 2014-2018: 486
- Migration from Charleston to El Paso: 44 (#104 most common destination from Charleston)
- Net migration: 442 to Charleston
- Migration from Charleston to El Paso: 44 (#104 most common destination from Charleston)
- Net migration: 442 to Charleston

35 / 50
Bob Jagendorf // Wikimedia Commons
#16. Clarksville, TN-KY Metro Area
- Migration to Clarksville in 2014-2018: 524
- Migration from Clarksville to El Paso: 347 (#15 most common destination from Clarksville)
- Net migration: 177 to Clarksville
- Migration from Clarksville to El Paso: 347 (#15 most common destination from Clarksville)
- Net migration: 177 to Clarksville

36 / 50
Elred // Wikimedia Commons
#15. Lubbock, TX Metro Area
- Migration to Lubbock in 2014-2018: 576
- Migration from Lubbock to El Paso: 405 (#7 most common destination from Lubbock)
- Net migration: 171 to Lubbock
- Migration from Lubbock to El Paso: 405 (#7 most common destination from Lubbock)
- Net migration: 171 to Lubbock

37 / 50
Jacob Boomsma // Shutterstock
#14. Lafayette, LA Metro Area
- Migration to Lafayette in 2014-2018: 578
- Migration from Lafayette to El Paso: 0
- Net migration: 578 to Lafayette
- Migration from Lafayette to El Paso: 0
- Net migration: 578 to Lafayette
38 / 50
Public Domain
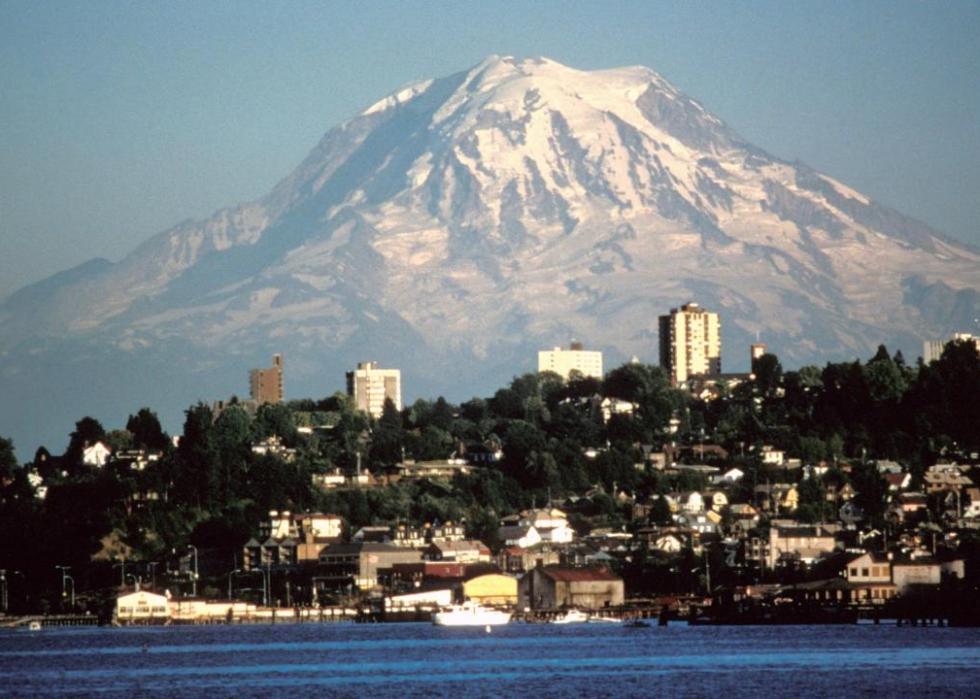
#13. Seattle-Tacoma-Bellevue, WA Metro Area
- Migration to Seattle in 2014-2018: 619
- Migration from Seattle to El Paso: 117 (#142 most common destination from Seattle)
- Net migration: 502 to Seattle
- Migration from Seattle to El Paso: 117 (#142 most common destination from Seattle)
- Net migration: 502 to Seattle
39 / 50
davidwilson1949 // Flickr
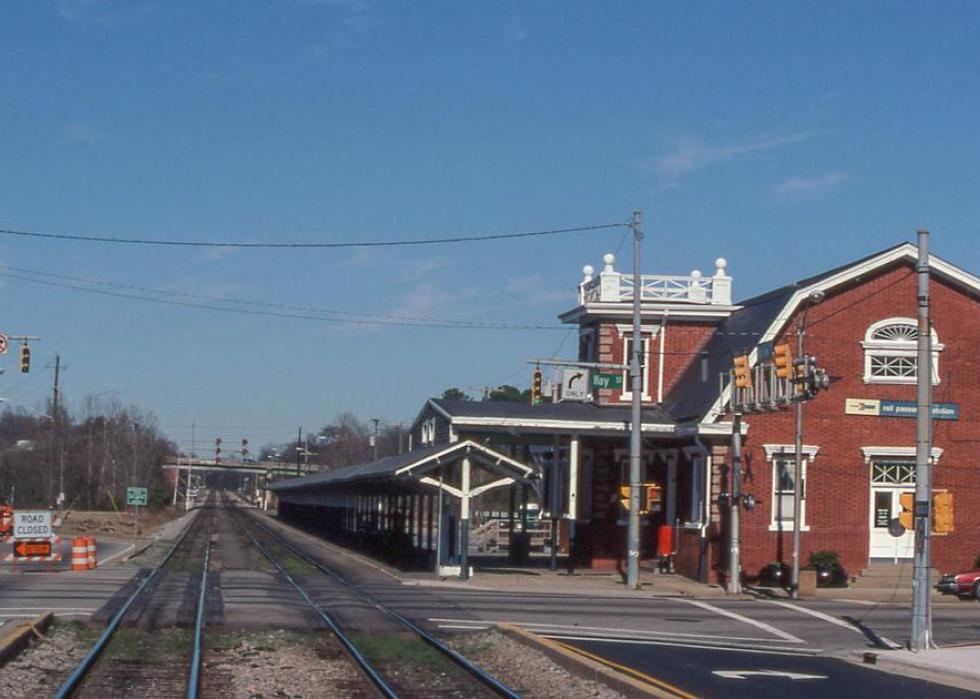
#12. Fayetteville, NC Metro Area
- Migration to Fayetteville in 2014-2018: 645
- Migration from Fayetteville to El Paso: 436 (#19 most common destination from Fayetteville)
- Net migration: 209 to Fayetteville
- Migration from Fayetteville to El Paso: 436 (#19 most common destination from Fayetteville)
- Net migration: 209 to Fayetteville

40 / 50
f11photo // Shutterstock
#11. Denver-Aurora-Lakewood, CO Metro Area
- Migration to Denver in 2014-2018: 725
- Migration from Denver to El Paso: 396 (#55 most common destination from Denver)
- Net migration: 329 to Denver
- Migration from Denver to El Paso: 396 (#55 most common destination from Denver)
- Net migration: 329 to Denver

41 / 50
Andrew Bossi // Wikimedia
#10. Washington-Arlington-Alexandria, DC-VA-MD-WV Metro Area
- Migration to Washington in 2014-2018: 806
- Migration from Washington to El Paso: 713 (#68 most common destination from Washington)
- Net migration: 93 to Washington
- Migration from Washington to El Paso: 713 (#68 most common destination from Washington)
- Net migration: 93 to Washington

42 / 50
DPPed// Wikimedia
#9. Phoenix-Mesa-Scottsdale, AZ Metro Area
- Migration to Phoenix in 2014-2018: 852
- Migration from Phoenix to El Paso: 675 (#41 most common destination from Phoenix)
- Net migration: 177 to Phoenix
- Migration from Phoenix to El Paso: 675 (#41 most common destination from Phoenix)
- Net migration: 177 to Phoenix

43 / 50
Billy Hathorn // Wikimedia
#8. Killeen-Temple, TX Metro Area
- Migration to Killeen in 2014-2018: 862
- Migration from Killeen to El Paso: 395 (#19 most common destination from Killeen)
- Net migration: 467 to Killeen
- Migration from Killeen to El Paso: 395 (#19 most common destination from Killeen)
- Net migration: 467 to Killeen

44 / 50
Rusalkin Dmytro // Shutterstock
#7. Odessa, TX Metro Area
- Migration to Odessa in 2014-2018: 903
- Migration from Odessa to El Paso: 1,327 (#2 most common destination from Odessa)
- Net migration: 424 to El Paso
- Migration from Odessa to El Paso: 1,327 (#2 most common destination from Odessa)
- Net migration: 424 to El Paso

45 / 50
BDS2006 // Wikimedia
#6. Los Angeles-Long Beach-Anaheim, CA Metro Area
- Migration to Los Angeles in 2014-2018: 1,059
- Migration from Los Angeles to El Paso: 727 (#70 most common destination from Los Angeles)
- Net migration: 332 to Los Angeles
- Migration from Los Angeles to El Paso: 727 (#70 most common destination from Los Angeles)
- Net migration: 332 to Los Angeles

46 / 50
Pixabay
#5. Austin-Round Rock, TX Metro Area
- Migration to Austin in 2014-2018: 1,447
- Migration from Austin to El Paso: 571 (#27 most common destination from Austin)
- Net migration: 876 to Austin
- Migration from Austin to El Paso: 571 (#27 most common destination from Austin)
- Net migration: 876 to Austin

47 / 50
Alan Botting // Wikimedia Commons
#4. Dallas-Fort Worth-Arlington, TX Metro Area
- Migration to Dallas in 2014-2018: 2,054
- Migration from Dallas to El Paso: 1,861 (#22 most common destination from Dallas)
- Net migration: 193 to Dallas
- Migration from Dallas to El Paso: 1,861 (#22 most common destination from Dallas)
- Net migration: 193 to Dallas

48 / 50
skeeze // Pixabay
#3. Houston-The Woodlands-Sugar Land, TX Metro Area
- Migration to Houston in 2014-2018: 2,231
- Migration from Houston to El Paso: 1,020 (#30 most common destination from Houston)
- Net migration: 1,211 to Houston
- Migration from Houston to El Paso: 1,020 (#30 most common destination from Houston)
- Net migration: 1,211 to Houston

49 / 50
Pixabay
#2. San Antonio-New Braunfels, TX Metro Area
- Migration to San Antonio in 2014-2018: 2,520
- Migration from San Antonio to El Paso: 1,434 (#9 most common destination from San Antonio)
- Net migration: 1,086 to San Antonio
- Migration from San Antonio to El Paso: 1,434 (#9 most common destination from San Antonio)
- Net migration: 1,086 to San Antonio
50 / 50
Public Domain
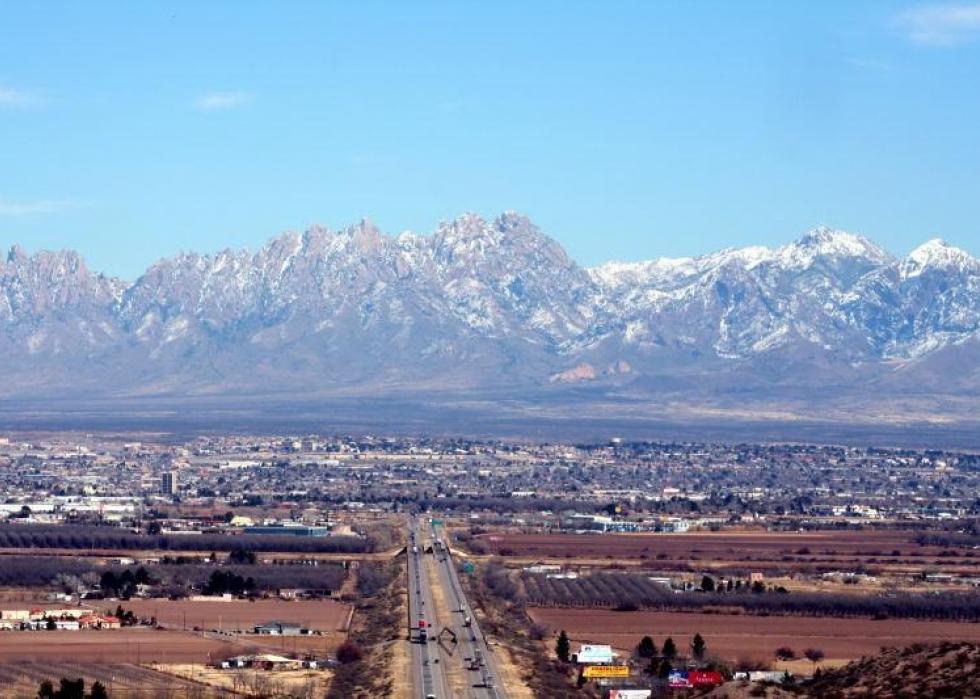
#1. Las Cruces, NM Metro Area
- Migration to Las Cruces in 2014-2018: 3,218
- Migration from Las Cruces to El Paso: 2,352 (#1 most common destination from Las Cruces)
- Net migration: 866 to Las Cruces
- Migration from Las Cruces to El Paso: 2,352 (#1 most common destination from Las Cruces)
- Net migration: 866 to Las Cruces


