
Where people in Grand Rapids are moving to most
Written by:
April 18, 2021
Grguy2011 // Wikimedia Commons
Where people in Grand Rapids are moving to most
Stacker compiled a list of where people in Grand Rapids are moving to the most using data from the U.S. Census Bureau. Metros are ranked by the estimated number of people who moved to the metro from Grand Rapids between 2014 and 2018. Ties were broken by gross migration.
1 / 50
Distrito Medico Monterrey // Flickr
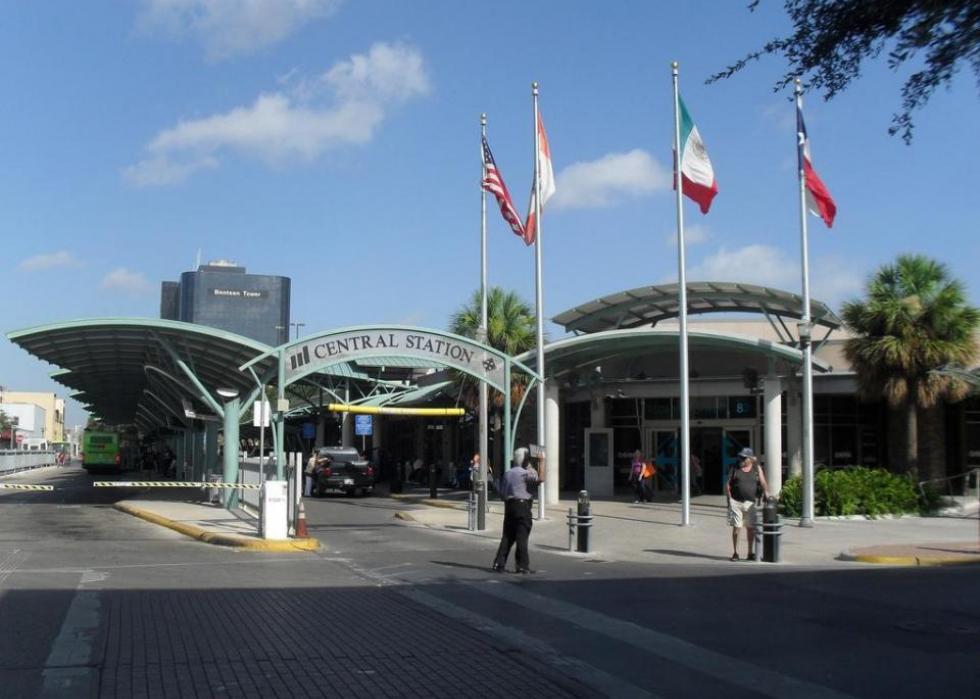
#50. McAllen-Edinburg-Mission, TX Metro Area
- Migration to McAllen in 2014-2018: 102
- Migration from McAllen to Grand Rapids: 164 (#18 most common destination from McAllen)
- Net migration: 62 to Grand Rapids
- Migration from McAllen to Grand Rapids: 164 (#18 most common destination from McAllen)
- Net migration: 62 to Grand Rapids

2 / 50
Ron Cogswell//Wikicommons
#49. Richmond, VA Metro Area
- Migration to Richmond in 2014-2018: 104
- Migration from Richmond to Grand Rapids: 89 (#83 most common destination from Richmond)
- Net migration: 15 to Richmond
- Migration from Richmond to Grand Rapids: 89 (#83 most common destination from Richmond)
- Net migration: 15 to Richmond

3 / 50
Pixabay
#48. Huntsville, AL Metro Area
- Migration to Huntsville in 2014-2018: 109
- Migration from Huntsville to Grand Rapids: 4 (#149 most common destination from Huntsville)
- Net migration: 105 to Huntsville
- Migration from Huntsville to Grand Rapids: 4 (#149 most common destination from Huntsville)
- Net migration: 105 to Huntsville

4 / 50
SD Dirk // Flickr
#47. San Diego-Carlsbad, CA Metro Area
- Migration to San Diego in 2014-2018: 116
- Migration from San Diego to Grand Rapids: 95 (#161 most common destination from San Diego)
- Net migration: 21 to San Diego
- Migration from San Diego to Grand Rapids: 95 (#161 most common destination from San Diego)
- Net migration: 21 to San Diego

5 / 50
Blankfaze // Wikimedia Commons
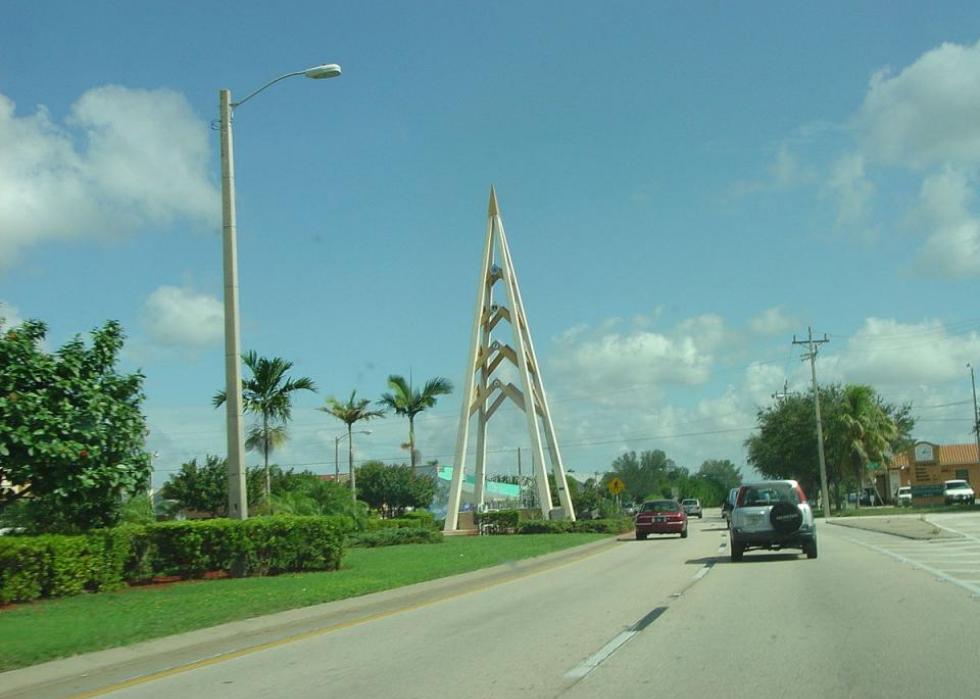
#46. Pensacola-Ferry Pass-Brent, FL Metro Area
- Migration to Pensacola in 2014-2018: 118
- Migration from Pensacola to Grand Rapids: 0
- Net migration: 118 to Pensacola
- Migration from Pensacola to Grand Rapids: 0
- Net migration: 118 to Pensacola

6 / 50
Tysto // Wikimedia Commons
#45. Dayton, OH Metro Area
- Migration to Dayton in 2014-2018: 118
- Migration from Dayton to Grand Rapids: 90 (#60 most common destination from Dayton)
- Net migration: 28 to Dayton
- Migration from Dayton to Grand Rapids: 90 (#60 most common destination from Dayton)
- Net migration: 28 to Dayton

7 / 50
f11photo // Shutterstock
#44. Philadelphia-Camden-Wilmington, PA-NJ-DE-MD Metro Area
- Migration to Philadelphia in 2014-2018: 120
- Migration from Philadelphia to Grand Rapids: 182 (#120 most common destination from Philadelphia)
- Net migration: 62 to Grand Rapids
- Migration from Philadelphia to Grand Rapids: 182 (#120 most common destination from Philadelphia)
- Net migration: 62 to Grand Rapids

8 / 50
Andrew Jameson // Wikicommons
#43. Bay City, MI Metro Area
- Migration to Bay City in 2014-2018: 122
- Migration from Bay City to Grand Rapids: 85 (#8 most common destination from Bay City)
- Net migration: 37 to Bay City
- Migration from Bay City to Grand Rapids: 85 (#8 most common destination from Bay City)
- Net migration: 37 to Bay City

9 / 50
VisitCentralFL // Flickr
#42. Lakeland-Winter Haven, FL Metro Area
- Migration to Lakeland in 2014-2018: 130
- Migration from Lakeland to Grand Rapids: 16 (#135 most common destination from Lakeland)
- Net migration: 114 to Lakeland
- Migration from Lakeland to Grand Rapids: 16 (#135 most common destination from Lakeland)
- Net migration: 114 to Lakeland

10 / 50
Carol Ann Mossa // Shutterstock
#41. Punta Gorda, FL Metro Area
- Migration to Punta Gorda in 2014-2018: 133
- Migration from Punta Gorda to Grand Rapids: 44 (#37 most common destination from Punta Gorda)
- Net migration: 89 to Punta Gorda
- Migration from Punta Gorda to Grand Rapids: 44 (#37 most common destination from Punta Gorda)
- Net migration: 89 to Punta Gorda

11 / 50
Pixabay
#40. San Antonio-New Braunfels, TX Metro Area
- Migration to San Antonio in 2014-2018: 134
- Migration from San Antonio to Grand Rapids: 68 (#145 most common destination from San Antonio)
- Net migration: 66 to San Antonio
- Migration from San Antonio to Grand Rapids: 68 (#145 most common destination from San Antonio)
- Net migration: 66 to San Antonio

12 / 50
Beyonce245// Wikimedia
#39. Greensboro-High Point, NC Metro Area
- Migration to Greensboro in 2014-2018: 137
- Migration from Greensboro to Grand Rapids: 0
- Net migration: 137 to Greensboro
- Migration from Greensboro to Grand Rapids: 0
- Net migration: 137 to Greensboro
13 / 50
Sanibel Sun // WikiCommons
#38. Cape Coral-Fort Myers, FL Metro Area
- Migration to Cape Coral in 2014-2018: 144
- Migration from Cape Coral to Grand Rapids: 60 (#76 most common destination from Cape Coral)
- Net migration: 84 to Cape Coral
- Migration from Cape Coral to Grand Rapids: 60 (#76 most common destination from Cape Coral)
- Net migration: 84 to Cape Coral

14 / 50
Chris Watson // Wikicommons
#37. Louisville/Jefferson County, KY-IN Metro Area
- Migration to Louisville/Jefferson County in 2014-2018: 146
- Migration from Louisville/Jefferson County to Grand Rapids: 191 (#42 most common destination from Louisville/Jefferson County)
- Net migration: 45 to Grand Rapids
- Migration from Louisville/Jefferson County to Grand Rapids: 191 (#42 most common destination from Louisville/Jefferson County)
- Net migration: 45 to Grand Rapids

15 / 50
Creative Commons
#36. Oshkosh-Neenah, WI Metro Area
- Migration to Oshkosh in 2014-2018: 155
- Migration from Oshkosh to Grand Rapids: 0
- Net migration: 155 to Oshkosh
- Migration from Oshkosh to Grand Rapids: 0
- Net migration: 155 to Oshkosh

16 / 50
Paul Brady Photography // Shutterstock
#35. Madison, WI Metro Area
- Migration to Madison in 2014-2018: 166
- Migration from Madison to Grand Rapids: 82 (#66 most common destination from Madison)
- Net migration: 84 to Madison
- Migration from Madison to Grand Rapids: 82 (#66 most common destination from Madison)
- Net migration: 84 to Madison

17 / 50
Pixabay
#34. Austin-Round Rock, TX Metro Area
- Migration to Austin in 2014-2018: 166
- Migration from Austin to Grand Rapids: 124 (#94 most common destination from Austin)
- Net migration: 42 to Austin
- Migration from Austin to Grand Rapids: 124 (#94 most common destination from Austin)
- Net migration: 42 to Austin

18 / 50
Canva
#33. Cincinnati, OH-KY-IN Metro Area
- Migration to Cincinnati in 2014-2018: 169
- Migration from Cincinnati to Grand Rapids: 128 (#84 most common destination from Cincinnati)
- Net migration: 41 to Cincinnati
- Migration from Cincinnati to Grand Rapids: 128 (#84 most common destination from Cincinnati)
- Net migration: 41 to Cincinnati

19 / 50
Andrew Bossi // Wikimedia
#32. Washington-Arlington-Alexandria, DC-VA-MD-WV Metro Area
- Migration to Washington in 2014-2018: 169
- Migration from Washington to Grand Rapids: 352 (#115 most common destination from Washington)
- Net migration: 183 to Grand Rapids
- Migration from Washington to Grand Rapids: 352 (#115 most common destination from Washington)
- Net migration: 183 to Grand Rapids

20 / 50
f11photo // Shutterstock
#31. Nashville-Davidson--Murfreesboro--Franklin, TN Metro Area
- Migration to Nashville in 2014-2018: 170
- Migration from Nashville to Grand Rapids: 217 (#57 most common destination from Nashville)
- Net migration: 47 to Grand Rapids
- Migration from Nashville to Grand Rapids: 217 (#57 most common destination from Nashville)
- Net migration: 47 to Grand Rapids

21 / 50
f11photo // Shutterstock
#30. Denver-Aurora-Lakewood, CO Metro Area
- Migration to Denver in 2014-2018: 171
- Migration from Denver to Grand Rapids: 110 (#131 most common destination from Denver)
- Net migration: 61 to Denver
- Migration from Denver to Grand Rapids: 110 (#131 most common destination from Denver)
- Net migration: 61 to Denver

22 / 50
BDS2006 // Wikimedia
#29. Los Angeles-Long Beach-Anaheim, CA Metro Area
- Migration to Los Angeles in 2014-2018: 176
- Migration from Los Angeles to Grand Rapids: 246 (#133 most common destination from Los Angeles)
- Net migration: 70 to Grand Rapids
- Migration from Los Angeles to Grand Rapids: 246 (#133 most common destination from Los Angeles)
- Net migration: 70 to Grand Rapids

23 / 50
Sean Pavone // Shutterstock
#28. Indianapolis-Carmel-Anderson, IN Metro Area
- Migration to Indianapolis in 2014-2018: 193
- Migration from Indianapolis to Grand Rapids: 371 (#36 most common destination from Indianapolis)
- Net migration: 178 to Grand Rapids
- Migration from Indianapolis to Grand Rapids: 371 (#36 most common destination from Indianapolis)
- Net migration: 178 to Grand Rapids

24 / 50
King of Hearts // Wikimedia
#27. New York-Newark-Jersey City, NY-NJ-PA Metro Area
- Migration to New York in 2014-2018: 203
- Migration from New York to Grand Rapids: 205 (#178 most common destination from New York)
- Net migration: 2 to Grand Rapids
- Migration from New York to Grand Rapids: 205 (#178 most common destination from New York)
- Net migration: 2 to Grand Rapids

25 / 50
AbeEzekowitz // Wikimedia Commons
#26. Joplin, MO Metro Area
- Migration to Joplin in 2014-2018: 204
- Migration from Joplin to Grand Rapids: 0
- Net migration: 204 to Joplin
- Migration from Joplin to Grand Rapids: 0
- Net migration: 204 to Joplin

26 / 50
O. David Redwine // Wikimedia Commons
#25. Midland, MI Metro Area
- Migration to Midland in 2014-2018: 204
- Migration from Midland to Grand Rapids: 282 (#4 most common destination from Midland)
- Net migration: 78 to Grand Rapids
- Migration from Midland to Grand Rapids: 282 (#4 most common destination from Midland)
- Net migration: 78 to Grand Rapids

27 / 50
Keizers // Wikimedia Commons
#24. Atlanta-Sandy Springs-Roswell, GA Metro Area
- Migration to Atlanta in 2014-2018: 207
- Migration from Atlanta to Grand Rapids: 363 (#96 most common destination from Atlanta)
- Net migration: 156 to Grand Rapids
- Migration from Atlanta to Grand Rapids: 363 (#96 most common destination from Atlanta)
- Net migration: 156 to Grand Rapids

28 / 50
Sharkshock // Shutterstock
#23. Raleigh, NC Metro Area
- Migration to Raleigh in 2014-2018: 208
- Migration from Raleigh to Grand Rapids: 49 (#119 most common destination from Raleigh)
- Net migration: 159 to Raleigh
- Migration from Raleigh to Grand Rapids: 49 (#119 most common destination from Raleigh)
- Net migration: 159 to Raleigh

29 / 50
Sherry V Smith // Shutterstock
#22. Virginia Beach-Norfolk-Newport News, VA-NC Metro Area
- Migration to Virginia Beach in 2014-2018: 213
- Migration from Virginia Beach to Grand Rapids: 9 (#266 most common destination from Virginia Beach)
- Net migration: 204 to Virginia Beach
- Migration from Virginia Beach to Grand Rapids: 9 (#266 most common destination from Virginia Beach)
- Net migration: 204 to Virginia Beach

30 / 50
Don Ramey Logan // Wikicommons
#21. San Jose-Sunnyvale-Santa Clara, CA Metro Area
- Migration to San Jose in 2014-2018: 216
- Migration from San Jose to Grand Rapids: 61 (#112 most common destination from San Jose)
- Net migration: 155 to San Jose
- Migration from San Jose to Grand Rapids: 61 (#112 most common destination from San Jose)
- Net migration: 155 to San Jose

31 / 50
Henryk Sadura // Shutterstock
#20. South Bend-Mishawaka, IN-MI Metro Area
- Migration to South Bend in 2014-2018: 230
- Migration from South Bend to Grand Rapids: 389 (#8 most common destination from South Bend)
- Net migration: 159 to Grand Rapids
- Migration from South Bend to Grand Rapids: 389 (#8 most common destination from South Bend)
- Net migration: 159 to Grand Rapids

32 / 50
Public Domain
#19. Seattle-Tacoma-Bellevue, WA Metro Area
- Migration to Seattle in 2014-2018: 275
- Migration from Seattle to Grand Rapids: 225 (#94 most common destination from Seattle)
- Net migration: 50 to Seattle
- Migration from Seattle to Grand Rapids: 225 (#94 most common destination from Seattle)
- Net migration: 50 to Seattle

33 / 50
Tony Webster // Wikicommons
#18. Minneapolis-St. Paul-Bloomington, MN-WI Metro Area
- Migration to Minneapolis in 2014-2018: 275
- Migration from Minneapolis to Grand Rapids: 320 (#57 most common destination from Minneapolis)
- Net migration: 45 to Grand Rapids
- Migration from Minneapolis to Grand Rapids: 320 (#57 most common destination from Minneapolis)
- Net migration: 45 to Grand Rapids

34 / 50
Humbles Art // Wikimedia Commons
#17. Niles-Benton Harbor, MI Metro Area
- Migration to Niles in 2014-2018: 276
- Migration from Niles to Grand Rapids: 370 (#7 most common destination from Niles)
- Net migration: 94 to Grand Rapids
- Migration from Niles to Grand Rapids: 370 (#7 most common destination from Niles)
- Net migration: 94 to Grand Rapids

35 / 50
Alvesgaspar // Wikimedia
#16. Tampa-St. Petersburg-Clearwater, FL Metro Area
- Migration to Tampa in 2014-2018: 291
- Migration from Tampa to Grand Rapids: 518 (#48 most common destination from Tampa)
- Net migration: 227 to Grand Rapids
- Migration from Tampa to Grand Rapids: 518 (#48 most common destination from Tampa)
- Net migration: 227 to Grand Rapids

36 / 50
Flintmichigan // Wikicommons
#15. Flint, MI Metro Area
- Migration to Flint in 2014-2018: 306
- Migration from Flint to Grand Rapids: 1,000 (#3 most common destination from Flint)
- Net migration: 694 to Grand Rapids
- Migration from Flint to Grand Rapids: 1,000 (#3 most common destination from Flint)
- Net migration: 694 to Grand Rapids

37 / 50
Phillip L. Hofmeister // Wikimedia Commons
#14. Jackson, MI Metro Area
- Migration to Jackson in 2014-2018: 309
- Migration from Jackson to Grand Rapids: 433 (#5 most common destination from Jackson)
- Net migration: 124 to Grand Rapids
- Migration from Jackson to Grand Rapids: 433 (#5 most common destination from Jackson)
- Net migration: 124 to Grand Rapids

38 / 50
Stuart Seeger // Wikicommons
#13. Portland-Vancouver-Hillsboro, OR-WA Metro Area
- Migration to Portland in 2014-2018: 325
- Migration from Portland to Grand Rapids: 168 (#80 most common destination from Portland)
- Net migration: 157 to Portland
- Migration from Portland to Grand Rapids: 168 (#80 most common destination from Portland)
- Net migration: 157 to Portland

39 / 50
Songquan Deng // Shutterstock
#12. Orlando-Kissimmee-Sanford, FL Metro Area
- Migration to Orlando in 2014-2018: 329
- Migration from Orlando to Grand Rapids: 146 (#97 most common destination from Orlando)
- Net migration: 183 to Orlando
- Migration from Orlando to Grand Rapids: 146 (#97 most common destination from Orlando)
- Net migration: 183 to Orlando

40 / 50
Sean Pavone // Shutterstock
#11. Columbus, OH Metro Area
- Migration to Columbus in 2014-2018: 349
- Migration from Columbus to Grand Rapids: 59 (#121 most common destination from Columbus)
- Net migration: 290 to Columbus
- Migration from Columbus to Grand Rapids: 59 (#121 most common destination from Columbus)
- Net migration: 290 to Columbus

41 / 50
DPPed// Wikimedia
#10. Phoenix-Mesa-Scottsdale, AZ Metro Area
- Migration to Phoenix in 2014-2018: 397
- Migration from Phoenix to Grand Rapids: 396 (#62 most common destination from Phoenix)
- Net migration: 1 to Phoenix
- Migration from Phoenix to Grand Rapids: 396 (#62 most common destination from Phoenix)
- Net migration: 1 to Phoenix

42 / 50
Alan Botting // Wikimedia Commons
#9. Dallas-Fort Worth-Arlington, TX Metro Area
- Migration to Dallas in 2014-2018: 435
- Migration from Dallas to Grand Rapids: 165 (#145 most common destination from Dallas)
- Net migration: 270 to Dallas
- Migration from Dallas to Grand Rapids: 165 (#145 most common destination from Dallas)
- Net migration: 270 to Dallas

43 / 50
Quibik // Wikimedia Commons
#8. Battle Creek, MI Metro Area
- Migration to Battle Creek in 2014-2018: 511
- Migration from Battle Creek to Grand Rapids: 337 (#5 most common destination from Battle Creek)
- Net migration: 174 to Battle Creek
- Migration from Battle Creek to Grand Rapids: 337 (#5 most common destination from Battle Creek)
- Net migration: 174 to Battle Creek

44 / 50
Dhacim // Wikicommons
#7. Saginaw, MI Metro Area
- Migration to Saginaw in 2014-2018: 566
- Migration from Saginaw to Grand Rapids: 722 (#2 most common destination from Saginaw)
- Net migration: 156 to Grand Rapids
- Migration from Saginaw to Grand Rapids: 722 (#2 most common destination from Saginaw)
- Net migration: 156 to Grand Rapids

45 / 50
Christopher & Amy Esposito // Wikicommons
#6. Chicago-Naperville-Elgin, IL-IN-WI Metro Area
- Migration to Chicago in 2014-2018: 904
- Migration from Chicago to Grand Rapids: 2,075 (#37 most common destination from Chicago)
- Net migration: 1,171 to Grand Rapids
- Migration from Chicago to Grand Rapids: 2,075 (#37 most common destination from Chicago)
- Net migration: 1,171 to Grand Rapids

46 / 50
AndrewHorne // Wikimedia Commons
#5. Ann Arbor, MI Metro Area
- Migration to Ann Arbor in 2014-2018: 1,275
- Migration from Ann Arbor to Grand Rapids: 681 (#7 most common destination from Ann Arbor)
- Net migration: 594 to Ann Arbor
- Migration from Ann Arbor to Grand Rapids: 681 (#7 most common destination from Ann Arbor)
- Net migration: 594 to Ann Arbor

47 / 50
Mxobe//Wikicommons
#4. Kalamazoo-Portage, MI Metro Area
- Migration to Kalamazoo in 2014-2018: 1,903
- Migration from Kalamazoo to Grand Rapids: 2,762 (#1 most common destination from Kalamazoo)
- Net migration: 859 to Grand Rapids
- Migration from Kalamazoo to Grand Rapids: 2,762 (#1 most common destination from Kalamazoo)
- Net migration: 859 to Grand Rapids

48 / 50
Jeffness // Wikimedia Commons
#3. Lansing-East Lansing, MI Metro Area
- Migration to Lansing in 2014-2018: 2,683
- Migration from Lansing to Grand Rapids: 2,527 (#2 most common destination from Lansing)
- Net migration: 156 to Lansing
- Migration from Lansing to Grand Rapids: 2,527 (#2 most common destination from Lansing)
- Net migration: 156 to Lansing

49 / 50
PhotosByMahin // Pixabay
#2. Detroit-Warren-Dearborn, MI Metro Area
- Migration to Detroit in 2014-2018: 2,936
- Migration from Detroit to Grand Rapids: 6,384 (#3 most common destination from Detroit)
- Net migration: 3,448 to Grand Rapids
- Migration from Detroit to Grand Rapids: 6,384 (#3 most common destination from Detroit)
- Net migration: 3,448 to Grand Rapids

50 / 50
NOAA Great Lakes Envorinmental Ressearch Laboritory // Flickr
#1. Muskegon, MI Metro Area
- Migration to Muskegon in 2014-2018: 3,570
- Migration from Muskegon to Grand Rapids: 2,875 (#1 most common destination from Muskegon)
- Net migration: 695 to Muskegon
- Migration from Muskegon to Grand Rapids: 2,875 (#1 most common destination from Muskegon)
- Net migration: 695 to Muskegon


