
Where people in Hartford are moving to most
Written by:
April 18, 2021
John Phelan // Wikimedia
Where people in Hartford are moving to most
Stacker compiled a list of where people in Hartford are moving to the most using data from the U.S. Census Bureau. Metros are ranked by the estimated number of people who moved to the metro from Hartford between 2014 and 2018. Ties were broken by gross migration.

1 / 50
DPPed// Wikimedia
#50. Phoenix-Mesa-Scottsdale, AZ Metro Area
- Migration to Phoenix in 2014-2018: 174
- Migration from Phoenix to Hartford: 141 (#140 most common destination from Phoenix)
- Net migration: 33 to Phoenix
- Migration from Phoenix to Hartford: 141 (#140 most common destination from Phoenix)
- Net migration: 33 to Phoenix

2 / 50
Tony Webster // Wikicommons
#49. Minneapolis-St. Paul-Bloomington, MN-WI Metro Area
- Migration to Minneapolis in 2014-2018: 175
- Migration from Minneapolis to Hartford: 161 (#83 most common destination from Minneapolis)
- Net migration: 14 to Minneapolis
- Migration from Minneapolis to Hartford: 161 (#83 most common destination from Minneapolis)
- Net migration: 14 to Minneapolis

3 / 50
f11photo // Shutterstock
#48. Nashville-Davidson--Murfreesboro--Franklin, TN Metro Area
- Migration to Nashville in 2014-2018: 179
- Migration from Nashville to Hartford: 0
- Net migration: 179 to Nashville
- Migration from Nashville to Hartford: 0
- Net migration: 179 to Nashville

4 / 50
Luv24jmg // Wikimedia Commons
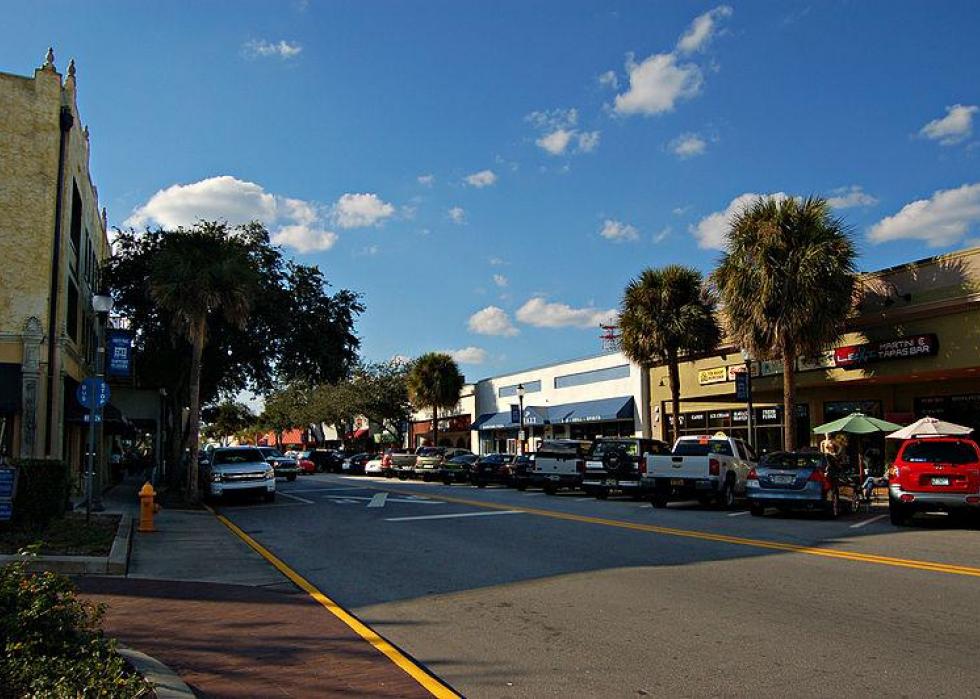
#47. Ocala, FL Metro Area
- Migration to Ocala in 2014-2018: 186
- Migration from Ocala to Hartford: 13 (#108 most common destination from Ocala)
- Net migration: 173 to Ocala
- Migration from Ocala to Hartford: 13 (#108 most common destination from Ocala)
- Net migration: 173 to Ocala

5 / 50
ktr101 // Wikimedia
#46. Barnstable Town, MA Metro Area
- Migration to Barnstable Town in 2014-2018: 191
- Migration from Barnstable Town to Hartford: 215 (#7 most common destination from Barnstable Town)
- Net migration: 24 to Hartford
- Migration from Barnstable Town to Hartford: 215 (#7 most common destination from Barnstable Town)
- Net migration: 24 to Hartford

6 / 50
Zereshk // Wikimedia
#45. Tucson, AZ Metro Area
- Migration to Tucson in 2014-2018: 192
- Migration from Tucson to Hartford: 18 (#190 most common destination from Tucson)
- Net migration: 174 to Tucson
- Migration from Tucson to Hartford: 18 (#190 most common destination from Tucson)
- Net migration: 174 to Tucson

7 / 50
tweber1// Wikimedia
#44. Winston-Salem, NC Metro Area
- Migration to Winston in 2014-2018: 194
- Migration from Winston to Hartford: 0
- Net migration: 194 to Winston
- Migration from Winston to Hartford: 0
- Net migration: 194 to Winston

8 / 50
Sean Pavone // Shutterstock
#43. Columbus, OH Metro Area
- Migration to Columbus in 2014-2018: 197
- Migration from Columbus to Hartford: 114 (#80 most common destination from Columbus)
- Net migration: 83 to Columbus
- Migration from Columbus to Hartford: 114 (#80 most common destination from Columbus)
- Net migration: 83 to Columbus

9 / 50
Canva
#42. Cleveland-Elyria, OH Metro Area
- Migration to Cleveland in 2014-2018: 197
- Migration from Cleveland to Hartford: 204 (#45 most common destination from Cleveland)
- Net migration: 7 to Hartford
- Migration from Cleveland to Hartford: 204 (#45 most common destination from Cleveland)
- Net migration: 7 to Hartford
10 / 50
Ken Lund // Flickr
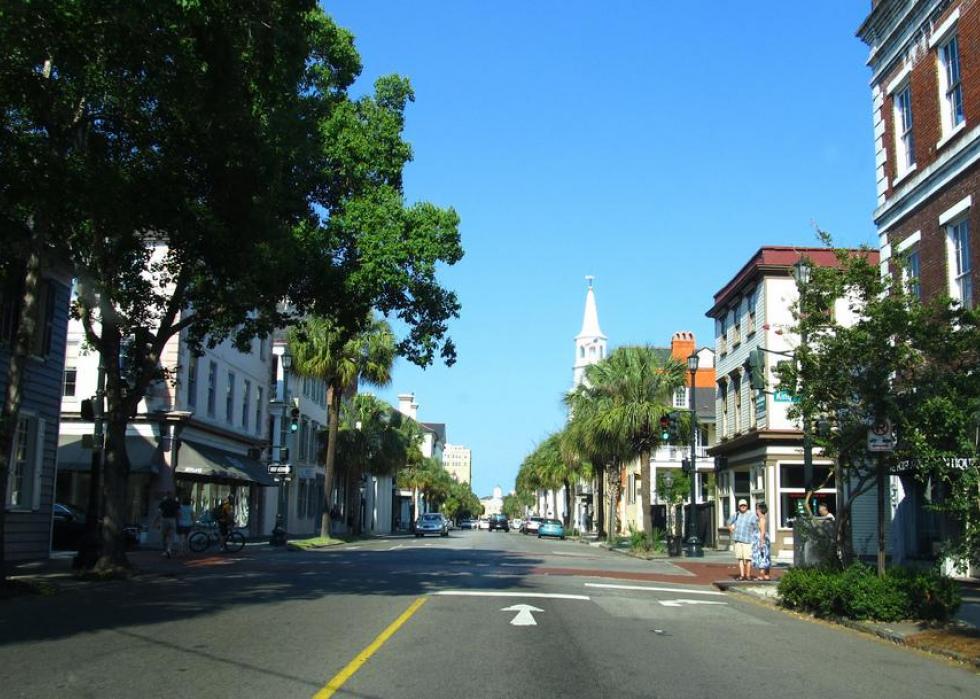
#41. Charleston-North Charleston, SC Metro Area
- Migration to Charleston in 2014-2018: 201
- Migration from Charleston to Hartford: 72 (#78 most common destination from Charleston)
- Net migration: 129 to Charleston
- Migration from Charleston to Hartford: 72 (#78 most common destination from Charleston)
- Net migration: 129 to Charleston

11 / 50
Beyonce245// Wikimedia
#40. Greensboro-High Point, NC Metro Area
- Migration to Greensboro in 2014-2018: 202
- Migration from Greensboro to Hartford: 0
- Net migration: 202 to Greensboro
- Migration from Greensboro to Hartford: 0
- Net migration: 202 to Greensboro

12 / 50
Sharkshock // Shutterstock
#39. Raleigh, NC Metro Area
- Migration to Raleigh in 2014-2018: 212
- Migration from Raleigh to Hartford: 67 (#101 most common destination from Raleigh)
- Net migration: 145 to Raleigh
- Migration from Raleigh to Hartford: 67 (#101 most common destination from Raleigh)
- Net migration: 145 to Raleigh

13 / 50
ESB Professional // Shutterstock
#38. Pittsburgh, PA Metro Area
- Migration to Pittsburgh in 2014-2018: 238
- Migration from Pittsburgh to Hartford: 120 (#94 most common destination from Pittsburgh)
- Net migration: 118 to Pittsburgh
- Migration from Pittsburgh to Hartford: 120 (#94 most common destination from Pittsburgh)
- Net migration: 118 to Pittsburgh

14 / 50
f11photo // Shutterstock
#37. Denver-Aurora-Lakewood, CO Metro Area
- Migration to Denver in 2014-2018: 240
- Migration from Denver to Hartford: 198 (#83 most common destination from Denver)
- Net migration: 42 to Denver
- Migration from Denver to Hartford: 198 (#83 most common destination from Denver)
- Net migration: 42 to Denver

15 / 50
Albert Pego // Shutterstock
#36. Burlington-South Burlington, VT Metro Area
- Migration to Burlington in 2014-2018: 241
- Migration from Burlington to Hartford: 83 (#23 most common destination from Burlington)
- Net migration: 158 to Burlington
- Migration from Burlington to Hartford: 83 (#23 most common destination from Burlington)
- Net migration: 158 to Burlington

16 / 50
Famartin // Wikicommons
#35. Baltimore-Columbia-Towson, MD Metro Area
- Migration to Baltimore in 2014-2018: 241
- Migration from Baltimore to Hartford: 274 (#62 most common destination from Baltimore)
- Net migration: 33 to Hartford
- Migration from Baltimore to Hartford: 274 (#62 most common destination from Baltimore)
- Net migration: 33 to Hartford

17 / 50
AndrewAvitus // Wikicommons'
#34. Jacksonville, FL Metro Area
- Migration to Jacksonville in 2014-2018: 243
- Migration from Jacksonville to Hartford: 79 (#116 most common destination from Jacksonville)
- Net migration: 164 to Jacksonville
- Migration from Jacksonville to Hartford: 79 (#116 most common destination from Jacksonville)
- Net migration: 164 to Jacksonville

18 / 50
Ron Cogswell//Wikicommons
#33. Richmond, VA Metro Area
- Migration to Richmond in 2014-2018: 249
- Migration from Richmond to Hartford: 220 (#42 most common destination from Richmond)
- Net migration: 29 to Richmond
- Migration from Richmond to Hartford: 220 (#42 most common destination from Richmond)
- Net migration: 29 to Richmond

19 / 50
PghPhxNfk // Wikimedia Commons
#32. Columbus, GA-AL Metro Area
- Migration to Columbus in 2014-2018: 251
- Migration from Columbus to Hartford: 27 (#92 most common destination from Columbus)
- Net migration: 224 to Columbus
- Migration from Columbus to Hartford: 27 (#92 most common destination from Columbus)
- Net migration: 224 to Columbus

20 / 50
Kevin Ruck // Shutterstock
#31. Augusta-Richmond County, GA-SC Metro Area
- Migration to Augusta in 2014-2018: 259
- Migration from Augusta to Hartford: 0
- Net migration: 259 to Augusta
- Migration from Augusta to Hartford: 0
- Net migration: 259 to Augusta
21 / 50
Public Domain
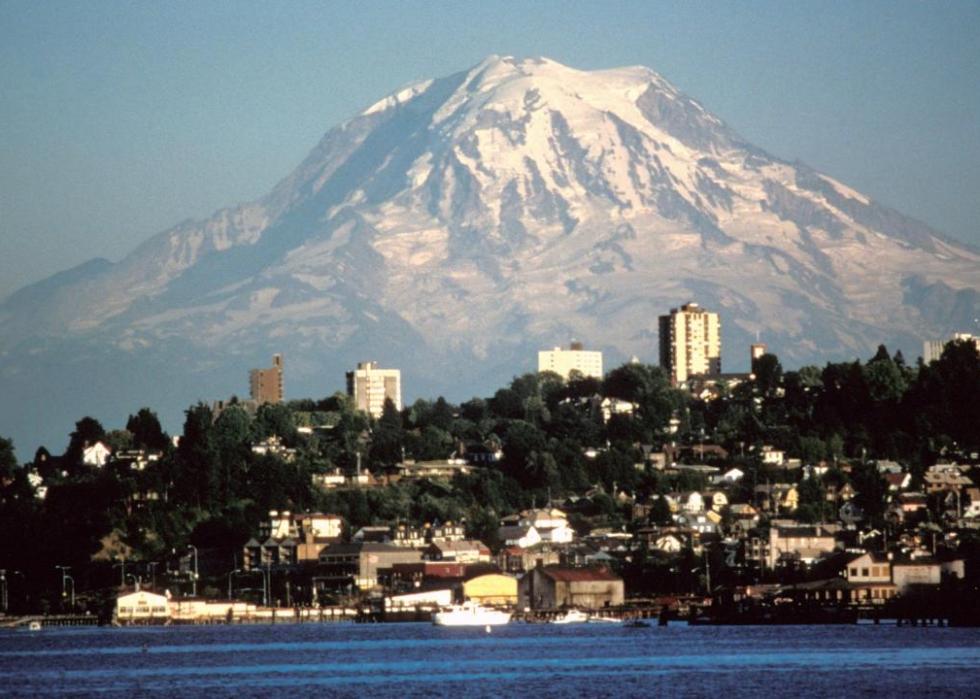
#30. Seattle-Tacoma-Bellevue, WA Metro Area
- Migration to Seattle in 2014-2018: 259
- Migration from Seattle to Hartford: 141 (#123 most common destination from Seattle)
- Net migration: 118 to Seattle
- Migration from Seattle to Hartford: 141 (#123 most common destination from Seattle)
- Net migration: 118 to Seattle

22 / 50
Sherry V Smith // Shutterstock
#29. Virginia Beach-Norfolk-Newport News, VA-NC Metro Area
- Migration to Virginia Beach in 2014-2018: 261
- Migration from Virginia Beach to Hartford: 126 (#102 most common destination from Virginia Beach)
- Net migration: 135 to Virginia Beach
- Migration from Virginia Beach to Hartford: 126 (#102 most common destination from Virginia Beach)
- Net migration: 135 to Virginia Beach
23 / 50
MicheleHaro // Wikimedia
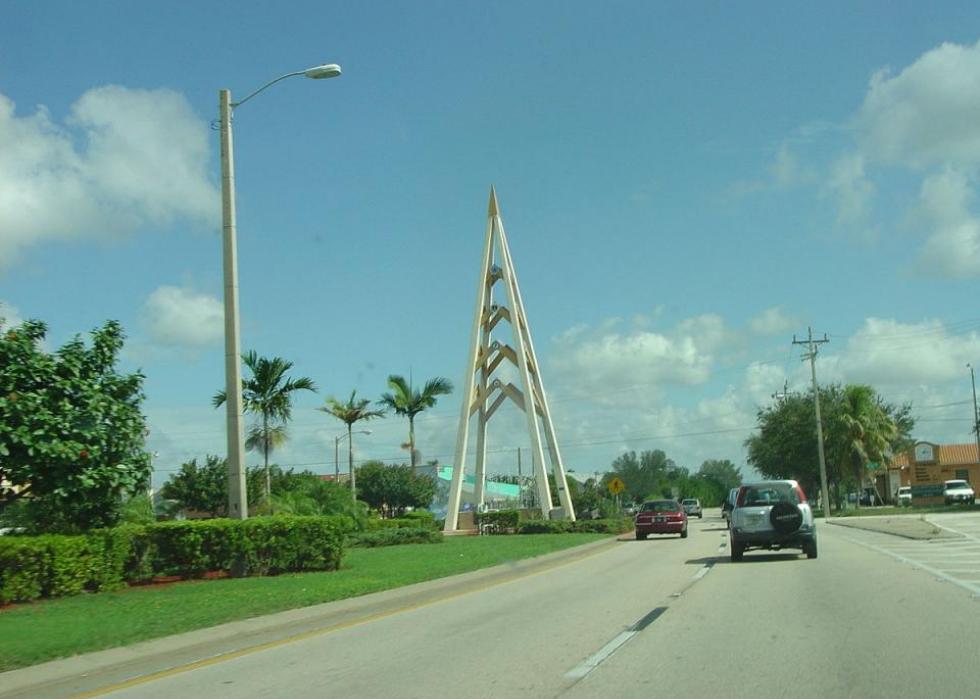
#28. Palm Bay-Melbourne-Titusville, FL Metro Area
- Migration to Palm Bay in 2014-2018: 263
- Migration from Palm Bay to Hartford: 21 (#136 most common destination from Palm Bay)
- Net migration: 242 to Palm Bay
- Migration from Palm Bay to Hartford: 21 (#136 most common destination from Palm Bay)
- Net migration: 242 to Palm Bay

24 / 50
Theresa Marconi // Wikimedia Commons
#27. Rochester, NY Metro Area
- Migration to Rochester in 2014-2018: 279
- Migration from Rochester to Hartford: 115 (#47 most common destination from Rochester)
- Net migration: 164 to Rochester
- Migration from Rochester to Hartford: 115 (#47 most common destination from Rochester)
- Net migration: 164 to Rochester

25 / 50
Akhenaton06 // Wikicommons
#26. Columbia, SC Metro Area
- Migration to Columbia in 2014-2018: 280
- Migration from Columbia to Hartford: 0
- Net migration: 280 to Columbia
- Migration from Columbia to Hartford: 0
- Net migration: 280 to Columbia

26 / 50
Joseph Sohm // Shutterstock
#25. Portland-South Portland, ME Metro Area
- Migration to Portland in 2014-2018: 299
- Migration from Portland to Hartford: 276 (#9 most common destination from Portland)
- Net migration: 23 to Portland
- Migration from Portland to Hartford: 276 (#9 most common destination from Portland)
- Net migration: 23 to Portland
27 / 50
Sanibel Sun // WikiCommons
#24. Cape Coral-Fort Myers, FL Metro Area
- Migration to Cape Coral in 2014-2018: 314
- Migration from Cape Coral to Hartford: 162 (#31 most common destination from Cape Coral)
- Net migration: 152 to Cape Coral
- Migration from Cape Coral to Hartford: 162 (#31 most common destination from Cape Coral)
- Net migration: 152 to Cape Coral
28 / 50
DANIEL SLIM/AFP // Getty Images
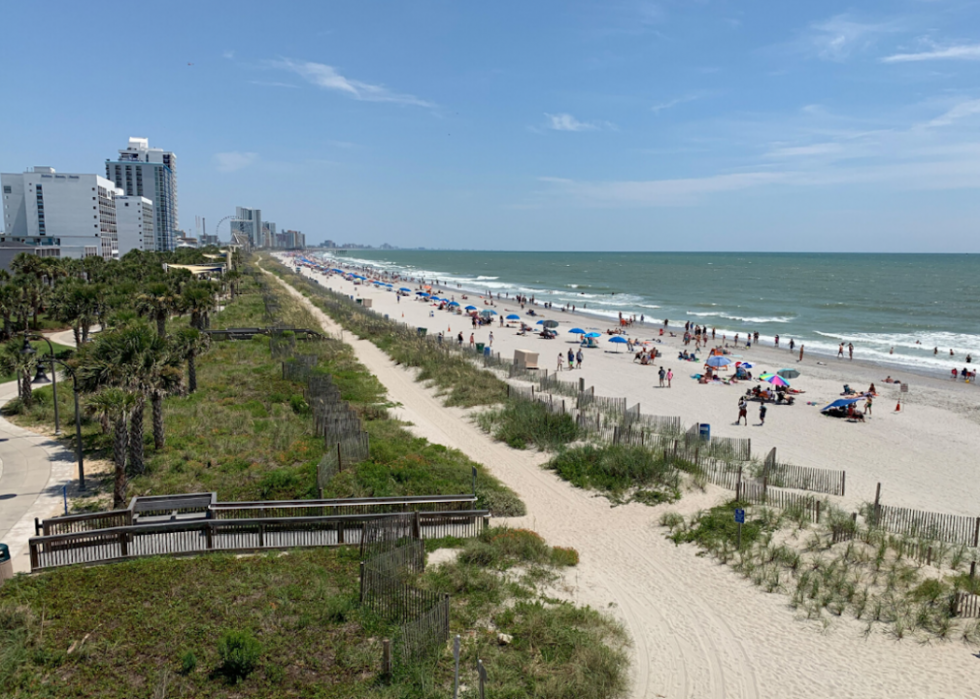
#23. Myrtle Beach-Conway-North Myrtle Beach, SC-NC Metro Area
- Migration to Myrtle Beach in 2014-2018: 329
- Migration from Myrtle Beach to Hartford: 71 (#57 most common destination from Myrtle Beach)
- Net migration: 258 to Myrtle Beach
- Migration from Myrtle Beach to Hartford: 71 (#57 most common destination from Myrtle Beach)
- Net migration: 258 to Myrtle Beach

29 / 50
Alan Botting // Wikimedia Commons
#22. Dallas-Fort Worth-Arlington, TX Metro Area
- Migration to Dallas in 2014-2018: 329
- Migration from Dallas to Hartford: 129 (#159 most common destination from Dallas)
- Net migration: 200 to Dallas
- Migration from Dallas to Hartford: 129 (#159 most common destination from Dallas)
- Net migration: 200 to Dallas
30 / 50
Yinan Chen // Wikimedia
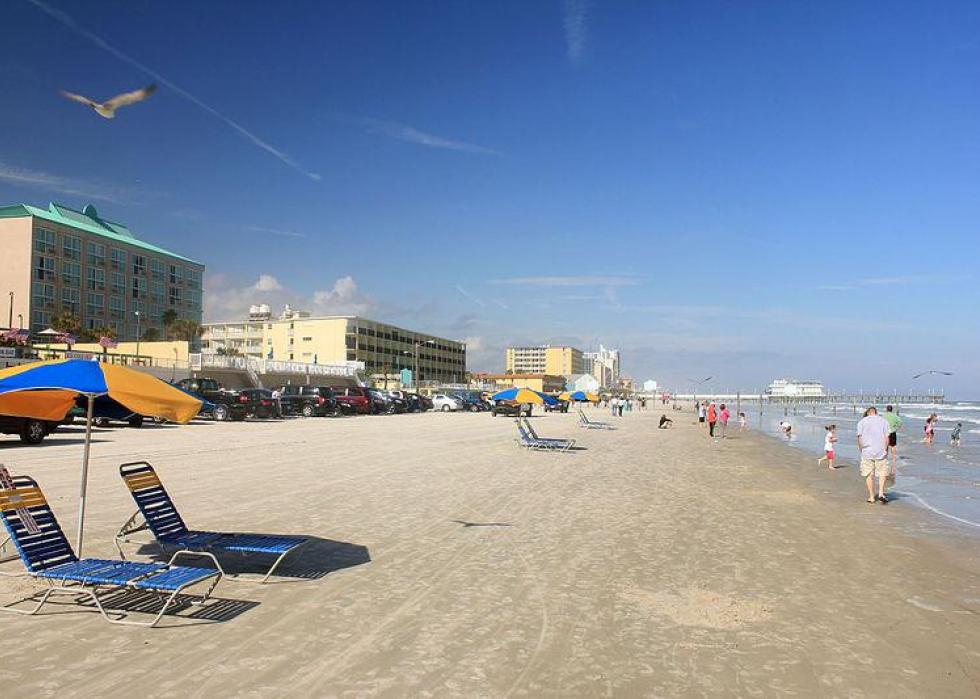
#21. Deltona-Daytona Beach-Ormond Beach, FL Metro Area
- Migration to Deltona in 2014-2018: 348
- Migration from Deltona to Hartford: 46 (#80 most common destination from Deltona)
- Net migration: 302 to Deltona
- Migration from Deltona to Hartford: 46 (#80 most common destination from Deltona)
- Net migration: 302 to Deltona

31 / 50
VisitCentralFL // Flickr
#20. Lakeland-Winter Haven, FL Metro Area
- Migration to Lakeland in 2014-2018: 351
- Migration from Lakeland to Hartford: 6 (#174 most common destination from Lakeland)
- Net migration: 345 to Lakeland
- Migration from Lakeland to Hartford: 6 (#174 most common destination from Lakeland)
- Net migration: 345 to Lakeland

32 / 50
en:User:Paul.h // Wikimedia
#19. San Francisco-Oakland-Hayward, CA Metro Area
- Migration to San Francisco in 2014-2018: 375
- Migration from San Francisco to Hartford: 163 (#98 most common destination from San Francisco)
- Net migration: 212 to San Francisco
- Migration from San Francisco to Hartford: 163 (#98 most common destination from San Francisco)
- Net migration: 212 to San Francisco

33 / 50
BDS2006 // Wikimedia
#18. Los Angeles-Long Beach-Anaheim, CA Metro Area
- Migration to Los Angeles in 2014-2018: 392
- Migration from Los Angeles to Hartford: 446 (#93 most common destination from Los Angeles)
- Net migration: 54 to Hartford
- Migration from Los Angeles to Hartford: 446 (#93 most common destination from Los Angeles)
- Net migration: 54 to Hartford

34 / 50
Christopher & Amy Esposito // Wikicommons
#17. Chicago-Naperville-Elgin, IL-IN-WI Metro Area
- Migration to Chicago in 2014-2018: 416
- Migration from Chicago to Hartford: 231 (#150 most common destination from Chicago)
- Net migration: 185 to Chicago
- Migration from Chicago to Hartford: 231 (#150 most common destination from Chicago)
- Net migration: 185 to Chicago
35 / 50
Pat McGinley // Shutterstock
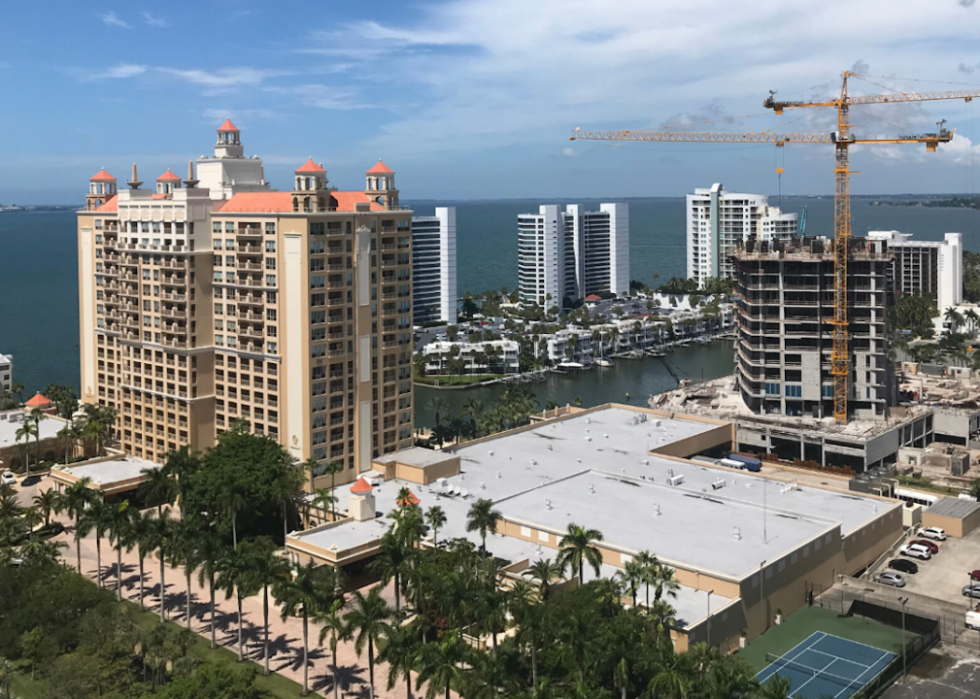
#16. North Port-Sarasota-Bradenton, FL Metro Area
- Migration to North Port in 2014-2018: 470
- Migration from North Port to Hartford: 99 (#59 most common destination from North Port)
- Net migration: 371 to North Port
- Migration from North Port to Hartford: 99 (#59 most common destination from North Port)
- Net migration: 371 to North Port

36 / 50
Songquan Deng // Shutterstock
#15. Orlando-Kissimmee-Sanford, FL Metro Area
- Migration to Orlando in 2014-2018: 715
- Migration from Orlando to Hartford: 323 (#54 most common destination from Orlando)
- Net migration: 392 to Orlando
- Migration from Orlando to Hartford: 323 (#54 most common destination from Orlando)
- Net migration: 392 to Orlando

37 / 50
Andrew Bossi // Wikimedia
#14. Washington-Arlington-Alexandria, DC-VA-MD-WV Metro Area
- Migration to Washington in 2014-2018: 715
- Migration from Washington to Hartford: 349 (#116 most common destination from Washington)
- Net migration: 366 to Washington
- Migration from Washington to Hartford: 349 (#116 most common destination from Washington)
- Net migration: 366 to Washington

38 / 50
BusinessEditorUSA // Wikimedia Commons
#13. Charlotte-Concord-Gastonia, NC-SC Metro Area
- Migration to Charlotte in 2014-2018: 761
- Migration from Charlotte to Hartford: 219 (#68 most common destination from Charlotte)
- Net migration: 542 to Charlotte
- Migration from Charlotte to Hartford: 219 (#68 most common destination from Charlotte)
- Net migration: 542 to Charlotte

39 / 50
f11photo // Shutterstock
#12. Philadelphia-Camden-Wilmington, PA-NJ-DE-MD Metro Area
- Migration to Philadelphia in 2014-2018: 780
- Migration from Philadelphia to Hartford: 543 (#59 most common destination from Philadelphia)
- Net migration: 237 to Philadelphia
- Migration from Philadelphia to Hartford: 543 (#59 most common destination from Philadelphia)
- Net migration: 237 to Philadelphia

40 / 50
Alvesgaspar // Wikimedia
#11. Tampa-St. Petersburg-Clearwater, FL Metro Area
- Migration to Tampa in 2014-2018: 835
- Migration from Tampa to Hartford: 192 (#92 most common destination from Tampa)
- Net migration: 643 to Tampa
- Migration from Tampa to Hartford: 192 (#92 most common destination from Tampa)
- Net migration: 643 to Tampa

41 / 50
Kolossos // Wikimedia Commons
#10. Miami-Fort Lauderdale-West Palm Beach, FL Metro Area
- Migration to Miami in 2014-2018: 977
- Migration from Miami to Hartford: 503 (#58 most common destination from Miami)
- Net migration: 474 to Miami
- Migration from Miami to Hartford: 503 (#58 most common destination from Miami)
- Net migration: 474 to Miami

42 / 50
spablab // Flickr
#9. Providence-Warwick, RI-MA Metro Area
- Migration to Providence in 2014-2018: 1,176
- Migration from Providence to Hartford: 641 (#12 most common destination from Providence)
- Net migration: 535 to Providence
- Migration from Providence to Hartford: 641 (#12 most common destination from Providence)
- Net migration: 535 to Providence
43 / 50
John Phelan // Wikimedia Commons
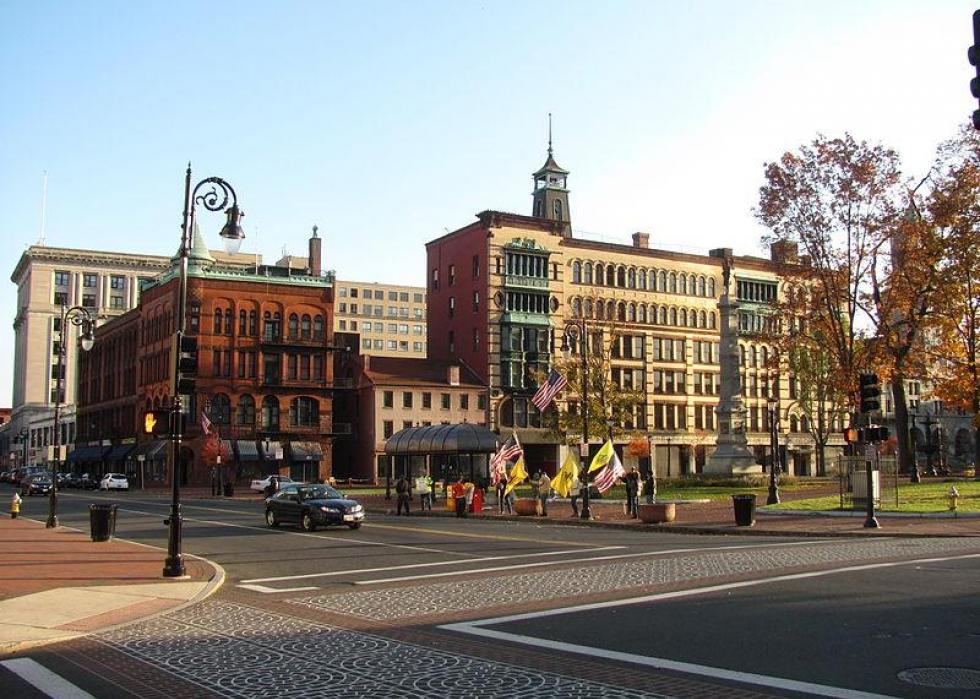
#8. Springfield, MA Metro Area
- Migration to Springfield in 2014-2018: 1,489
- Migration from Springfield to Hartford: 2,208 (#2 most common destination from Springfield)
- Net migration: 719 to Hartford
- Migration from Springfield to Hartford: 2,208 (#2 most common destination from Springfield)
- Net migration: 719 to Hartford

44 / 50
Keizers // Wikimedia Commons
#7. Atlanta-Sandy Springs-Roswell, GA Metro Area
- Migration to Atlanta in 2014-2018: 1,559
- Migration from Atlanta to Hartford: 494 (#76 most common destination from Atlanta)
- Net migration: 1,065 to Atlanta
- Migration from Atlanta to Hartford: 494 (#76 most common destination from Atlanta)
- Net migration: 1,065 to Atlanta

45 / 50
John Phelan // Wikimedia
#6. Worcester, MA-CT Metro Area
- Migration to Worcester in 2014-2018: 2,006
- Migration from Worcester to Hartford: 2,224 (#4 most common destination from Worcester)
- Net migration: 218 to Hartford
- Migration from Worcester to Hartford: 2,224 (#4 most common destination from Worcester)
- Net migration: 218 to Hartford

46 / 50
JonathanVictor // Wikimedia
#5. Bridgeport-Stamford-Norwalk, CT Metro Area
- Migration to Bridgeport in 2014-2018: 2,094
- Migration from Bridgeport to Hartford: 4,388 (#3 most common destination from Bridgeport)
- Net migration: 2,294 to Hartford
- Migration from Bridgeport to Hartford: 4,388 (#3 most common destination from Bridgeport)
- Net migration: 2,294 to Hartford

47 / 50
King of Hearts // Wikimedia
#4. New York-Newark-Jersey City, NY-NJ-PA Metro Area
- Migration to New York in 2014-2018: 2,284
- Migration from New York to Hartford: 4,135 (#28 most common destination from New York)
- Net migration: 1,851 to Hartford
- Migration from New York to Hartford: 4,135 (#28 most common destination from New York)
- Net migration: 1,851 to Hartford

48 / 50
Michael Dubenetsky // Shutterstock
#3. Norwich-New London, CT Metro Area
- Migration to Norwich in 2014-2018: 2,561
- Migration from Norwich to Hartford: 3,035 (#1 most common destination from Norwich)
- Net migration: 474 to Hartford
- Migration from Norwich to Hartford: 3,035 (#1 most common destination from Norwich)
- Net migration: 474 to Hartford

49 / 50
Sean Pavone // Shutterstock
#2. Boston-Cambridge-Newton, MA-NH Metro Area
- Migration to Boston in 2014-2018: 2,666
- Migration from Boston to Hartford: 1,919 (#15 most common destination from Boston)
- Net migration: 747 to Boston
- Migration from Boston to Hartford: 1,919 (#15 most common destination from Boston)
- Net migration: 747 to Boston

50 / 50
John Phelan // Wikimedia Commons
#1. New Haven-Milford, CT Metro Area
- Migration to New Haven in 2014-2018: 6,570
- Migration from New Haven to Hartford: 6,984 (#1 most common destination from New Haven)
- Net migration: 414 to Hartford
- Migration from New Haven to Hartford: 6,984 (#1 most common destination from New Haven)
- Net migration: 414 to Hartford


