
Where people in Las Vegas are moving to most
Written by:
April 18, 2021
randy andy // Shutterstock
Where people in Las Vegas are moving to most
Stacker compiled a list of where people in Las Vegas are moving to the most using data from the U.S. Census Bureau. Metros are ranked by the estimated number of people who moved to the metro from Las Vegas between 2014 and 2018. Ties were broken by gross migration.

1 / 50
Sean Pavone // Shutterstock
#50. Columbus, OH Metro Area
- Migration to Columbus in 2014-2018: 294
- Migration from Columbus to Las Vegas: 103 (#90 most common destination from Columbus)
- Net migration: 191 to Columbus
- Migration from Columbus to Las Vegas: 103 (#90 most common destination from Columbus)
- Net migration: 191 to Columbus
2 / 50
Martha.baden // Wikimedia
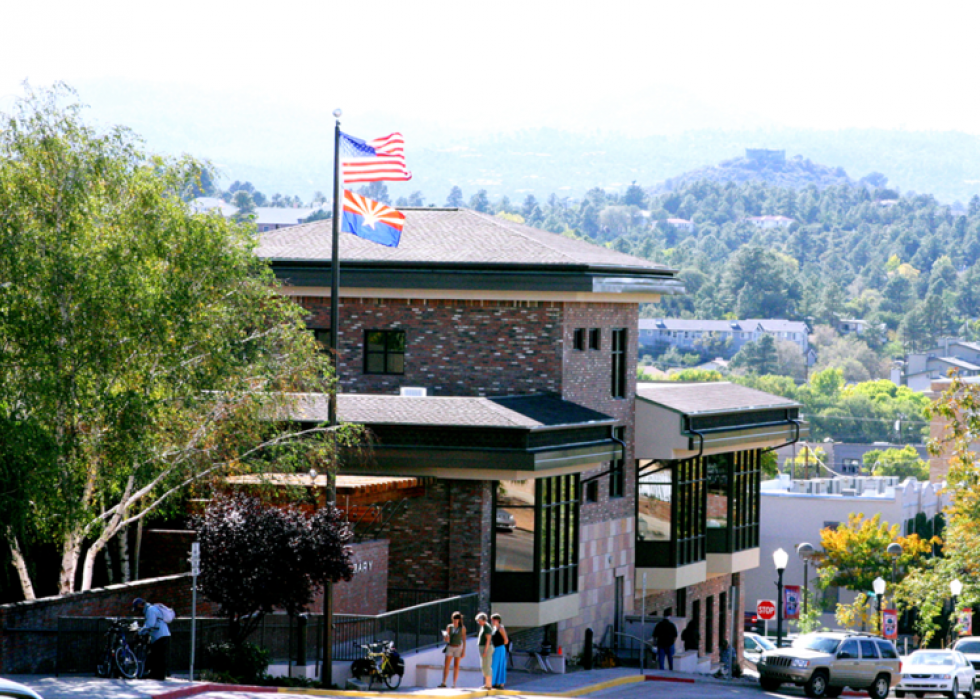
#49. Prescott, AZ Metro Area
- Migration to Prescott in 2014-2018: 298
- Migration from Prescott to Las Vegas: 196 (#10 most common destination from Prescott)
- Net migration: 102 to Prescott
- Migration from Prescott to Las Vegas: 196 (#10 most common destination from Prescott)
- Net migration: 102 to Prescott

3 / 50
Pixabay
#48. Austin-Round Rock, TX Metro Area
- Migration to Austin in 2014-2018: 301
- Migration from Austin to Las Vegas: 292 (#49 most common destination from Austin)
- Net migration: 9 to Austin
- Migration from Austin to Las Vegas: 292 (#49 most common destination from Austin)
- Net migration: 9 to Austin

4 / 50
ideatrendz //Wikicommons
#47. Kahului-Wailuku-Lahaina, HI Metro Area
- Migration to Kahului in 2014-2018: 311
- Migration from Kahului to Las Vegas: 784 (#2 most common destination from Kahului)
- Net migration: 473 to Las Vegas
- Migration from Kahului to Las Vegas: 784 (#2 most common destination from Kahului)
- Net migration: 473 to Las Vegas

5 / 50
Don Ramey Logan // Wikicommons
#46. San Jose-Sunnyvale-Santa Clara, CA Metro Area
- Migration to San Jose in 2014-2018: 327
- Migration from San Jose to Las Vegas: 1,349 (#17 most common destination from San Jose)
- Net migration: 1,022 to Las Vegas
- Migration from San Jose to Las Vegas: 1,349 (#17 most common destination from San Jose)
- Net migration: 1,022 to Las Vegas

6 / 50
Stephen Zimmermann // Wikimedia Commons
#45. Buffalo-Cheektowaga-Niagara Falls, NY Metro Area
- Migration to Buffalo in 2014-2018: 352
- Migration from Buffalo to Las Vegas: 155 (#49 most common destination from Buffalo)
- Net migration: 197 to Buffalo
- Migration from Buffalo to Las Vegas: 155 (#49 most common destination from Buffalo)
- Net migration: 197 to Buffalo

7 / 50
Blankfaze // Wikimedia Commons
#44. Pensacola-Ferry Pass-Brent, FL Metro Area
- Migration to Pensacola in 2014-2018: 359
- Migration from Pensacola to Las Vegas: 85 (#80 most common destination from Pensacola)
- Net migration: 274 to Pensacola
- Migration from Pensacola to Las Vegas: 85 (#80 most common destination from Pensacola)
- Net migration: 274 to Pensacola

8 / 50
Epccedu // Wikimedia Commons
#43. El Paso, TX Metro Area
- Migration to El Paso in 2014-2018: 369
- Migration from El Paso to Las Vegas: 202 (#47 most common destination from El Paso)
- Net migration: 167 to El Paso
- Migration from El Paso to Las Vegas: 202 (#47 most common destination from El Paso)
- Net migration: 167 to El Paso
9 / 50
Boise Metro Chamber // Flickr
#42. Boise City, ID Metro Area
- Migration to Boise City in 2014-2018: 409
- Migration from Boise City to Las Vegas: 311 (#16 most common destination from Boise City)
- Net migration: 98 to Boise City
- Migration from Boise City to Las Vegas: 311 (#16 most common destination from Boise City)
- Net migration: 98 to Boise City

10 / 50
Kolossos // Wikimedia Commons
#41. Miami-Fort Lauderdale-West Palm Beach, FL Metro Area
- Migration to Miami in 2014-2018: 414
- Migration from Miami to Las Vegas: 1,132 (#30 most common destination from Miami)
- Net migration: 718 to Las Vegas
- Migration from Miami to Las Vegas: 1,132 (#30 most common destination from Miami)
- Net migration: 718 to Las Vegas

11 / 50
Public Domain
#40. Modesto, CA Metro Area
- Migration to Modesto in 2014-2018: 430
- Migration from Modesto to Las Vegas: 58 (#47 most common destination from Modesto)
- Net migration: 372 to Modesto
- Migration from Modesto to Las Vegas: 58 (#47 most common destination from Modesto)
- Net migration: 372 to Modesto
12 / 50
Scott Catron // Wikimedia Commons
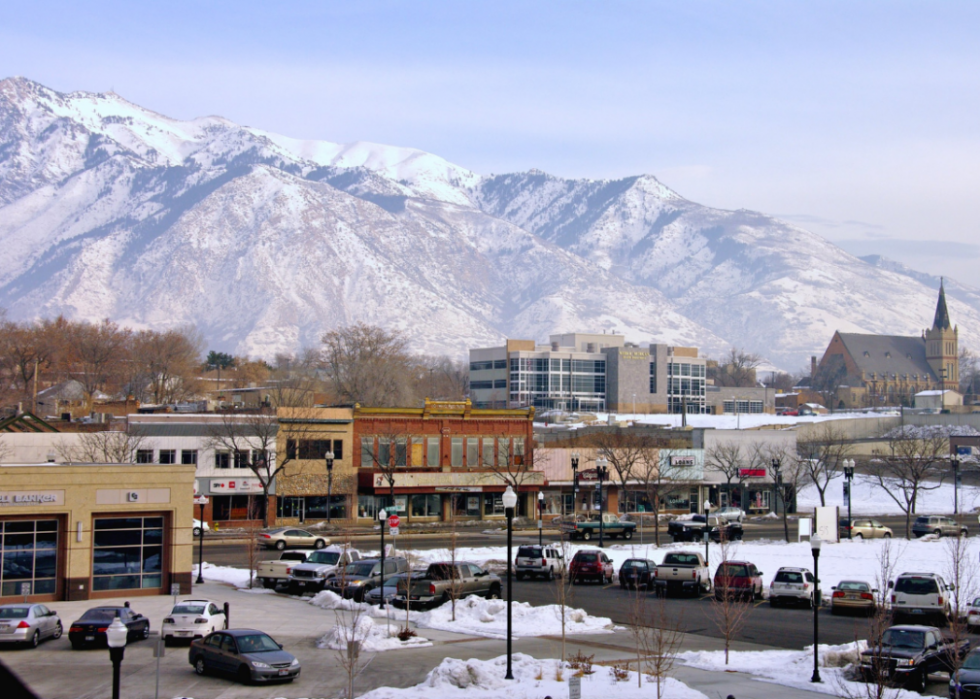
#39. Ogden-Clearfield, UT Metro Area
- Migration to Ogden in 2014-2018: 436
- Migration from Ogden to Las Vegas: 854 (#6 most common destination from Ogden)
- Net migration: 418 to Las Vegas
- Migration from Ogden to Las Vegas: 854 (#6 most common destination from Ogden)
- Net migration: 418 to Las Vegas

13 / 50
M.Bucka // Wikimedia Commons
#38. Albuquerque, NM Metro Area
- Migration to Albuquerque in 2014-2018: 447
- Migration from Albuquerque to Las Vegas: 840 (#7 most common destination from Albuquerque)
- Net migration: 393 to Las Vegas
- Migration from Albuquerque to Las Vegas: 840 (#7 most common destination from Albuquerque)
- Net migration: 393 to Las Vegas

14 / 50
j.s. clark // Wikimedia Commons
#37. Panama City, FL Metro Area
- Migration to Panama City in 2014-2018: 448
- Migration from Panama City to Las Vegas: 48 (#60 most common destination from Panama City)
- Net migration: 400 to Panama City
- Migration from Panama City to Las Vegas: 48 (#60 most common destination from Panama City)
- Net migration: 400 to Panama City

15 / 50
TommyBrison // Shutterstock
#36. Kansas City, MO-KS Metro Area
- Migration to Kansas City in 2014-2018: 460
- Migration from Kansas City to Las Vegas: 203 (#65 most common destination from Kansas City)
- Net migration: 257 to Kansas City
- Migration from Kansas City to Las Vegas: 203 (#65 most common destination from Kansas City)
- Net migration: 257 to Kansas City

16 / 50
Sean Pavone // Shutterstock
#35. Boston-Cambridge-Newton, MA-NH Metro Area
- Migration to Boston in 2014-2018: 473
- Migration from Boston to Las Vegas: 482 (#56 most common destination from Boston)
- Net migration: 9 to Las Vegas
- Migration from Boston to Las Vegas: 482 (#56 most common destination from Boston)
- Net migration: 9 to Las Vegas

17 / 50
f11photo // Shutterstock
#34. Philadelphia-Camden-Wilmington, PA-NJ-DE-MD Metro Area
- Migration to Philadelphia in 2014-2018: 493
- Migration from Philadelphia to Las Vegas: 850 (#38 most common destination from Philadelphia)
- Net migration: 357 to Las Vegas
- Migration from Philadelphia to Las Vegas: 850 (#38 most common destination from Philadelphia)
- Net migration: 357 to Las Vegas

18 / 50
Songquan Deng // Shutterstock
#33. Orlando-Kissimmee-Sanford, FL Metro Area
- Migration to Orlando in 2014-2018: 519
- Migration from Orlando to Las Vegas: 658 (#26 most common destination from Orlando)
- Net migration: 139 to Las Vegas
- Migration from Orlando to Las Vegas: 658 (#26 most common destination from Orlando)
- Net migration: 139 to Las Vegas

19 / 50
Keizers // Wikimedia Commons
#32. Atlanta-Sandy Springs-Roswell, GA Metro Area
- Migration to Atlanta in 2014-2018: 551
- Migration from Atlanta to Las Vegas: 826 (#55 most common destination from Atlanta)
- Net migration: 275 to Las Vegas
- Migration from Atlanta to Las Vegas: 826 (#55 most common destination from Atlanta)
- Net migration: 275 to Las Vegas

20 / 50
Sean Pavone // Shutterstock
#31. St. Louis, MO-IL Metro Area
- Migration to St. Louis in 2014-2018: 557
- Migration from St. Louis to Las Vegas: 570 (#31 most common destination from St. Louis)
- Net migration: 13 to Las Vegas
- Migration from St. Louis to Las Vegas: 570 (#31 most common destination from St. Louis)
- Net migration: 13 to Las Vegas

21 / 50
BusinessEditorUSA // Wikimedia Commons
#30. Charlotte-Concord-Gastonia, NC-SC Metro Area
- Migration to Charlotte in 2014-2018: 572
- Migration from Charlotte to Las Vegas: 480 (#37 most common destination from Charlotte)
- Net migration: 92 to Charlotte
- Migration from Charlotte to Las Vegas: 480 (#37 most common destination from Charlotte)
- Net migration: 92 to Charlotte

22 / 50
EPoelzl // Flickr
#29. Carson City, NV Metro Area
- Migration to Carson City in 2014-2018: 574
- Migration from Carson City to Las Vegas: 146 (#3 most common destination from Carson City)
- Net migration: 428 to Carson City
- Migration from Carson City to Las Vegas: 146 (#3 most common destination from Carson City)
- Net migration: 428 to Carson City
23 / 50
Tony Webster // Wikicommons
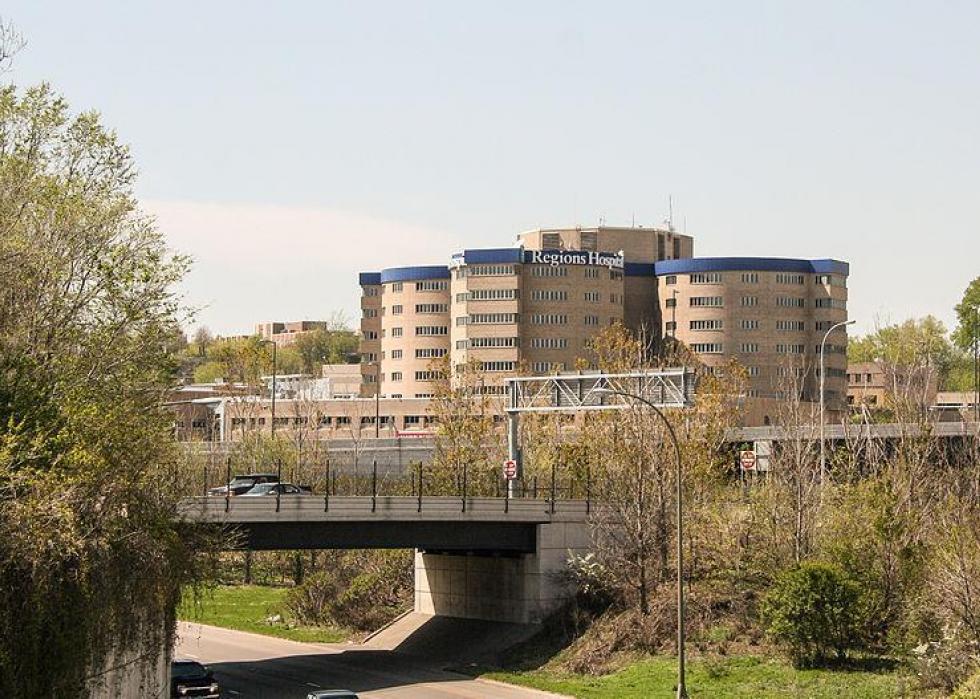
#28. Minneapolis-St. Paul-Bloomington, MN-WI Metro Area
- Migration to Minneapolis in 2014-2018: 581
- Migration from Minneapolis to Las Vegas: 1,214 (#17 most common destination from Minneapolis)
- Net migration: 633 to Las Vegas
- Migration from Minneapolis to Las Vegas: 1,214 (#17 most common destination from Minneapolis)
- Net migration: 633 to Las Vegas

24 / 50
King of Hearts // Wikimedia
#27. New York-Newark-Jersey City, NY-NJ-PA Metro Area
- Migration to New York in 2014-2018: 630
- Migration from New York to Las Vegas: 2,639 (#43 most common destination from New York)
- Net migration: 2,009 to Las Vegas
- Migration from New York to Las Vegas: 2,639 (#43 most common destination from New York)
- Net migration: 2,009 to Las Vegas

25 / 50
Edmund Garman // Flickr
#26. Urban Honolulu, HI Metro Area
- Migration to Urban Honolulu in 2014-2018: 644
- Migration from Urban Honolulu to Las Vegas: 2,450 (#1 most common destination from Urban Honolulu)
- Net migration: 1,806 to Las Vegas
- Migration from Urban Honolulu to Las Vegas: 2,450 (#1 most common destination from Urban Honolulu)
- Net migration: 1,806 to Las Vegas

26 / 50
Sherry V Smith // Shutterstock
#25. Virginia Beach-Norfolk-Newport News, VA-NC Metro Area
- Migration to Virginia Beach in 2014-2018: 653
- Migration from Virginia Beach to Las Vegas: 334 (#54 most common destination from Virginia Beach)
- Net migration: 319 to Virginia Beach
- Migration from Virginia Beach to Las Vegas: 334 (#54 most common destination from Virginia Beach)
- Net migration: 319 to Virginia Beach

27 / 50
PhotosByMahin // Pixabay
#24. Detroit-Warren-Dearborn, MI Metro Area
- Migration to Detroit in 2014-2018: 653
- Migration from Detroit to Las Vegas: 845 (#24 most common destination from Detroit)
- Net migration: 192 to Las Vegas
- Migration from Detroit to Las Vegas: 845 (#24 most common destination from Detroit)
- Net migration: 192 to Las Vegas

28 / 50
Zereshk // Wikimedia
#23. Tucson, AZ Metro Area
- Migration to Tucson in 2014-2018: 696
- Migration from Tucson to Las Vegas: 675 (#12 most common destination from Tucson)
- Net migration: 21 to Tucson
- Migration from Tucson to Las Vegas: 675 (#12 most common destination from Tucson)
- Net migration: 21 to Tucson

29 / 50
Robert Corby // Wikimedia Commons
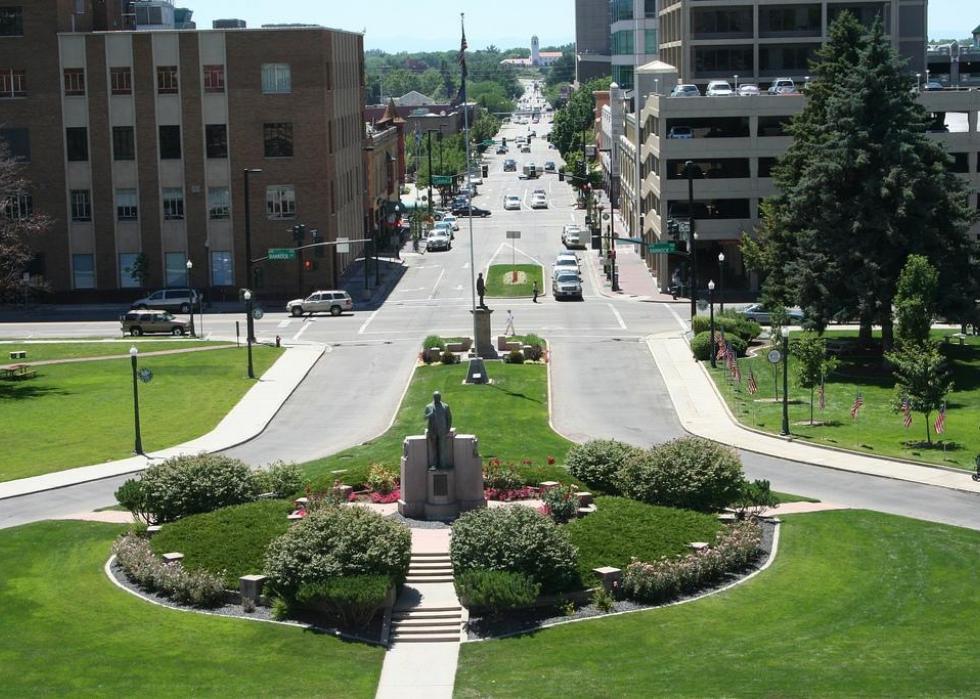
#22. Colorado Springs, CO Metro Area
- Migration to Colorado Springs in 2014-2018: 736
- Migration from Colorado Springs to Las Vegas: 273 (#42 most common destination from Colorado Springs)
- Net migration: 463 to Colorado Springs
- Migration from Colorado Springs to Las Vegas: 273 (#42 most common destination from Colorado Springs)
- Net migration: 463 to Colorado Springs

30 / 50
MojaveNC // Wikimedia
#21. St. George, UT Metro Area
- Migration to St. George in 2014-2018: 750
- Migration from St. George to Las Vegas: 667 (#4 most common destination from St. George)
- Net migration: 83 to St. George
- Migration from St. George to Las Vegas: 667 (#4 most common destination from St. George)
- Net migration: 83 to St. George

31 / 50
Andrew Bossi // Wikimedia
#20. Washington-Arlington-Alexandria, DC-VA-MD-WV Metro Area
- Migration to Washington in 2014-2018: 767
- Migration from Washington to Las Vegas: 867 (#61 most common destination from Washington)
- Net migration: 100 to Las Vegas
- Migration from Washington to Las Vegas: 867 (#61 most common destination from Washington)
- Net migration: 100 to Las Vegas
32 / 50
Frank K. // Wikicommons
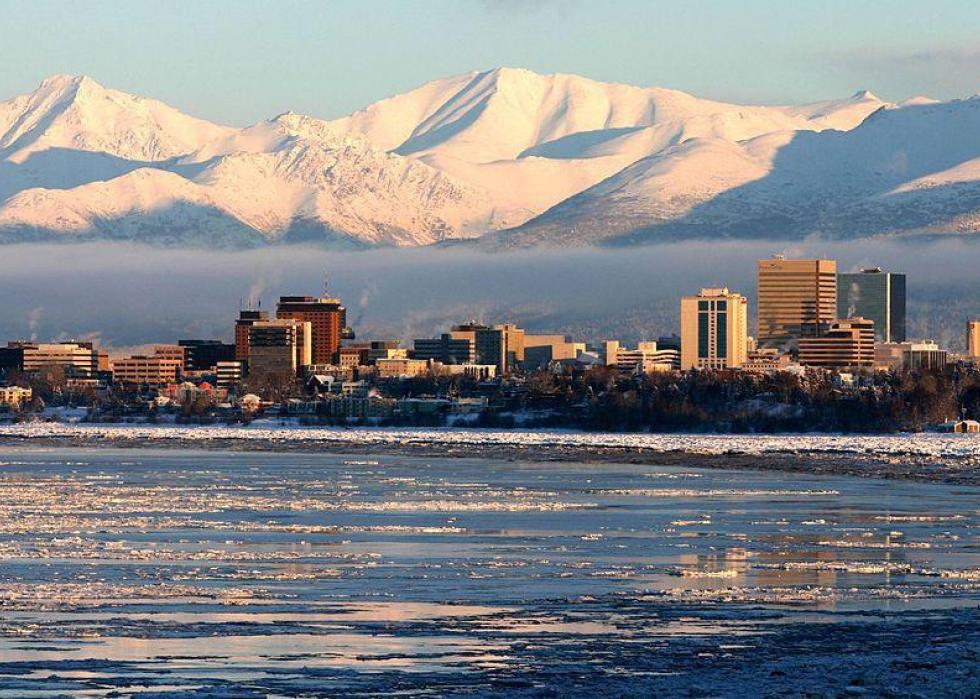
#19. Anchorage, AK Metro Area
- Migration to Anchorage in 2014-2018: 776
- Migration from Anchorage to Las Vegas: 552 (#9 most common destination from Anchorage)
- Net migration: 224 to Anchorage
- Migration from Anchorage to Las Vegas: 552 (#9 most common destination from Anchorage)
- Net migration: 224 to Anchorage

33 / 50
Sean Pavone // Shutterstock
#18. Indianapolis-Carmel-Anderson, IN Metro Area
- Migration to Indianapolis in 2014-2018: 819
- Migration from Indianapolis to Las Vegas: 264 (#51 most common destination from Indianapolis)
- Net migration: 555 to Indianapolis
- Migration from Indianapolis to Las Vegas: 264 (#51 most common destination from Indianapolis)
- Net migration: 555 to Indianapolis

34 / 50
Stuart Seeger // Wikicommons
#17. Portland-Vancouver-Hillsboro, OR-WA Metro Area
- Migration to Portland in 2014-2018: 938
- Migration from Portland to Las Vegas: 1,021 (#17 most common destination from Portland)
- Net migration: 83 to Las Vegas
- Migration from Portland to Las Vegas: 1,021 (#17 most common destination from Portland)
- Net migration: 83 to Las Vegas

35 / 50
Pixabay
#16. San Antonio-New Braunfels, TX Metro Area
- Migration to San Antonio in 2014-2018: 949
- Migration from San Antonio to Las Vegas: 349 (#45 most common destination from San Antonio)
- Net migration: 600 to San Antonio
- Migration from San Antonio to Las Vegas: 349 (#45 most common destination from San Antonio)
- Net migration: 600 to San Antonio

36 / 50
Ben P L // Wikimedia Commons
#15. Provo-Orem, UT Metro Area
- Migration to Provo in 2014-2018: 1,028
- Migration from Provo to Las Vegas: 619 (#9 most common destination from Provo)
- Net migration: 409 to Provo
- Migration from Provo to Las Vegas: 619 (#9 most common destination from Provo)
- Net migration: 409 to Provo

37 / 50
Pixabay
#14. Sacramento--Roseville--Arden-Arcade, CA Metro Area
- Migration to Sacramento in 2014-2018: 1,037
- Migration from Sacramento to Las Vegas: 928 (#22 most common destination from Sacramento)
- Net migration: 109 to Sacramento
- Migration from Sacramento to Las Vegas: 928 (#22 most common destination from Sacramento)
- Net migration: 109 to Sacramento

38 / 50
Christopher & Amy Esposito // Wikicommons
#13. Chicago-Naperville-Elgin, IL-IN-WI Metro Area
- Migration to Chicago in 2014-2018: 1,133
- Migration from Chicago to Las Vegas: 2,441 (#30 most common destination from Chicago)
- Net migration: 1,308 to Las Vegas
- Migration from Chicago to Las Vegas: 2,441 (#30 most common destination from Chicago)
- Net migration: 1,308 to Las Vegas
39 / 50
en:User:Paul.h // Wikimedia
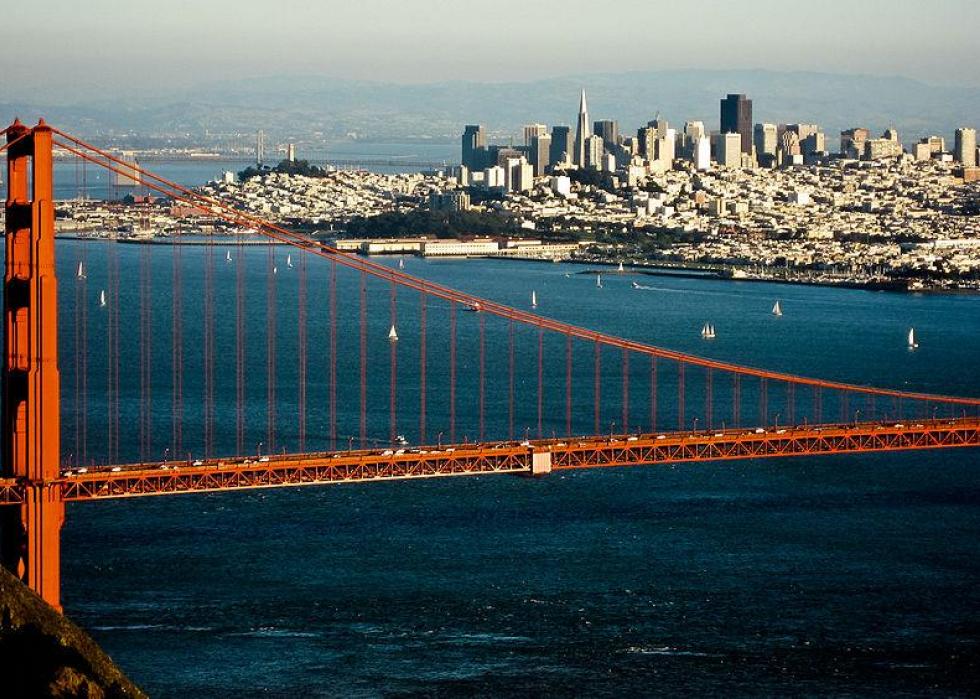
#12. San Francisco-Oakland-Hayward, CA Metro Area
- Migration to San Francisco in 2014-2018: 1,209
- Migration from San Francisco to Las Vegas: 2,165 (#21 most common destination from San Francisco)
- Net migration: 956 to Las Vegas
- Migration from San Francisco to Las Vegas: 2,165 (#21 most common destination from San Francisco)
- Net migration: 956 to Las Vegas
40 / 50
Public Domain
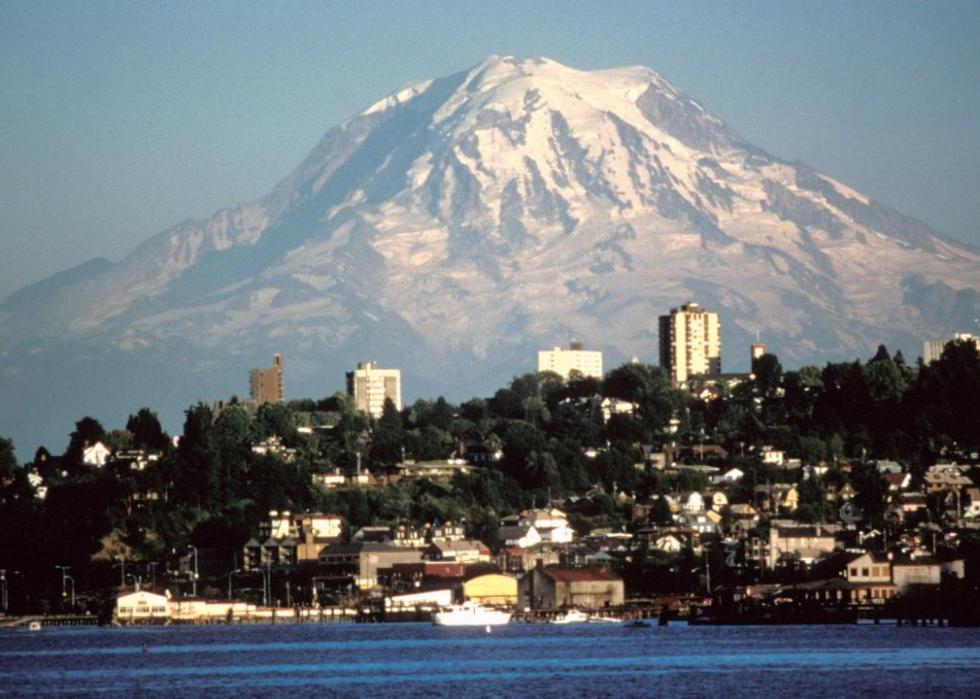
#11. Seattle-Tacoma-Bellevue, WA Metro Area
- Migration to Seattle in 2014-2018: 1,241
- Migration from Seattle to Las Vegas: 1,902 (#14 most common destination from Seattle)
- Net migration: 661 to Las Vegas
- Migration from Seattle to Las Vegas: 1,902 (#14 most common destination from Seattle)
- Net migration: 661 to Las Vegas
41 / 50
Skyguy414 // Wikicommons
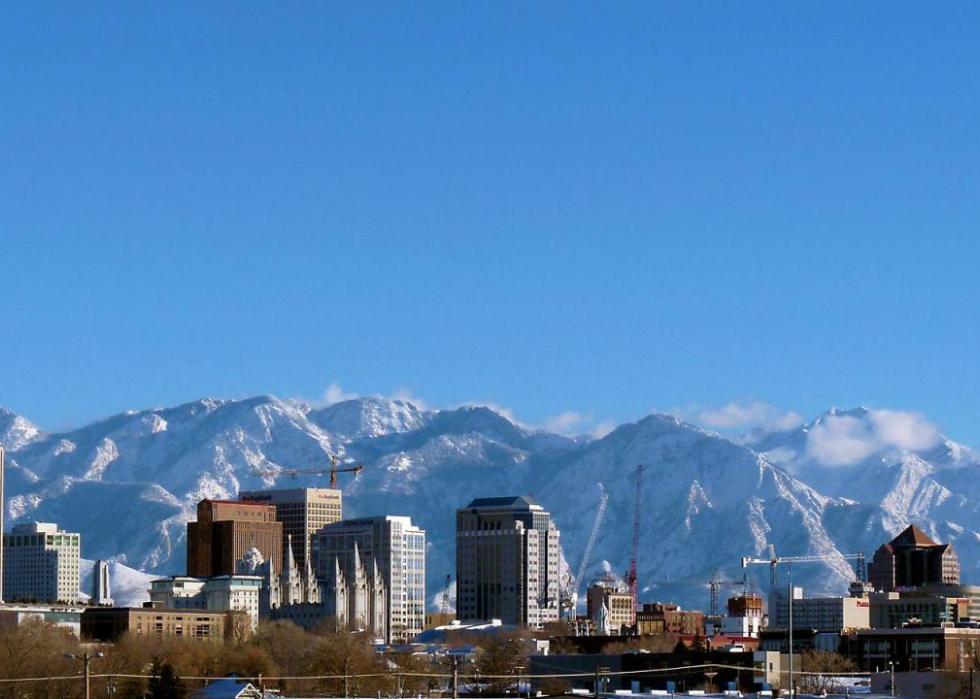
#10. Salt Lake City, UT Metro Area
- Migration to Salt Lake City in 2014-2018: 1,264
- Migration from Salt Lake City to Las Vegas: 1,121 (#8 most common destination from Salt Lake City)
- Net migration: 143 to Salt Lake City
- Migration from Salt Lake City to Las Vegas: 1,121 (#8 most common destination from Salt Lake City)
- Net migration: 143 to Salt Lake City
42 / 50
skeeze // Pixabay
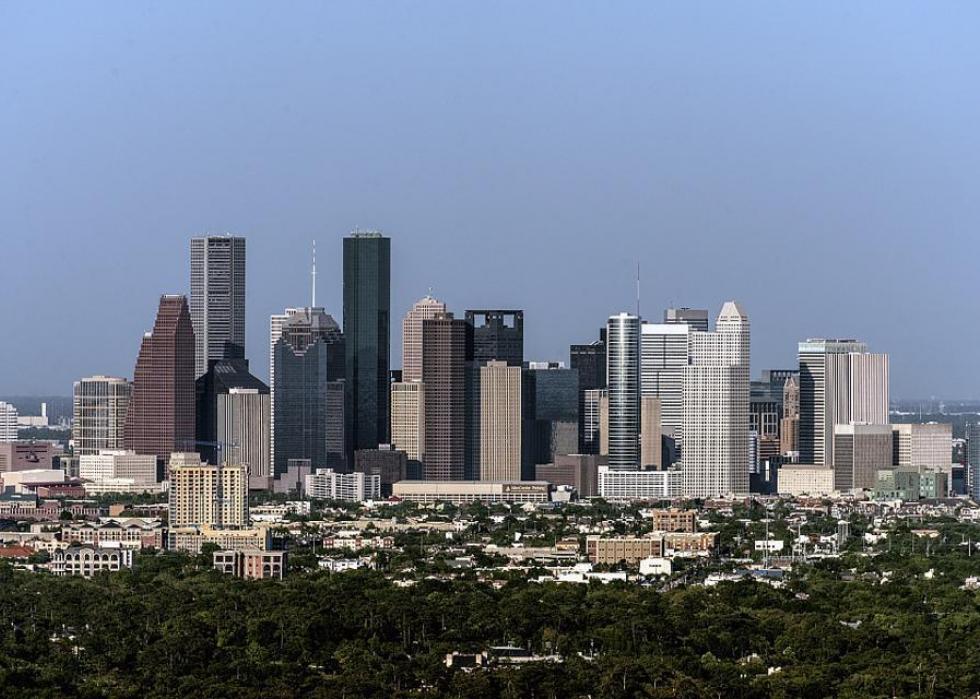
#9. Houston-The Woodlands-Sugar Land, TX Metro Area
- Migration to Houston in 2014-2018: 1,289
- Migration from Houston to Las Vegas: 777 (#42 most common destination from Houston)
- Net migration: 512 to Houston
- Migration from Houston to Las Vegas: 777 (#42 most common destination from Houston)
- Net migration: 512 to Houston

43 / 50
InSapphoWeTrust // Wikicommons
#8. Lake Havasu City-Kingman, AZ Metro Area
- Migration to Lake Havasu City in 2014-2018: 1,444
- Migration from Lake Havasu City to Las Vegas: 997 (#3 most common destination from Lake Havasu City)
- Net migration: 447 to Lake Havasu City
- Migration from Lake Havasu City to Las Vegas: 997 (#3 most common destination from Lake Havasu City)
- Net migration: 447 to Lake Havasu City

44 / 50
f11photo // Shutterstock
#7. Denver-Aurora-Lakewood, CO Metro Area
- Migration to Denver in 2014-2018: 1,519
- Migration from Denver to Las Vegas: 1,972 (#11 most common destination from Denver)
- Net migration: 453 to Las Vegas
- Migration from Denver to Las Vegas: 1,972 (#11 most common destination from Denver)
- Net migration: 453 to Las Vegas

45 / 50
Alan Botting // Wikimedia Commons
#6. Dallas-Fort Worth-Arlington, TX Metro Area
- Migration to Dallas in 2014-2018: 1,592
- Migration from Dallas to Las Vegas: 749 (#53 most common destination from Dallas)
- Net migration: 843 to Dallas
- Migration from Dallas to Las Vegas: 749 (#53 most common destination from Dallas)
- Net migration: 843 to Dallas

46 / 50
SD Dirk // Flickr
#5. San Diego-Carlsbad, CA Metro Area
- Migration to San Diego in 2014-2018: 1,783
- Migration from San Diego to Las Vegas: 2,852 (#8 most common destination from San Diego)
- Net migration: 1,069 to Las Vegas
- Migration from San Diego to Las Vegas: 2,852 (#8 most common destination from San Diego)
- Net migration: 1,069 to Las Vegas

47 / 50
DPPed// Wikimedia
#4. Phoenix-Mesa-Scottsdale, AZ Metro Area
- Migration to Phoenix in 2014-2018: 2,785
- Migration from Phoenix to Las Vegas: 2,742 (#11 most common destination from Phoenix)
- Net migration: 43 to Phoenix
- Migration from Phoenix to Las Vegas: 2,742 (#11 most common destination from Phoenix)
- Net migration: 43 to Phoenix
48 / 50
Daniel Orth // Flickr
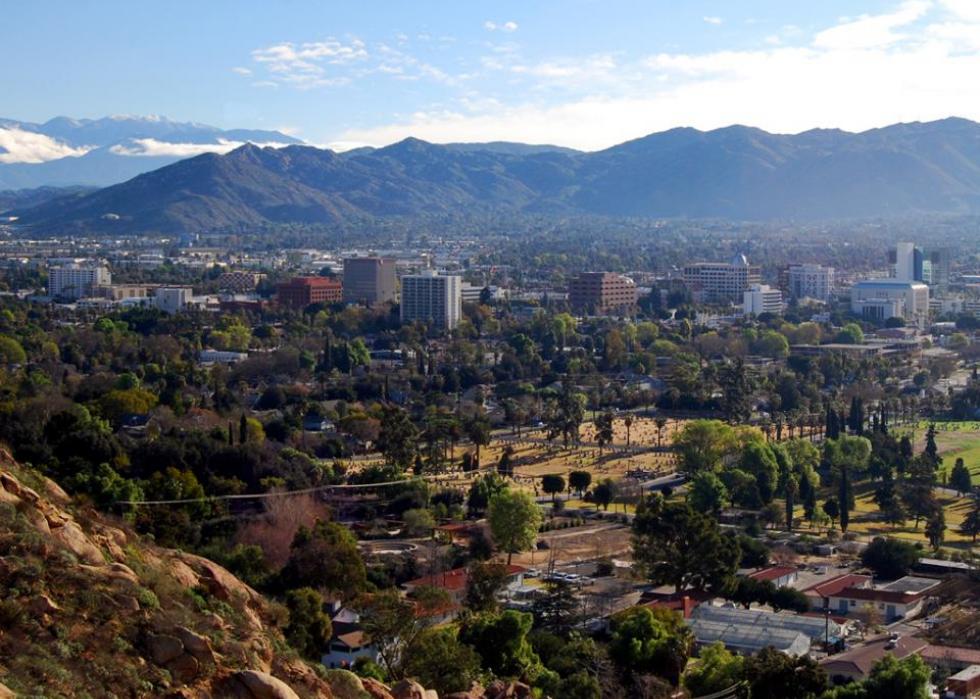
#3. Riverside-San Bernardino-Ontario, CA Metro Area
- Migration to Riverside in 2014-2018: 3,287
- Migration from Riverside to Las Vegas: 4,899 (#3 most common destination from Riverside)
- Net migration: 1,612 to Las Vegas
- Migration from Riverside to Las Vegas: 4,899 (#3 most common destination from Riverside)
- Net migration: 1,612 to Las Vegas

49 / 50
Lómelinde // Wikicommons
#2. Reno, NV Metro Area
- Migration to Reno in 2014-2018: 3,398
- Migration from Reno to Las Vegas: 1,696 (#1 most common destination from Reno)
- Net migration: 1,702 to Reno
- Migration from Reno to Las Vegas: 1,696 (#1 most common destination from Reno)
- Net migration: 1,702 to Reno
50 / 50
BDS2006 // Wikimedia
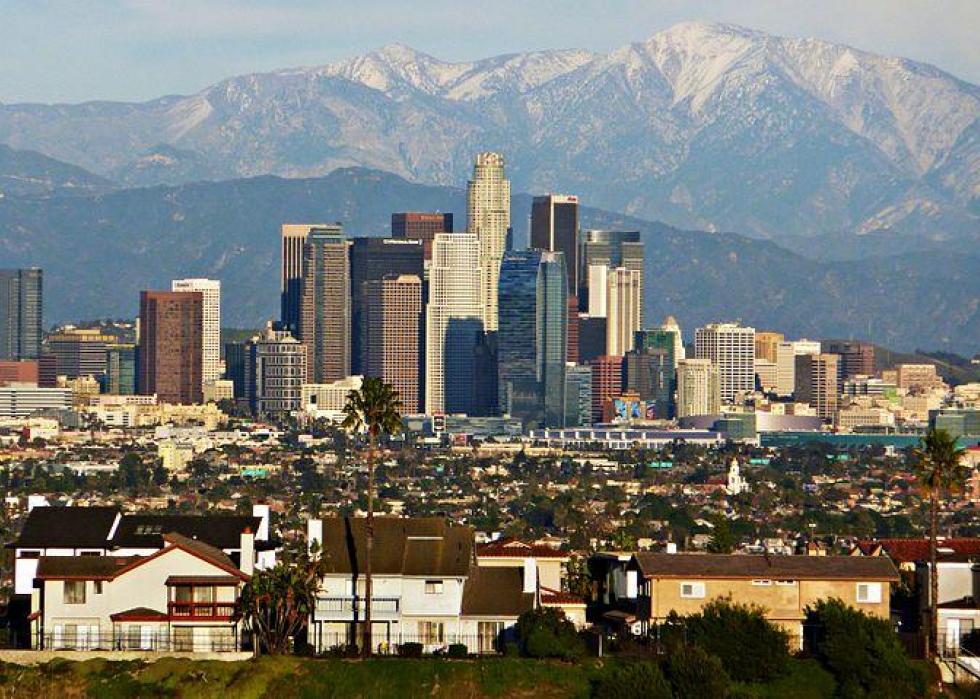
#1. Los Angeles-Long Beach-Anaheim, CA Metro Area
- Migration to Los Angeles in 2014-2018: 5,786
- Migration from Los Angeles to Las Vegas: 15,720 (#4 most common destination from Los Angeles)
- Net migration: 9,934 to Las Vegas
- Migration from Los Angeles to Las Vegas: 15,720 (#4 most common destination from Los Angeles)
- Net migration: 9,934 to Las Vegas


