
Where people in Miami are moving to most
Where people in Miami are moving to most
Stacker compiled a list of where people in Miami are moving to the most using data from the U.S. Census Bureau. Metros are ranked by the estimated number of people who moved to the metro from Miami between 2014 and 2018. Ties were broken by gross migration.

#50. Albany, GA Metro Area
- Migration to Albany in 2014-2018: 594
- Migration from Albany to Miami: 21 (#45 most common destination from Albany)
- Net migration: 573 to Albany

#49. Pittsburgh, PA Metro Area
- Migration to Pittsburgh in 2014-2018: 602
- Migration from Pittsburgh to Miami: 519 (#32 most common destination from Pittsburgh)
- Net migration: 83 to Pittsburgh

#48. Cincinnati, OH-KY-IN Metro Area
- Migration to Cincinnati in 2014-2018: 651
- Migration from Cincinnati to Miami: 579 (#17 most common destination from Cincinnati)
- Net migration: 72 to Cincinnati

#47. Providence-Warwick, RI-MA Metro Area
- Migration to Providence in 2014-2018: 659
- Migration from Providence to Miami: 880 (#8 most common destination from Providence)
- Net migration: 221 to Miami

#46. Portland-Vancouver-Hillsboro, OR-WA Metro Area
- Migration to Portland in 2014-2018: 675
- Migration from Portland to Miami: 542 (#30 most common destination from Portland)
- Net migration: 133 to Portland

#45. Greenville-Anderson-Mauldin, SC Metro Area
- Migration to Greenville in 2014-2018: 688
- Migration from Greenville to Miami: 218 (#25 most common destination from Greenville)
- Net migration: 470 to Greenville

#44. Memphis, TN-MS-AR Metro Area
- Migration to Memphis in 2014-2018: 703
- Migration from Memphis to Miami: 270 (#36 most common destination from Memphis)
- Net migration: 433 to Memphis

#43. Columbus, OH Metro Area
- Migration to Columbus in 2014-2018: 731
- Migration from Columbus to Miami: 450 (#30 most common destination from Columbus)
- Net migration: 281 to Columbus

#42. San Jose-Sunnyvale-Santa Clara, CA Metro Area
- Migration to San Jose in 2014-2018: 736
- Migration from San Jose to Miami: 439 (#36 most common destination from San Jose)
- Net migration: 297 to San Jose

#41. Seattle-Tacoma-Bellevue, WA Metro Area
- Migration to Seattle in 2014-2018: 750
- Migration from Seattle to Miami: 610 (#48 most common destination from Seattle)
- Net migration: 140 to Seattle

#40. Knoxville, TN Metro Area
- Migration to Knoxville in 2014-2018: 754
- Migration from Knoxville to Miami: 263 (#19 most common destination from Knoxville)
- Net migration: 491 to Knoxville

#39. Phoenix-Mesa-Scottsdale, AZ Metro Area
- Migration to Phoenix in 2014-2018: 759
- Migration from Phoenix to Miami: 962 (#31 most common destination from Phoenix)
- Net migration: 203 to Miami

#38. Pensacola-Ferry Pass-Brent, FL Metro Area
- Migration to Pensacola in 2014-2018: 804
- Migration from Pensacola to Miami: 555 (#13 most common destination from Pensacola)
- Net migration: 249 to Pensacola

#37. Bridgeport-Stamford-Norwalk, CT Metro Area
- Migration to Bridgeport in 2014-2018: 814
- Migration from Bridgeport to Miami: 1,181 (#5 most common destination from Bridgeport)
- Net migration: 367 to Miami

#36. Colorado Springs, CO Metro Area
- Migration to Colorado Springs in 2014-2018: 864
- Migration from Colorado Springs to Miami: 160 (#64 most common destination from Colorado Springs)
- Net migration: 704 to Colorado Springs

#35. Virginia Beach-Norfolk-Newport News, VA-NC Metro Area
- Migration to Virginia Beach in 2014-2018: 867
- Migration from Virginia Beach to Miami: 1,046 (#17 most common destination from Virginia Beach)
- Net migration: 179 to Miami

#34. Sebastian-Vero Beach, FL Metro Area
- Migration to Sebastian in 2014-2018: 890
- Migration from Sebastian to Miami: 677 (#3 most common destination from Sebastian)
- Net migration: 213 to Sebastian

#33. Baltimore-Columbia-Towson, MD Metro Area
- Migration to Baltimore in 2014-2018: 1,108
- Migration from Baltimore to Miami: 1,266 (#12 most common destination from Baltimore)
- Net migration: 158 to Miami

#32. Denver-Aurora-Lakewood, CO Metro Area
- Migration to Denver in 2014-2018: 1,109
- Migration from Denver to Miami: 739 (#30 most common destination from Denver)
- Net migration: 370 to Denver

#31. Austin-Round Rock, TX Metro Area
- Migration to Austin in 2014-2018: 1,129
- Migration from Austin to Miami: 695 (#22 most common destination from Austin)
- Net migration: 434 to Austin

#30. Las Vegas-Henderson-Paradise, NV Metro Area
- Migration to Las Vegas in 2014-2018: 1,132
- Migration from Las Vegas to Miami: 414 (#41 most common destination from Las Vegas)
- Net migration: 718 to Las Vegas

#29. Raleigh, NC Metro Area
- Migration to Raleigh in 2014-2018: 1,178
- Migration from Raleigh to Miami: 942 (#14 most common destination from Raleigh)
- Net migration: 236 to Raleigh

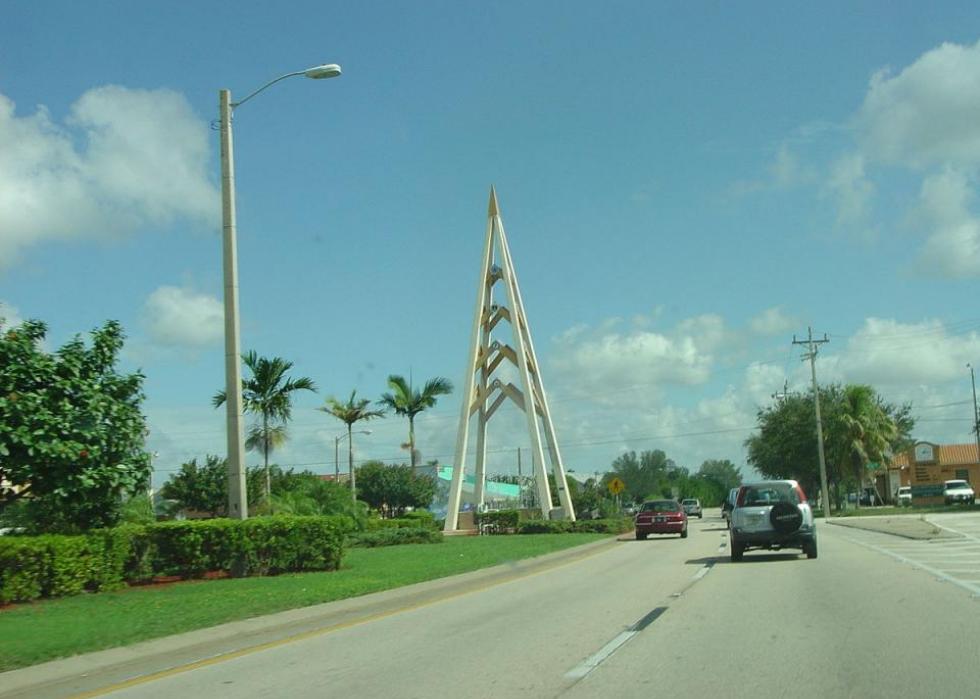
#28. Crestview-Fort Walton Beach-Destin, FL Metro Area
- Migration to Crestview in 2014-2018: 1,200
- Migration from Crestview to Miami: 180 (#21 most common destination from Crestview)
- Net migration: 1,020 to Crestview

#27. Detroit-Warren-Dearborn, MI Metro Area
- Migration to Detroit in 2014-2018: 1,201
- Migration from Detroit to Miami: 1,316 (#16 most common destination from Detroit)
- Net migration: 115 to Miami

#26. San Francisco-Oakland-Hayward, CA Metro Area
- Migration to San Francisco in 2014-2018: 1,302
- Migration from San Francisco to Miami: 1,028 (#33 most common destination from San Francisco)
- Net migration: 274 to San Francisco

#25. Ocala, FL Metro Area
- Migration to Ocala in 2014-2018: 1,417
- Migration from Ocala to Miami: 1,648 (#2 most common destination from Ocala)
- Net migration: 231 to Miami

#24. Punta Gorda, FL Metro Area
- Migration to Punta Gorda in 2014-2018: 1,479
- Migration from Punta Gorda to Miami: 395 (#5 most common destination from Punta Gorda)
- Net migration: 1,084 to Punta Gorda

#23. Nashville-Davidson--Murfreesboro--Franklin, TN Metro Area
- Migration to Nashville in 2014-2018: 1,686
- Migration from Nashville to Miami: 455 (#25 most common destination from Nashville)
- Net migration: 1,231 to Nashville

#22. Philadelphia-Camden-Wilmington, PA-NJ-DE-MD Metro Area
- Migration to Philadelphia in 2014-2018: 1,691
- Migration from Philadelphia to Miami: 3,269 (#11 most common destination from Philadelphia)
- Net migration: 1,578 to Miami

#21. Lakeland-Winter Haven, FL Metro Area
- Migration to Lakeland in 2014-2018: 1,841
- Migration from Lakeland to Miami: 1,390 (#3 most common destination from Lakeland)
- Net migration: 451 to Lakeland

#20. Deltona-Daytona Beach-Ormond Beach, FL Metro Area
- Migration to Deltona in 2014-2018: 1,908
- Migration from Deltona to Miami: 1,367 (#3 most common destination from Deltona)
- Net migration: 541 to Deltona
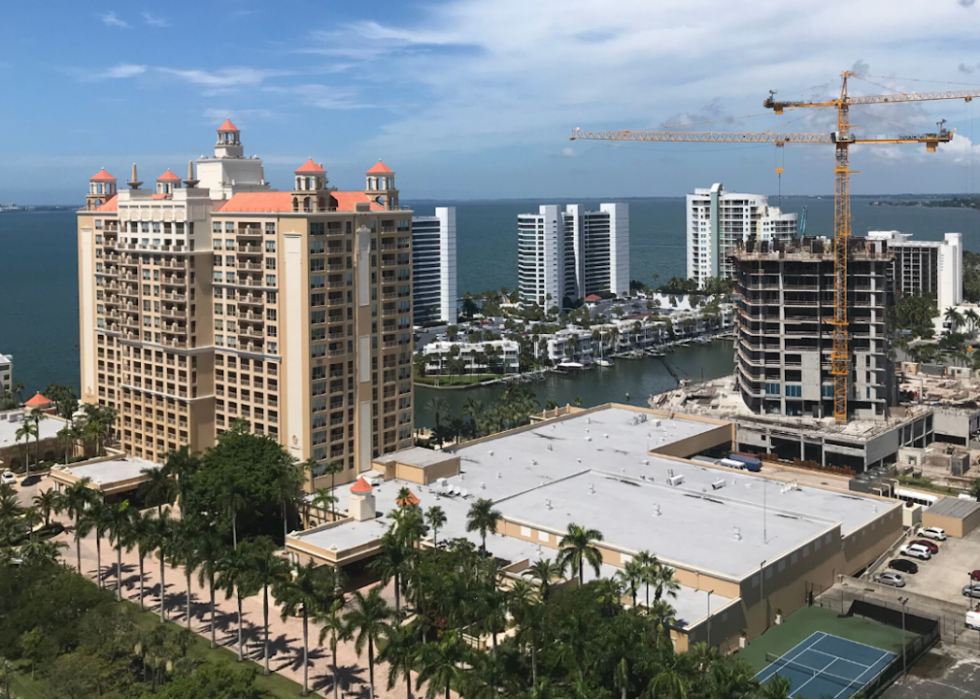
#19. North Port-Sarasota-Bradenton, FL Metro Area
- Migration to North Port in 2014-2018: 2,003
- Migration from North Port to Miami: 1,464 (#4 most common destination from North Port)
- Net migration: 539 to North Port

#18. Naples-Immokalee-Marco Island, FL Metro Area
- Migration to Naples in 2014-2018: 2,247
- Migration from Naples to Miami: 1,365 (#2 most common destination from Naples)
- Net migration: 882 to Naples

#17. Charlotte-Concord-Gastonia, NC-SC Metro Area
- Migration to Charlotte in 2014-2018: 2,369
- Migration from Charlotte to Miami: 878 (#18 most common destination from Charlotte)
- Net migration: 1,491 to Charlotte

#16. Chicago-Naperville-Elgin, IL-IN-WI Metro Area
- Migration to Chicago in 2014-2018: 2,534
- Migration from Chicago to Miami: 3,480 (#20 most common destination from Chicago)
- Net migration: 946 to Miami
#15. Palm Bay-Melbourne-Titusville, FL Metro Area
- Migration to Palm Bay in 2014-2018: 2,561
- Migration from Palm Bay to Miami: 1,575 (#2 most common destination from Palm Bay)
- Net migration: 986 to Palm Bay

#14. Los Angeles-Long Beach-Anaheim, CA Metro Area
- Migration to Los Angeles in 2014-2018: 2,674
- Migration from Los Angeles to Miami: 2,617 (#24 most common destination from Los Angeles)
- Net migration: 57 to Los Angeles

#13. Boston-Cambridge-Newton, MA-NH Metro Area
- Migration to Boston in 2014-2018: 2,745
- Migration from Boston to Miami: 4,623 (#7 most common destination from Boston)
- Net migration: 1,878 to Miami

#12. Dallas-Fort Worth-Arlington, TX Metro Area
- Migration to Dallas in 2014-2018: 2,995
- Migration from Dallas to Miami: 1,765 (#25 most common destination from Dallas)
- Net migration: 1,230 to Dallas

#11. Houston-The Woodlands-Sugar Land, TX Metro Area
- Migration to Houston in 2014-2018: 3,425
- Migration from Houston to Miami: 1,409 (#21 most common destination from Houston)
- Net migration: 2,016 to Houston

#10. Washington-Arlington-Alexandria, DC-VA-MD-WV Metro Area
- Migration to Washington in 2014-2018: 3,589
- Migration from Washington to Miami: 3,730 (#12 most common destination from Washington)
- Net migration: 141 to Miami
#9. Cape Coral-Fort Myers, FL Metro Area
- Migration to Cape Coral in 2014-2018: 4,182
- Migration from Cape Coral to Miami: 2,533 (#1 most common destination from Cape Coral)
- Net migration: 1,649 to Cape Coral

#8. Tallahassee, FL Metro Area
- Migration to Tallahassee in 2014-2018: 4,419
- Migration from Tallahassee to Miami: 2,096 (#1 most common destination from Tallahassee)
- Net migration: 2,323 to Tallahassee

#7. Gainesville, FL Metro Area
- Migration to Gainesville in 2014-2018: 4,435
- Migration from Gainesville to Miami: 2,075 (#2 most common destination from Gainesville)
- Net migration: 2,360 to Gainesville

#6. Jacksonville, FL Metro Area
- Migration to Jacksonville in 2014-2018: 5,658
- Migration from Jacksonville to Miami: 3,201 (#1 most common destination from Jacksonville)
- Net migration: 2,457 to Jacksonville

#5. Atlanta-Sandy Springs-Roswell, GA Metro Area
- Migration to Atlanta in 2014-2018: 7,873
- Migration from Atlanta to Miami: 3,874 (#6 most common destination from Atlanta)
- Net migration: 3,999 to Atlanta

#4. New York-Newark-Jersey City, NY-NJ-PA Metro Area
- Migration to New York in 2014-2018: 9,282
- Migration from New York to Miami: 23,228 (#2 most common destination from New York)
- Net migration: 13,946 to Miami

#3. Tampa-St. Petersburg-Clearwater, FL Metro Area
- Migration to Tampa in 2014-2018: 10,097
- Migration from Tampa to Miami: 4,610 (#3 most common destination from Tampa)
- Net migration: 5,487 to Tampa

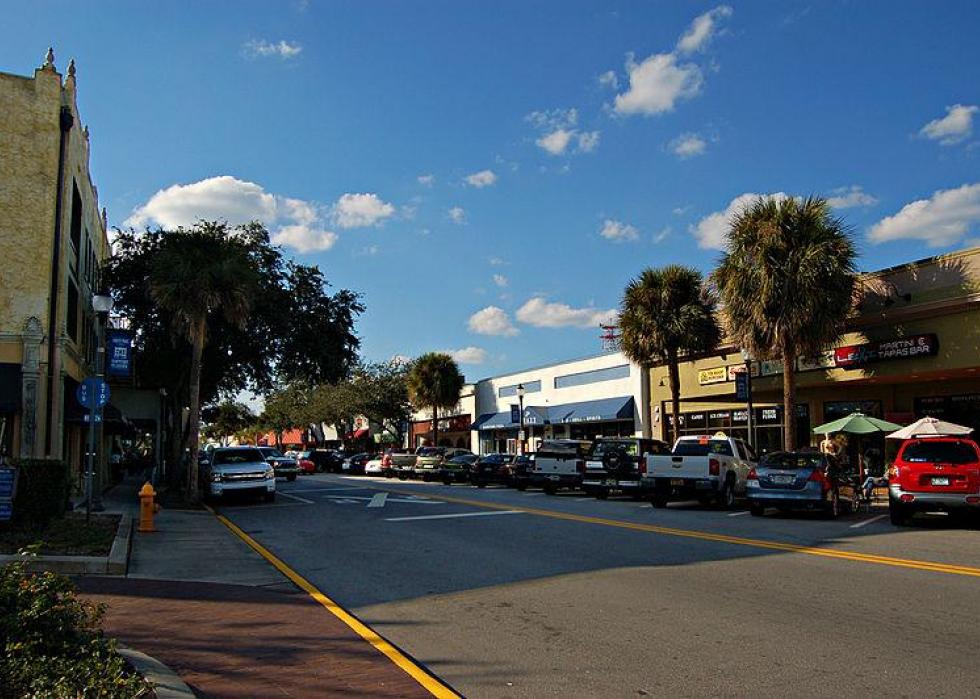
#2. Port St. Lucie, FL Metro Area
- Migration to Port St. Lucie in 2014-2018: 10,868
- Migration from Port St. Lucie to Miami: 4,780 (#1 most common destination from Port St. Lucie)
- Net migration: 6,088 to Port St. Lucie

#1. Orlando-Kissimmee-Sanford, FL Metro Area
- Migration to Orlando in 2014-2018: 17,339
- Migration from Orlando to Miami: 8,877 (#1 most common destination from Orlando)
- Net migration: 8,462 to Orlando


