
Where people in New York City are moving to most
Where people in New York City are moving to most
Stacker compiled a list of where people in New York-Newark-Jersey City Metro Area are moving to the most using data from the U.S. Census Bureau. Metros are ranked by the estimated number of people who moved to the metro from New York between 2014 and 2018. Ties were broken by gross migration.

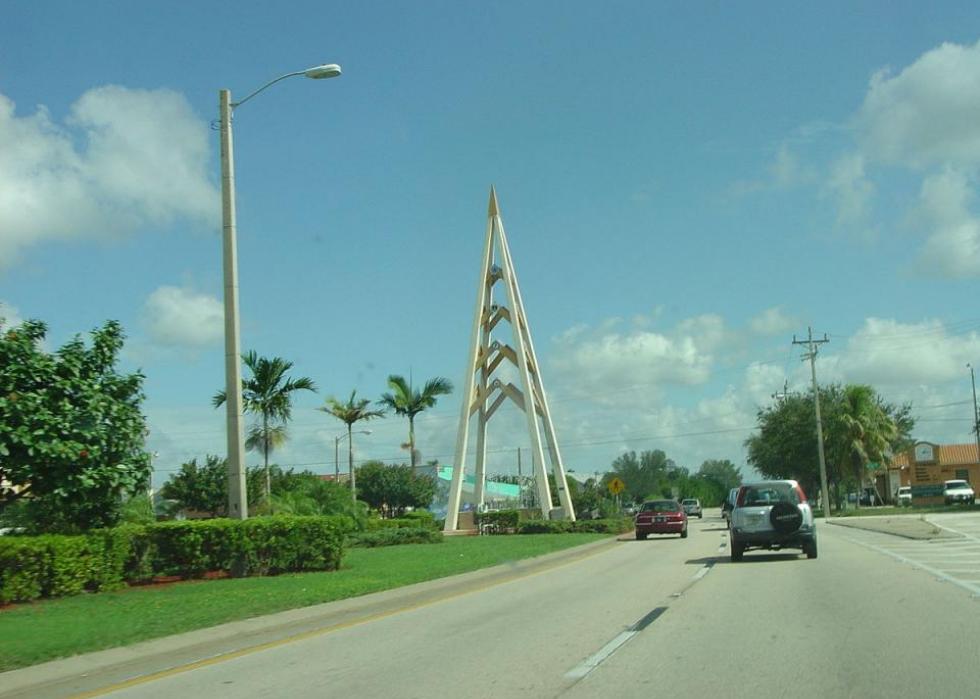
#50. Atlantic City-Hammonton, NJ Metro Area
- Migration to Atlantic City in 2014-2018: 2,247
- Migration from Atlantic City to New York: 3,042 (#1 most common destination from Atlantic City)
- Net migration: 795 to New York

#49. Portland-Vancouver-Hillsboro, OR-WA Metro Area
- Migration to Portland in 2014-2018: 2,277
- Migration from Portland to New York: 1,134 (#15 most common destination from Portland)
- Net migration: 1,143 to Portland

#48. Detroit-Warren-Dearborn, MI Metro Area
- Migration to Detroit in 2014-2018: 2,360
- Migration from Detroit to New York: 1,444 (#12 most common destination from Detroit)
- Net migration: 916 to Detroit
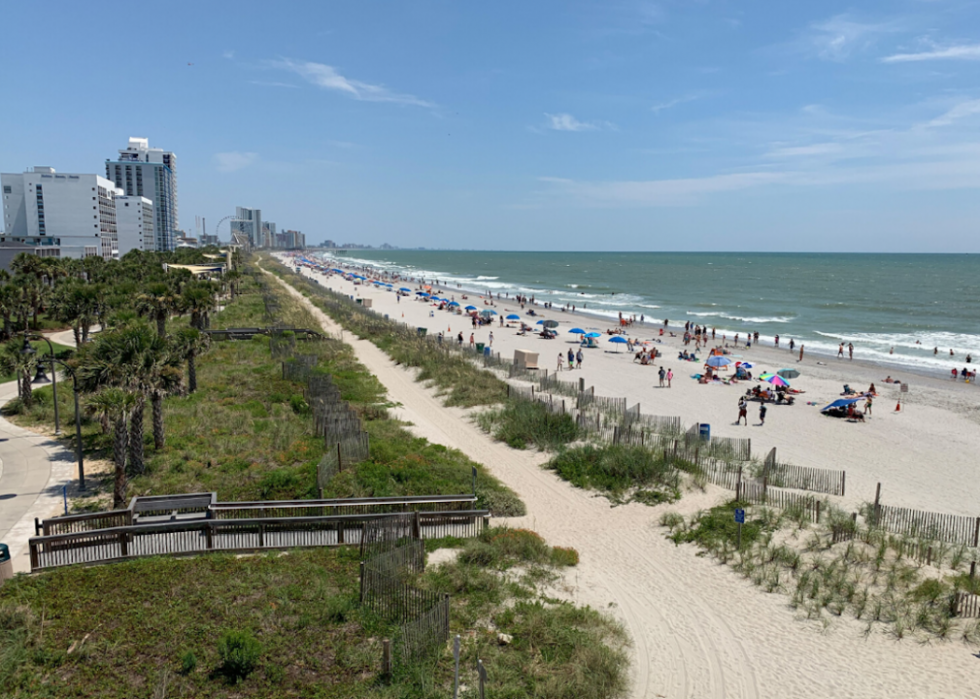
#47. Myrtle Beach-Conway-North Myrtle Beach, SC-NC Metro Area
- Migration to Myrtle Beach in 2014-2018: 2,386
- Migration from Myrtle Beach to New York: 278 (#10 most common destination from Myrtle Beach)
- Net migration: 2,108 to Myrtle Beach
#46. Cape Coral-Fort Myers, FL Metro Area
- Migration to Cape Coral in 2014-2018: 2,387
- Migration from Cape Coral to New York: 594 (#9 most common destination from Cape Coral)
- Net migration: 1,793 to Cape Coral

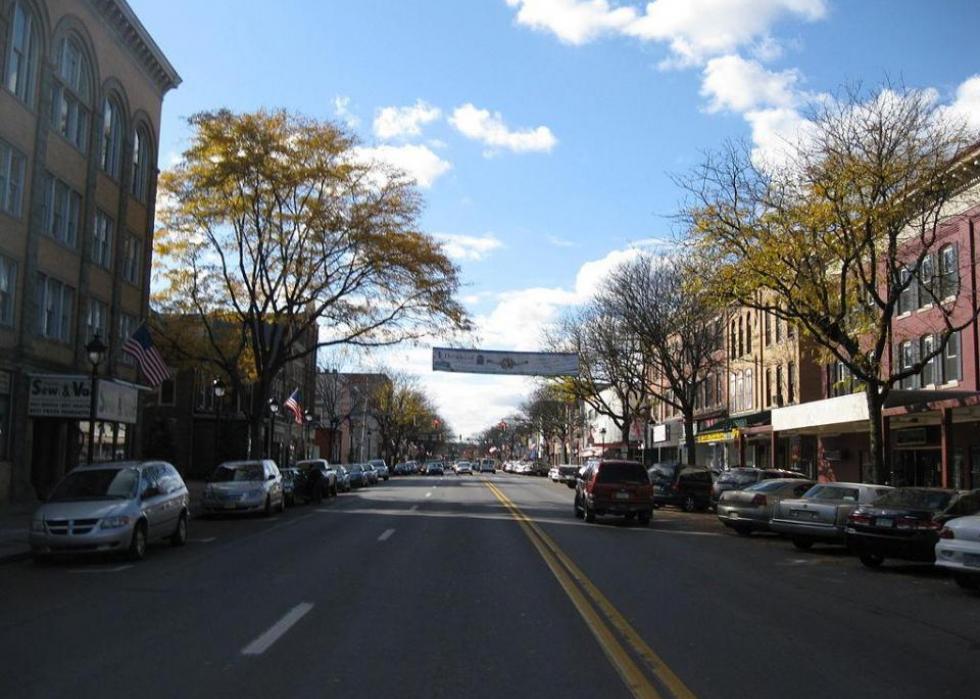
#45. Utica-Rome, NY Metro Area
- Migration to Utica in 2014-2018: 2,471
- Migration from Utica to New York: 900 (#2 most common destination from Utica)
- Net migration: 1,571 to Utica
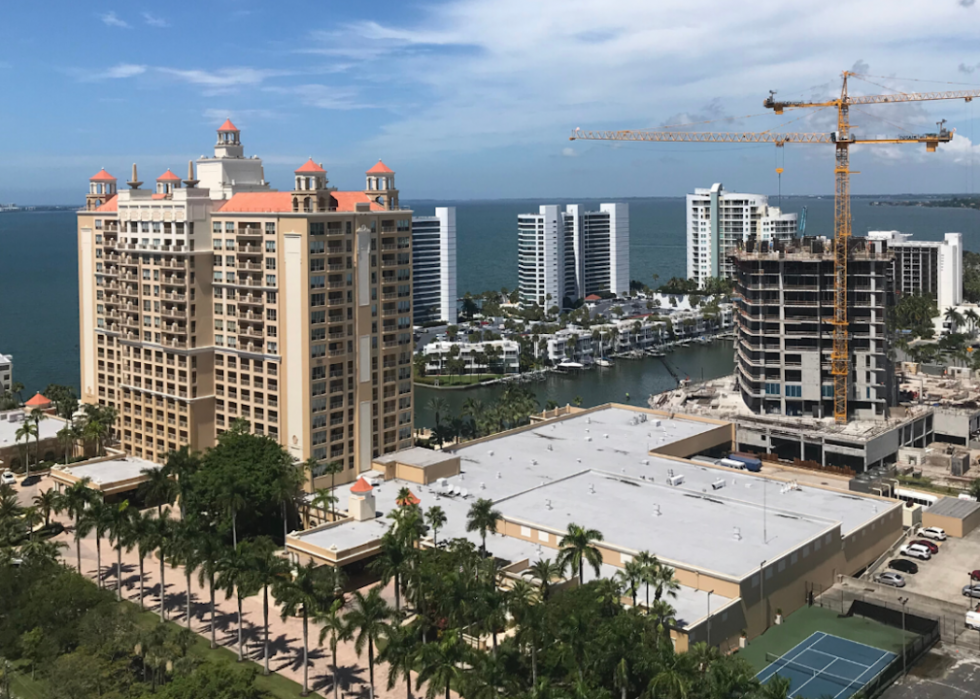
#44. North Port-Sarasota-Bradenton, FL Metro Area
- Migration to North Port in 2014-2018: 2,603
- Migration from North Port to New York: 511 (#15 most common destination from North Port)
- Net migration: 2,092 to North Port

#43. Las Vegas-Henderson-Paradise, NV Metro Area
- Migration to Las Vegas in 2014-2018: 2,639
- Migration from Las Vegas to New York: 630 (#27 most common destination from Las Vegas)
- Net migration: 2,009 to Las Vegas

#42. Columbus, OH Metro Area
- Migration to Columbus in 2014-2018: 2,654
- Migration from Columbus to New York: 1,275 (#7 most common destination from Columbus)
- Net migration: 1,379 to Columbus

#41. Jacksonville, FL Metro Area
- Migration to Jacksonville in 2014-2018: 2,658
- Migration from Jacksonville to New York: 756 (#16 most common destination from Jacksonville)
- Net migration: 1,902 to Jacksonville

#40. Durham-Chapel Hill, NC Metro Area
- Migration to Durham in 2014-2018: 2,740
- Migration from Durham to New York: 1,181 (#6 most common destination from Durham)
- Net migration: 1,559 to Durham

#39. Ithaca, NY Metro Area
- Migration to Ithaca in 2014-2018: 3,062
- Migration from Ithaca to New York: 1,515 (#1 most common destination from Ithaca)
- Net migration: 1,547 to Ithaca

#38. Richmond, VA Metro Area
- Migration to Richmond in 2014-2018: 3,118
- Migration from Richmond to New York: 975 (#6 most common destination from Richmond)
- Net migration: 2,143 to Richmond

#37. Pittsburgh, PA Metro Area
- Migration to Pittsburgh in 2014-2018: 3,249
- Migration from Pittsburgh to New York: 1,891 (#5 most common destination from Pittsburgh)
- Net migration: 1,358 to Pittsburgh

#36. San Jose-Sunnyvale-Santa Clara, CA Metro Area
- Migration to San Jose in 2014-2018: 3,442
- Migration from San Jose to New York: 1,834 (#10 most common destination from San Jose)
- Net migration: 1,608 to San Jose
#35. East Stroudsburg, PA Metro Area
- Migration to East Stroudsburg in 2014-2018: 3,571
- Migration from East Stroudsburg to New York: 1,768 (#1 most common destination from East Stroudsburg)
- Net migration: 1,803 to East Stroudsburg

#34. Providence-Warwick, RI-MA Metro Area
- Migration to Providence in 2014-2018: 3,670
- Migration from Providence to New York: 1,746 (#3 most common destination from Providence)
- Net migration: 1,924 to Providence

#33. Denver-Aurora-Lakewood, CO Metro Area
- Migration to Denver in 2014-2018: 3,721
- Migration from Denver to New York: 1,245 (#16 most common destination from Denver)
- Net migration: 2,476 to Denver

#32. San Diego-Carlsbad, CA Metro Area
- Migration to San Diego in 2014-2018: 3,740
- Migration from San Diego to New York: 2,435 (#11 most common destination from San Diego)
- Net migration: 1,305 to San Diego

#31. Austin-Round Rock, TX Metro Area
- Migration to Austin in 2014-2018: 3,870
- Migration from Austin to New York: 1,408 (#11 most common destination from Austin)
- Net migration: 2,462 to Austin

#30. Virginia Beach-Norfolk-Newport News, VA-NC Metro Area
- Migration to Virginia Beach in 2014-2018: 4,059
- Migration from Virginia Beach to New York: 1,773 (#5 most common destination from Virginia Beach)
- Net migration: 2,286 to Virginia Beach

#29. Raleigh, NC Metro Area
- Migration to Raleigh in 2014-2018: 4,121
- Migration from Raleigh to New York: 1,579 (#6 most common destination from Raleigh)
- Net migration: 2,542 to Raleigh

#28. Hartford-West Hartford-East Hartford, CT Metro Area
- Migration to Hartford in 2014-2018: 4,135
- Migration from Hartford to New York: 2,284 (#4 most common destination from Hartford)
- Net migration: 1,851 to Hartford

#27. Phoenix-Mesa-Scottsdale, AZ Metro Area
- Migration to Phoenix in 2014-2018: 4,391
- Migration from Phoenix to New York: 2,690 (#12 most common destination from Phoenix)
- Net migration: 1,701 to Phoenix

#26. New Haven-Milford, CT Metro Area
- Migration to New Haven in 2014-2018: 4,440
- Migration from New Haven to New York: 3,246 (#3 most common destination from New Haven)
- Net migration: 1,194 to New Haven

#25. Binghamton, NY Metro Area
- Migration to Binghamton in 2014-2018: 4,475
- Migration from Binghamton to New York: 928 (#1 most common destination from Binghamton)
- Net migration: 3,547 to Binghamton
#24. Kingston, NY Metro Area
- Migration to Kingston in 2014-2018: 4,613
- Migration from Kingston to New York: 2,905 (#1 most common destination from Kingston)
- Net migration: 1,708 to Kingston

#23. Scranton--Wilkes-Barre--Hazleton, PA Metro Area
- Migration to Scranton in 2014-2018: 4,990
- Migration from Scranton to New York: 821 (#3 most common destination from Scranton)
- Net migration: 4,169 to Scranton
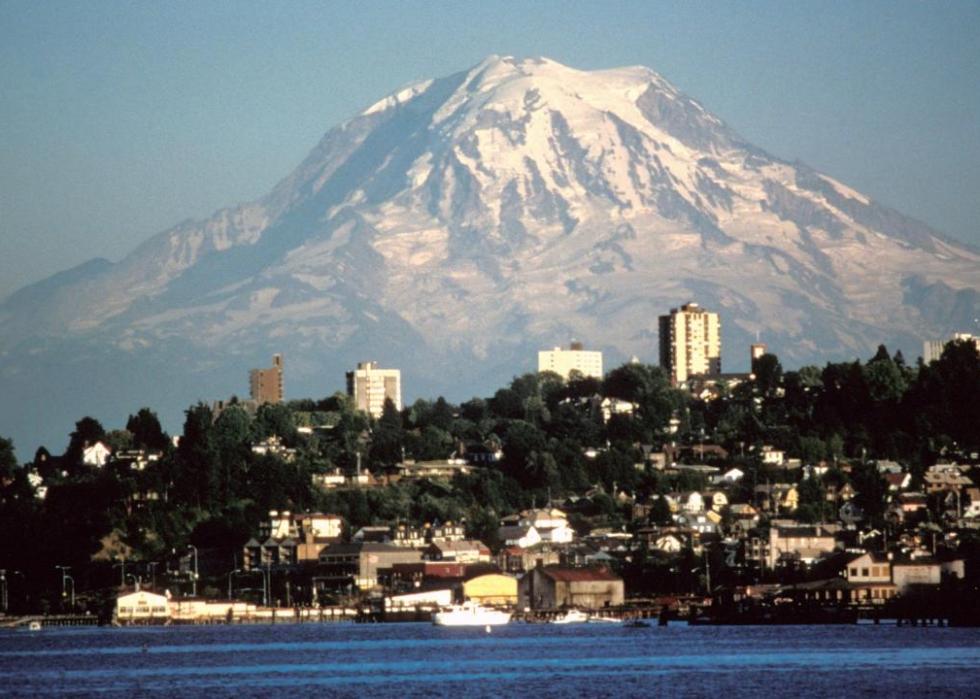
#22. Seattle-Tacoma-Bellevue, WA Metro Area
- Migration to Seattle in 2014-2018: 5,112
- Migration from Seattle to New York: 2,953 (#9 most common destination from Seattle)
- Net migration: 2,159 to Seattle

#21. Syracuse, NY Metro Area
- Migration to Syracuse in 2014-2018: 5,641
- Migration from Syracuse to New York: 3,376 (#1 most common destination from Syracuse)
- Net migration: 2,265 to Syracuse

#20. Rochester, NY Metro Area
- Migration to Rochester in 2014-2018: 6,180
- Migration from Rochester to New York: 6,304 (#1 most common destination from Rochester)
- Net migration: 124 to New York

#19. Houston-The Woodlands-Sugar Land, TX Metro Area
- Migration to Houston in 2014-2018: 6,251
- Migration from Houston to New York: 2,544 (#9 most common destination from Houston)
- Net migration: 3,707 to Houston

#18. Baltimore-Columbia-Towson, MD Metro Area
- Migration to Baltimore in 2014-2018: 6,717
- Migration from Baltimore to New York: 3,824 (#4 most common destination from Baltimore)
- Net migration: 2,893 to Baltimore

#17. Buffalo-Cheektowaga-Niagara Falls, NY Metro Area
- Migration to Buffalo in 2014-2018: 6,772
- Migration from Buffalo to New York: 2,980 (#2 most common destination from Buffalo)
- Net migration: 3,792 to Buffalo

#16. Dallas-Fort Worth-Arlington, TX Metro Area
- Migration to Dallas in 2014-2018: 6,868
- Migration from Dallas to New York: 3,471 (#10 most common destination from Dallas)
- Net migration: 3,397 to Dallas

#15. Chicago-Naperville-Elgin, IL-IN-WI Metro Area
- Migration to Chicago in 2014-2018: 7,432
- Migration from Chicago to New York: 5,751 (#9 most common destination from Chicago)
- Net migration: 1,681 to Chicago

#14. Charlotte-Concord-Gastonia, NC-SC Metro Area
- Migration to Charlotte in 2014-2018: 8,674
- Migration from Charlotte to New York: 2,141 (#8 most common destination from Charlotte)
- Net migration: 6,533 to Charlotte

#13. San Francisco-Oakland-Hayward, CA Metro Area
- Migration to San Francisco in 2014-2018: 9,761
- Migration from San Francisco to New York: 5,942 (#7 most common destination from San Francisco)
- Net migration: 3,819 to San Francisco

#12. Albany-Schenectady-Troy, NY Metro Area
- Migration to Albany in 2014-2018: 10,012
- Migration from Albany to New York: 5,389 (#1 most common destination from Albany)
- Net migration: 4,623 to Albany

#11. Orlando-Kissimmee-Sanford, FL Metro Area
- Migration to Orlando in 2014-2018: 10,378
- Migration from Orlando to New York: 3,210 (#6 most common destination from Orlando)
- Net migration: 7,168 to Orlando

#10. Tampa-St. Petersburg-Clearwater, FL Metro Area
- Migration to Tampa in 2014-2018: 10,524
- Migration from Tampa to New York: 3,624 (#5 most common destination from Tampa)
- Net migration: 6,900 to Tampa

#9. Allentown-Bethlehem-Easton, PA-NJ Metro Area
- Migration to Allentown in 2014-2018: 10,703
- Migration from Allentown to New York: 3,761 (#2 most common destination from Allentown)
- Net migration: 6,942 to Allentown

#8. Trenton, NJ Metro Area
- Migration to Trenton in 2014-2018: 12,288
- Migration from Trenton to New York: 7,387 (#1 most common destination from Trenton)
- Net migration: 4,901 to Trenton

#7. Atlanta-Sandy Springs-Roswell, GA Metro Area
- Migration to Atlanta in 2014-2018: 12,320
- Migration from Atlanta to New York: 4,725 (#2 most common destination from Atlanta)
- Net migration: 7,595 to Atlanta

#6. Bridgeport-Stamford-Norwalk, CT Metro Area
- Migration to Bridgeport in 2014-2018: 14,095
- Migration from Bridgeport to New York: 7,402 (#1 most common destination from Bridgeport)
- Net migration: 6,693 to Bridgeport

#5. Los Angeles-Long Beach-Anaheim, CA Metro Area
- Migration to Los Angeles in 2014-2018: 15,542
- Migration from Los Angeles to New York: 8,887 (#10 most common destination from Los Angeles)
- Net migration: 6,655 to Los Angeles

#4. Washington-Arlington-Alexandria, DC-VA-MD-WV Metro Area
- Migration to Washington in 2014-2018: 16,086
- Migration from Washington to New York: 10,600 (#4 most common destination from Washington)
- Net migration: 5,486 to Washington

#3. Boston-Cambridge-Newton, MA-NH Metro Area
- Migration to Boston in 2014-2018: 16,264
- Migration from Boston to New York: 9,565 (#4 most common destination from Boston)
- Net migration: 6,699 to Boston

#2. Miami-Fort Lauderdale-West Palm Beach, FL Metro Area
- Migration to Miami in 2014-2018: 23,228
- Migration from Miami to New York: 9,282 (#4 most common destination from Miami)
- Net migration: 13,946 to Miami

#1. Philadelphia-Camden-Wilmington, PA-NJ-DE-MD Metro Area
- Migration to Philadelphia in 2014-2018: 31,621
- Migration from Philadelphia to New York: 18,328 (#1 most common destination from Philadelphia)
- Net migration: 13,293 to Philadelphia


