
Where people in San Antonio are moving to most
Where people in San Antonio are moving to most
Stacker compiled a list of where people in San Antonio are moving to the most using data from the U.S. Census Bureau. Metros are ranked by the estimated number of people who moved to the metro from San Antonio between 2014 and 2018. Ties were broken by gross migration.

#50. Dayton, OH Metro Area
- Migration to Dayton in 2014-2018: 327
- Migration from Dayton to San Antonio: 274 (#18 most common destination from Dayton)
- Net migration: 53 to Dayton

#49. Vallejo-Fairfield, CA Metro Area
- Migration to Vallejo in 2014-2018: 327
- Migration from Vallejo to San Antonio: 284 (#10 most common destination from Vallejo)
- Net migration: 43 to Vallejo

#48. Texarkana, TX-AR Metro Area
- Migration to Texarkana in 2014-2018: 328
- Migration from Texarkana to San Antonio: 174 (#6 most common destination from Texarkana)
- Net migration: 154 to Texarkana

#47. Anchorage, AK Metro Area
- Migration to Anchorage in 2014-2018: 335
- Migration from Anchorage to San Antonio: 344 (#20 most common destination from Anchorage)
- Net migration: 9 to San Antonio

#46. Boston-Cambridge-Newton, MA-NH Metro Area
- Migration to Boston in 2014-2018: 341
- Migration from Boston to San Antonio: 415 (#60 most common destination from Boston)
- Net migration: 74 to San Antonio

#45. Las Vegas-Henderson-Paradise, NV Metro Area
- Migration to Las Vegas in 2014-2018: 349
- Migration from Las Vegas to San Antonio: 949 (#16 most common destination from Las Vegas)
- Net migration: 600 to San Antonio

#44. San Francisco-Oakland-Hayward, CA Metro Area
- Migration to San Francisco in 2014-2018: 380
- Migration from San Francisco to San Antonio: 427 (#55 most common destination from San Francisco)
- Net migration: 47 to San Antonio

#43. Baltimore-Columbia-Towson, MD Metro Area
- Migration to Baltimore in 2014-2018: 383
- Migration from Baltimore to San Antonio: 643 (#31 most common destination from Baltimore)
- Net migration: 260 to San Antonio

#42. Crestview-Fort Walton Beach-Destin, FL Metro Area
- Migration to Crestview in 2014-2018: 388
- Migration from Crestview to San Antonio: 462 (#9 most common destination from Crestview)
- Net migration: 74 to San Antonio

#41. New Orleans-Metairie, LA Metro Area
- Migration to New Orleans in 2014-2018: 394
- Migration from New Orleans to San Antonio: 358 (#23 most common destination from New Orleans)
- Net migration: 36 to New Orleans

#40. Amarillo, TX Metro Area
- Migration to Amarillo in 2014-2018: 397
- Migration from Amarillo to San Antonio: 228 (#8 most common destination from Amarillo)
- Net migration: 169 to Amarillo

#39. Orlando-Kissimmee-Sanford, FL Metro Area
- Migration to Orlando in 2014-2018: 416
- Migration from Orlando to San Antonio: 278 (#61 most common destination from Orlando)
- Net migration: 138 to Orlando

#38. Portland-Vancouver-Hillsboro, OR-WA Metro Area
- Migration to Portland in 2014-2018: 431
- Migration from Portland to San Antonio: 241 (#59 most common destination from Portland)
- Net migration: 190 to Portland

#37. Watertown-Fort Drum, NY Metro Area
- Migration to Watertown in 2014-2018: 431
- Migration from Watertown to San Antonio: 363 (#10 most common destination from Watertown)
- Net migration: 68 to Watertown

#36. Cincinnati, OH-KY-IN Metro Area
- Migration to Cincinnati in 2014-2018: 441
- Migration from Cincinnati to San Antonio: 113 (#95 most common destination from Cincinnati)
- Net migration: 328 to Cincinnati

#35. Tucson, AZ Metro Area
- Migration to Tucson in 2014-2018: 443
- Migration from Tucson to San Antonio: 304 (#27 most common destination from Tucson)
- Net migration: 139 to Tucson

#34. Kansas City, MO-KS Metro Area
- Migration to Kansas City in 2014-2018: 451
- Migration from Kansas City to San Antonio: 232 (#60 most common destination from Kansas City)
- Net migration: 219 to Kansas City

#33. Fayetteville, NC Metro Area
- Migration to Fayetteville in 2014-2018: 473
- Migration from Fayetteville to San Antonio: 1,041 (#4 most common destination from Fayetteville)
- Net migration: 568 to San Antonio

#32. Cleveland-Elyria, OH Metro Area
- Migration to Cleveland in 2014-2018: 477
- Migration from Cleveland to San Antonio: 55 (#125 most common destination from Cleveland)
- Net migration: 422 to Cleveland

#31. Denver-Aurora-Lakewood, CO Metro Area
- Migration to Denver in 2014-2018: 487
- Migration from Denver to San Antonio: 901 (#25 most common destination from Denver)
- Net migration: 414 to San Antonio

#30. Longview, TX Metro Area
- Migration to Longview in 2014-2018: 498
- Migration from Longview to San Antonio: 377 (#5 most common destination from Longview)
- Net migration: 121 to Longview

#29. San Diego-Carlsbad, CA Metro Area
- Migration to San Diego in 2014-2018: 516
- Migration from San Diego to San Antonio: 1,114 (#25 most common destination from San Diego)
- Net migration: 598 to San Antonio

#28. Albuquerque, NM Metro Area
- Migration to Albuquerque in 2014-2018: 529
- Migration from Albuquerque to San Antonio: 192 (#41 most common destination from Albuquerque)
- Net migration: 337 to Albuquerque

#27. Abilene, TX Metro Area
- Migration to Abilene in 2014-2018: 540
- Migration from Abilene to San Antonio: 278 (#6 most common destination from Abilene)
- Net migration: 262 to Abilene

#26. Midland, TX Metro Area
- Migration to Midland in 2014-2018: 564
- Migration from Midland to San Antonio: 851 (#4 most common destination from Midland)
- Net migration: 287 to San Antonio
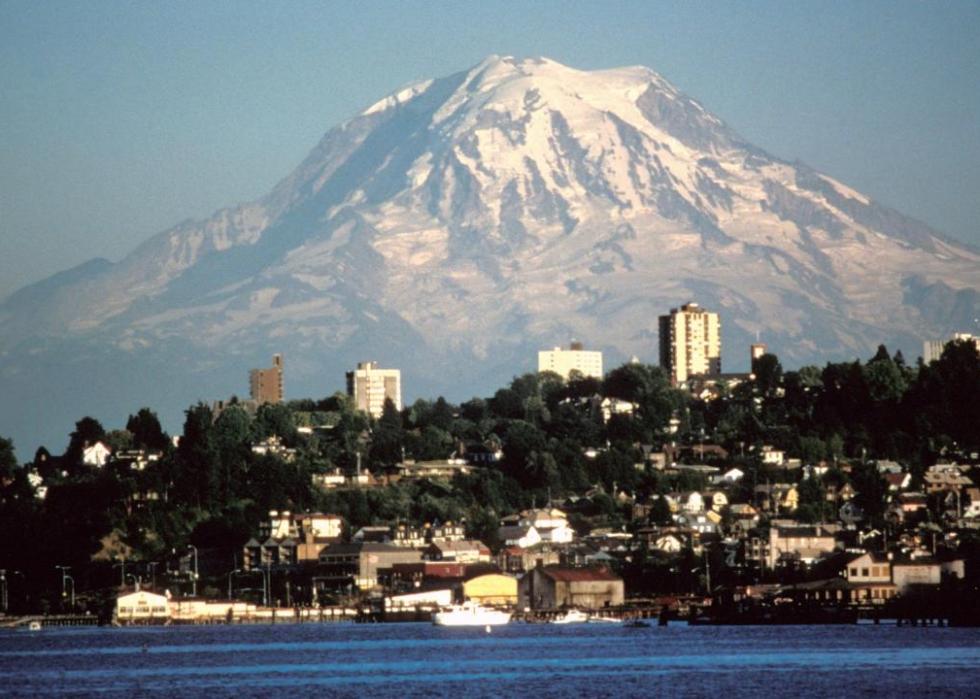
#25. Seattle-Tacoma-Bellevue, WA Metro Area
- Migration to Seattle in 2014-2018: 593
- Migration from Seattle to San Antonio: 1,300 (#26 most common destination from Seattle)
- Net migration: 707 to San Antonio

#24. Waco, TX Metro Area
- Migration to Waco in 2014-2018: 621
- Migration from Waco to San Antonio: 455 (#6 most common destination from Waco)
- Net migration: 166 to Waco

#23. Atlanta-Sandy Springs-Roswell, GA Metro Area
- Migration to Atlanta in 2014-2018: 691
- Migration from Atlanta to San Antonio: 788 (#56 most common destination from Atlanta)
- Net migration: 97 to San Antonio

#22. Philadelphia-Camden-Wilmington, PA-NJ-DE-MD Metro Area
- Migration to Philadelphia in 2014-2018: 712
- Migration from Philadelphia to San Antonio: 739 (#44 most common destination from Philadelphia)
- Net migration: 27 to San Antonio

#21. New York-Newark-Jersey City, NY-NJ-PA Metro Area
- Migration to New York in 2014-2018: 714
- Migration from New York to San Antonio: 781 (#101 most common destination from New York)
- Net migration: 67 to San Antonio

#20. Oklahoma City, OK Metro Area
- Migration to Oklahoma City in 2014-2018: 723
- Migration from Oklahoma City to San Antonio: 524 (#11 most common destination from Oklahoma City)
- Net migration: 199 to Oklahoma City

#19. Urban Honolulu, HI Metro Area
- Migration to Urban Honolulu in 2014-2018: 768
- Migration from Urban Honolulu to San Antonio: 748 (#18 most common destination from Urban Honolulu)
- Net migration: 20 to Urban Honolulu
#18. Brownsville-Harlingen, TX Metro Area
- Migration to Brownsville in 2014-2018: 797
- Migration from Brownsville to San Antonio: 1,961 (#1 most common destination from Brownsville)
- Net migration: 1,164 to San Antonio

#17. Virginia Beach-Norfolk-Newport News, VA-NC Metro Area
- Migration to Virginia Beach in 2014-2018: 816
- Migration from Virginia Beach to San Antonio: 1,382 (#9 most common destination from Virginia Beach)
- Net migration: 566 to San Antonio

#16. Nashville-Davidson--Murfreesboro--Franklin, TN Metro Area
- Migration to Nashville in 2014-2018: 843
- Migration from Nashville to San Antonio: 205 (#60 most common destination from Nashville)
- Net migration: 638 to Nashville

#15. Los Angeles-Long Beach-Anaheim, CA Metro Area
- Migration to Los Angeles in 2014-2018: 849
- Migration from Los Angeles to San Antonio: 2,145 (#26 most common destination from Los Angeles)
- Net migration: 1,296 to San Antonio

#14. Beaumont-Port Arthur, TX Metro Area
- Migration to Beaumont in 2014-2018: 857
- Migration from Beaumont to San Antonio: 597 (#6 most common destination from Beaumont)
- Net migration: 260 to Beaumont

#13. Phoenix-Mesa-Scottsdale, AZ Metro Area
- Migration to Phoenix in 2014-2018: 904
- Migration from Phoenix to San Antonio: 1,641 (#19 most common destination from Phoenix)
- Net migration: 737 to San Antonio

#12. Chicago-Naperville-Elgin, IL-IN-WI Metro Area
- Migration to Chicago in 2014-2018: 947
- Migration from Chicago to San Antonio: 1,802 (#40 most common destination from Chicago)
- Net migration: 855 to San Antonio

#11. Colorado Springs, CO Metro Area
- Migration to Colorado Springs in 2014-2018: 967
- Migration from Colorado Springs to San Antonio: 905 (#11 most common destination from Colorado Springs)
- Net migration: 62 to Colorado Springs
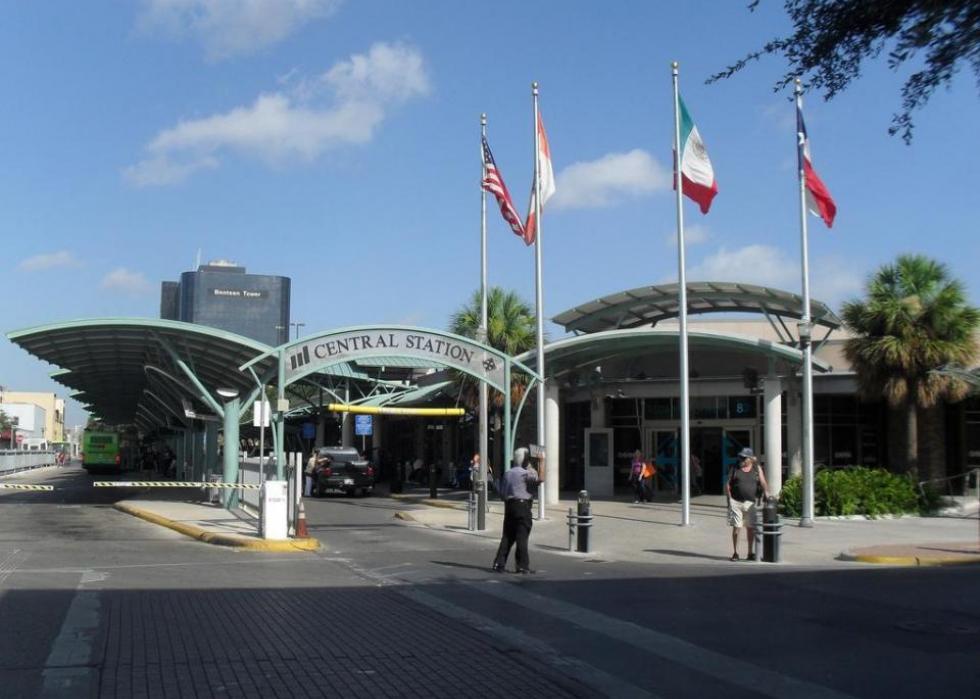
#10. McAllen-Edinburg-Mission, TX Metro Area
- Migration to McAllen in 2014-2018: 1,206
- Migration from McAllen to San Antonio: 3,190 (#1 most common destination from McAllen)
- Net migration: 1,984 to San Antonio

#9. El Paso, TX Metro Area
- Migration to El Paso in 2014-2018: 1,434
- Migration from El Paso to San Antonio: 2,520 (#2 most common destination from El Paso)
- Net migration: 1,086 to San Antonio

#8. Killeen-Temple, TX Metro Area
- Migration to Killeen in 2014-2018: 1,446
- Migration from Killeen to San Antonio: 2,056 (#4 most common destination from Killeen)
- Net migration: 610 to San Antonio

#7. Lubbock, TX Metro Area
- Migration to Lubbock in 2014-2018: 1,678
- Migration from Lubbock to San Antonio: 485 (#5 most common destination from Lubbock)
- Net migration: 1,193 to Lubbock

#6. Washington-Arlington-Alexandria, DC-VA-MD-WV Metro Area
- Migration to Washington in 2014-2018: 1,826
- Migration from Washington to San Antonio: 1,882 (#31 most common destination from Washington)
- Net migration: 56 to San Antonio

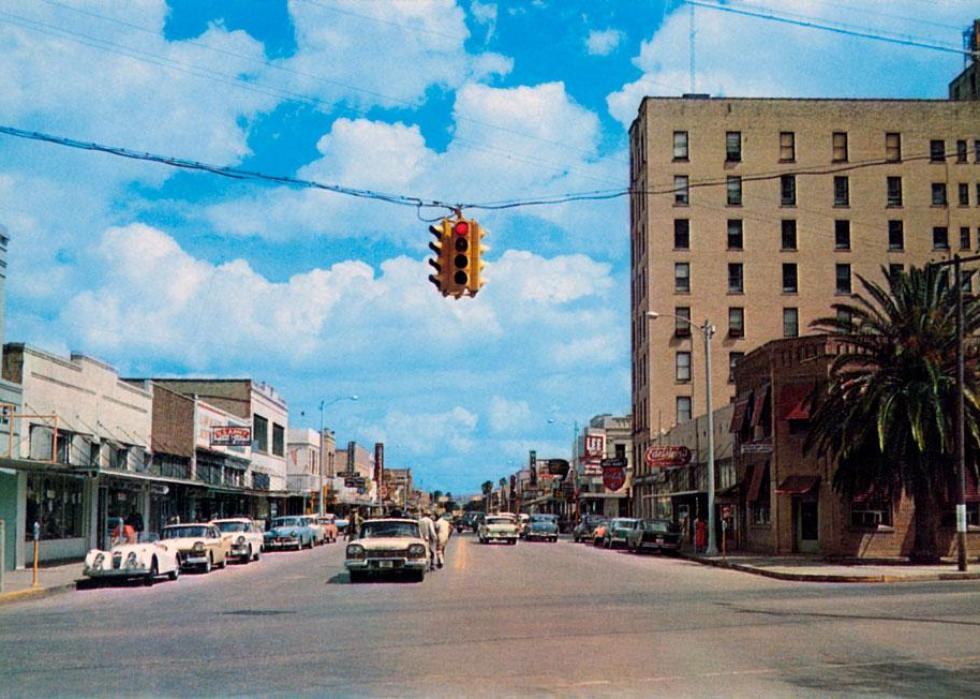
#5. Corpus Christi, TX Metro Area
- Migration to Corpus Christi in 2014-2018: 1,875
- Migration from Corpus Christi to San Antonio: 2,123 (#2 most common destination from Corpus Christi)
- Net migration: 248 to San Antonio

#4. College Station-Bryan, TX Metro Area
- Migration to College Station in 2014-2018: 2,247
- Migration from College Station to San Antonio: 1,627 (#3 most common destination from College Station)
- Net migration: 620 to College Station

#3. Houston-The Woodlands-Sugar Land, TX Metro Area
- Migration to Houston in 2014-2018: 8,398
- Migration from Houston to San Antonio: 7,935 (#3 most common destination from Houston)
- Net migration: 463 to Houston

#2. Dallas-Fort Worth-Arlington, TX Metro Area
- Migration to Dallas in 2014-2018: 8,651
- Migration from Dallas to San Antonio: 5,781 (#3 most common destination from Dallas)
- Net migration: 2,870 to Dallas

#1. Austin-Round Rock, TX Metro Area
- Migration to Austin in 2014-2018: 10,161
- Migration from Austin to San Antonio: 8,427 (#3 most common destination from Austin)
- Net migration: 1,734 to Austin


