
Where people in Atlantic City are moving to most
Written by:
April 18, 2021
Bob Jagendorf // Wikicommons
Where people in Atlantic City are moving to most
Stacker compiled a list of where people in Atlantic City are moving to the most using data from the U.S. Census Bureau. Metros are ranked by the estimated number of people who moved to the metro from Atlantic City between 2014 and 2018. Ties were broken by gross migration.

1 / 50
Wangkun Jia // Shutterstock
#50. Albany-Schenectady-Troy, NY Metro Area
- Migration to Albany in 2014-2018: 34
- Migration from Albany to Atlantic City: 10 (#151 most common destination from Albany)
- Net migration: 24 to Albany
- Migration from Albany to Atlantic City: 10 (#151 most common destination from Albany)
- Net migration: 24 to Albany

2 / 50
Nicholas // Wikimedia Commons
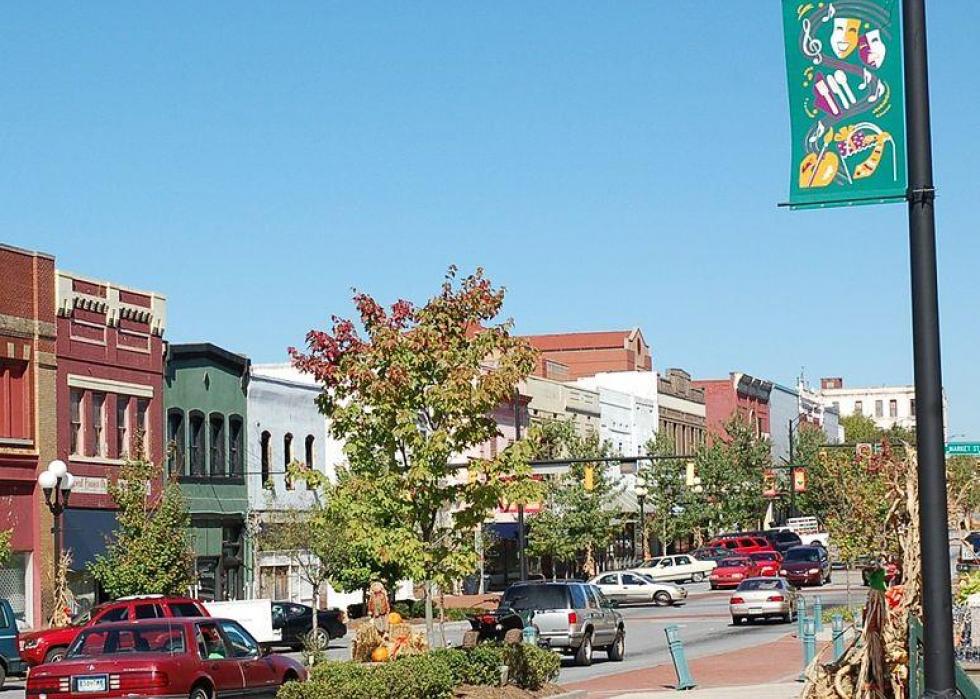
#49. Reading, PA Metro Area
- Migration to Reading in 2014-2018: 35
- Migration from Reading to Atlantic City: 0
- Net migration: 35 to Reading
- Migration from Reading to Atlantic City: 0
- Net migration: 35 to Reading

3 / 50
Edmund Garman // Flickr
#48. Salem, OR Metro Area
- Migration to Salem in 2014-2018: 35
- Migration from Salem to Atlantic City: 0
- Net migration: 35 to Salem
- Migration from Salem to Atlantic City: 0
- Net migration: 35 to Salem

4 / 50
Photolitherland // Wikicommons
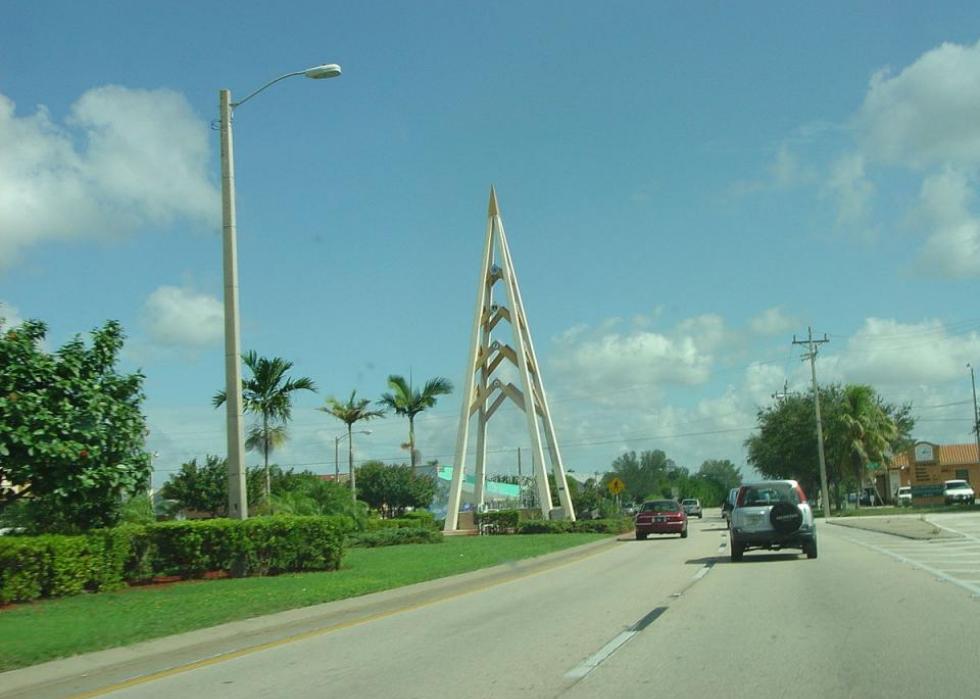
#47. Little Rock-North Little Rock-Conway, AR Metro Area
- Migration to Little Rock in 2014-2018: 36
- Migration from Little Rock to Atlantic City: 0
- Net migration: 36 to Little Rock
- Migration from Little Rock to Atlantic City: 0
- Net migration: 36 to Little Rock

5 / 50
Don Ramey Logan // Wikicommons
#46. San Jose-Sunnyvale-Santa Clara, CA Metro Area
- Migration to San Jose in 2014-2018: 36
- Migration from San Jose to Atlantic City: 0
- Net migration: 36 to San Jose
- Migration from San Jose to Atlantic City: 0
- Net migration: 36 to San Jose

6 / 50
SD Dirk // Flickr
#45. San Diego-Carlsbad, CA Metro Area
- Migration to San Diego in 2014-2018: 36
- Migration from San Diego to Atlantic City: 1 (#326 most common destination from San Diego)
- Net migration: 35 to San Diego
- Migration from San Diego to Atlantic City: 1 (#326 most common destination from San Diego)
- Net migration: 35 to San Diego

7 / 50
Christopher & Amy Esposito // Wikicommons
#44. Chicago-Naperville-Elgin, IL-IN-WI Metro Area
- Migration to Chicago in 2014-2018: 36
- Migration from Chicago to Atlantic City: 49 (#266 most common destination from Chicago)
- Net migration: 13 to Atlantic City
- Migration from Chicago to Atlantic City: 49 (#266 most common destination from Chicago)
- Net migration: 13 to Atlantic City

8 / 50
Pixabay
#43. Austin-Round Rock, TX Metro Area
- Migration to Austin in 2014-2018: 41
- Migration from Austin to Atlantic City: 0
- Net migration: 41 to Austin
- Migration from Austin to Atlantic City: 0
- Net migration: 41 to Austin

9 / 50
Annette Teng // Wikimedia Commons
#42. Lynchburg, VA Metro Area
- Migration to Lynchburg in 2014-2018: 41
- Migration from Lynchburg to Atlantic City: 0
- Net migration: 41 to Lynchburg
- Migration from Lynchburg to Atlantic City: 0
- Net migration: 41 to Lynchburg

10 / 50
Michael Dubenetsky // Shutterstock
#41. Norwich-New London, CT Metro Area
- Migration to Norwich in 2014-2018: 41
- Migration from Norwich to Atlantic City: 27 (#67 most common destination from Norwich)
- Net migration: 14 to Norwich
- Migration from Norwich to Atlantic City: 27 (#67 most common destination from Norwich)
- Net migration: 14 to Norwich

11 / 50
LPS.1 // Wikicommons
#40. Stockton-Lodi, CA Metro Area
- Migration to Stockton in 2014-2018: 42
- Migration from Stockton to Atlantic City: 0
- Net migration: 42 to Stockton
- Migration from Stockton to Atlantic City: 0
- Net migration: 42 to Stockton

12 / 50
DPPed// Wikimedia
#39. Phoenix-Mesa-Scottsdale, AZ Metro Area
- Migration to Phoenix in 2014-2018: 44
- Migration from Phoenix to Atlantic City: 0
- Net migration: 44 to Phoenix
- Migration from Phoenix to Atlantic City: 0
- Net migration: 44 to Phoenix

13 / 50
ESB Professional // Shutterstock
#38. Pittsburgh, PA Metro Area
- Migration to Pittsburgh in 2014-2018: 44
- Migration from Pittsburgh to Atlantic City: 1 (#262 most common destination from Pittsburgh)
- Net migration: 43 to Pittsburgh
- Migration from Pittsburgh to Atlantic City: 1 (#262 most common destination from Pittsburgh)
- Net migration: 43 to Pittsburgh

14 / 50
Ron Reiring // Wikicommons
#37. Spokane-Spokane Valley, WA Metro Area
- Migration to Spokane in 2014-2018: 45
- Migration from Spokane to Atlantic City: 0
- Net migration: 45 to Spokane
- Migration from Spokane to Atlantic City: 0
- Net migration: 45 to Spokane

15 / 50
Keizers // Wikimedia Commons
#36. Atlanta-Sandy Springs-Roswell, GA Metro Area
- Migration to Atlanta in 2014-2018: 47
- Migration from Atlanta to Atlantic City: 53 (#231 most common destination from Atlanta)
- Net migration: 6 to Atlantic City
- Migration from Atlanta to Atlantic City: 53 (#231 most common destination from Atlanta)
- Net migration: 6 to Atlantic City
16 / 50
DANIEL SLIM/AFP // Getty Images
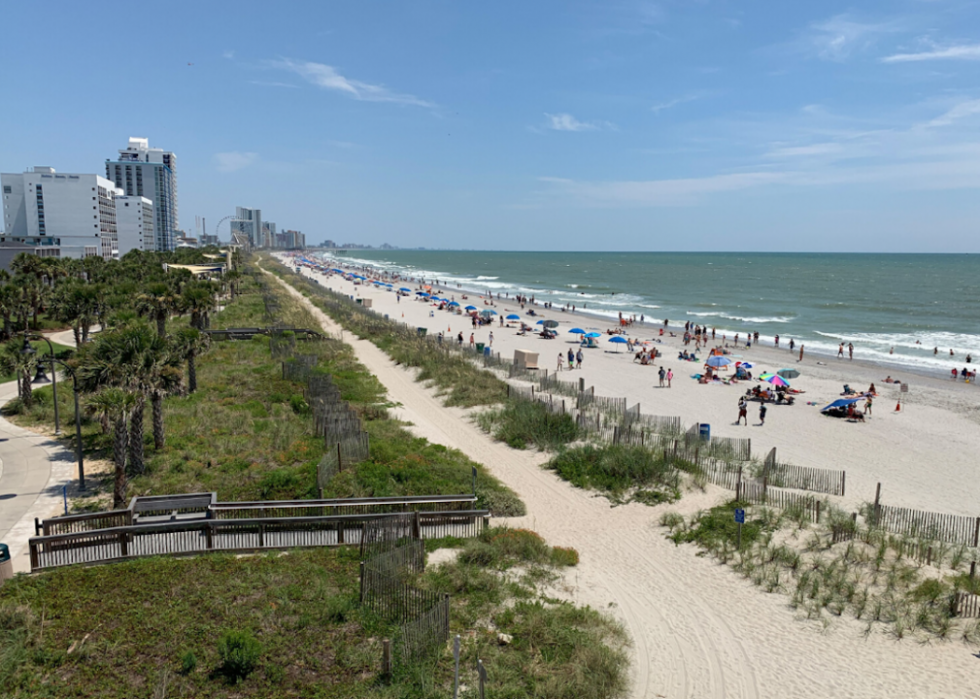
#35. Myrtle Beach-Conway-North Myrtle Beach, SC-NC Metro Area
- Migration to Myrtle Beach in 2014-2018: 49
- Migration from Myrtle Beach to Atlantic City: 30 (#94 most common destination from Myrtle Beach)
- Net migration: 19 to Myrtle Beach
- Migration from Myrtle Beach to Atlantic City: 30 (#94 most common destination from Myrtle Beach)
- Net migration: 19 to Myrtle Beach

17 / 50
Wikicommons
#34. State College, PA Metro Area
- Migration to State College in 2014-2018: 50
- Migration from State College to Atlantic City: 0
- Net migration: 50 to State College
- Migration from State College to Atlantic City: 0
- Net migration: 50 to State College

18 / 50
Ron Cogswell // Flickr
#33. Johnstown, PA Metro Area
- Migration to Johnstown in 2014-2018: 51
- Migration from Johnstown to Atlantic City: 0
- Net migration: 51 to Johnstown
- Migration from Johnstown to Atlantic City: 0
- Net migration: 51 to Johnstown

19 / 50
Sean Pavone // Shutterstock
#32. Columbus, OH Metro Area
- Migration to Columbus in 2014-2018: 53
- Migration from Columbus to Atlantic City: 22 (#194 most common destination from Columbus)
- Net migration: 31 to Columbus
- Migration from Columbus to Atlantic City: 22 (#194 most common destination from Columbus)
- Net migration: 31 to Columbus
20 / 50
Pat McGinley // Shutterstock
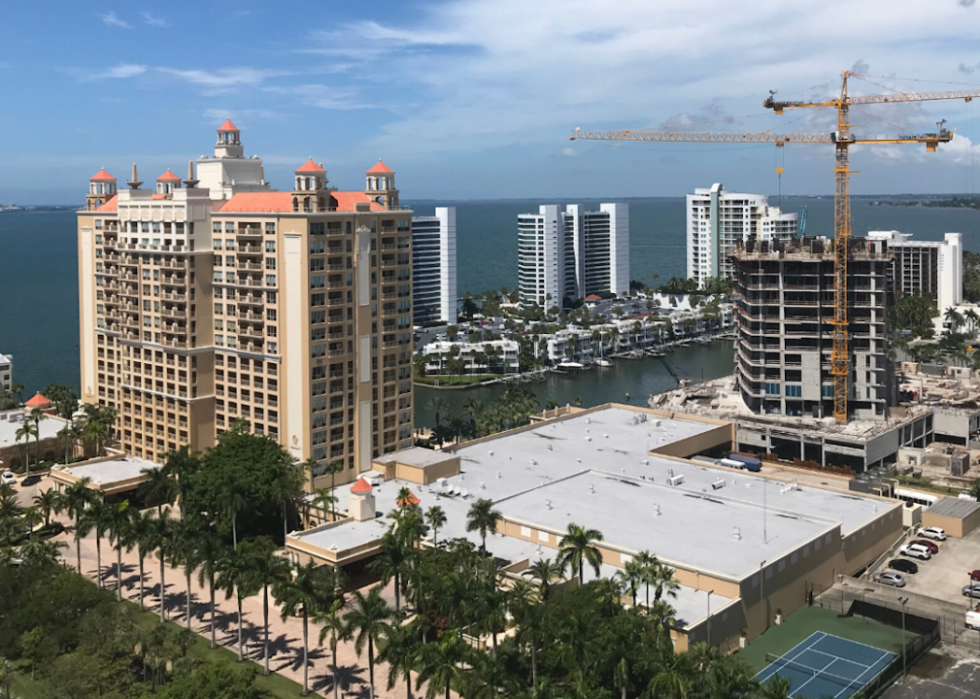
#31. North Port-Sarasota-Bradenton, FL Metro Area
- Migration to North Port in 2014-2018: 60
- Migration from North Port to Atlantic City: 12 (#184 most common destination from North Port)
- Net migration: 48 to North Port
- Migration from North Port to Atlantic City: 12 (#184 most common destination from North Port)
- Net migration: 48 to North Port

21 / 50
Atlpedia// Wikimedia
#30. Durham-Chapel Hill, NC Metro Area
- Migration to Durham in 2014-2018: 71
- Migration from Durham to Atlantic City: 1 (#186 most common destination from Durham)
- Net migration: 70 to Durham
- Migration from Durham to Atlantic City: 1 (#186 most common destination from Durham)
- Net migration: 70 to Durham
22 / 50
MicheleHaro // Wikimedia
#29. Palm Bay-Melbourne-Titusville, FL Metro Area
- Migration to Palm Bay in 2014-2018: 75
- Migration from Palm Bay to Atlantic City: 0
- Net migration: 75 to Palm Bay
- Migration from Palm Bay to Atlantic City: 0
- Net migration: 75 to Palm Bay

23 / 50
Pixabay
#28. San Antonio-New Braunfels, TX Metro Area
- Migration to San Antonio in 2014-2018: 75
- Migration from San Antonio to Atlantic City: 0
- Net migration: 75 to San Antonio
- Migration from San Antonio to Atlantic City: 0
- Net migration: 75 to San Antonio

24 / 50
Felix Mizioznikov // Shutterstock
#27. Port St. Lucie, FL Metro Area
- Migration to Port St. Lucie in 2014-2018: 77
- Migration from Port St. Lucie to Atlantic City: 0
- Net migration: 77 to Port St. Lucie
- Migration from Port St. Lucie to Atlantic City: 0
- Net migration: 77 to Port St. Lucie

25 / 50
BusinessEditorUSA // Wikimedia Commons
#26. Charlotte-Concord-Gastonia, NC-SC Metro Area
- Migration to Charlotte in 2014-2018: 79
- Migration from Charlotte to Atlantic City: 56 (#147 most common destination from Charlotte)
- Net migration: 23 to Charlotte
- Migration from Charlotte to Atlantic City: 56 (#147 most common destination from Charlotte)
- Net migration: 23 to Charlotte

26 / 50
FloridaStock // Shutterstock
#25. Naples-Immokalee-Marco Island, FL Metro Area
- Migration to Naples in 2014-2018: 83
- Migration from Naples to Atlantic City: 0
- Net migration: 83 to Naples
- Migration from Naples to Atlantic City: 0
- Net migration: 83 to Naples

27 / 50
Ebyabe // Wikicommons
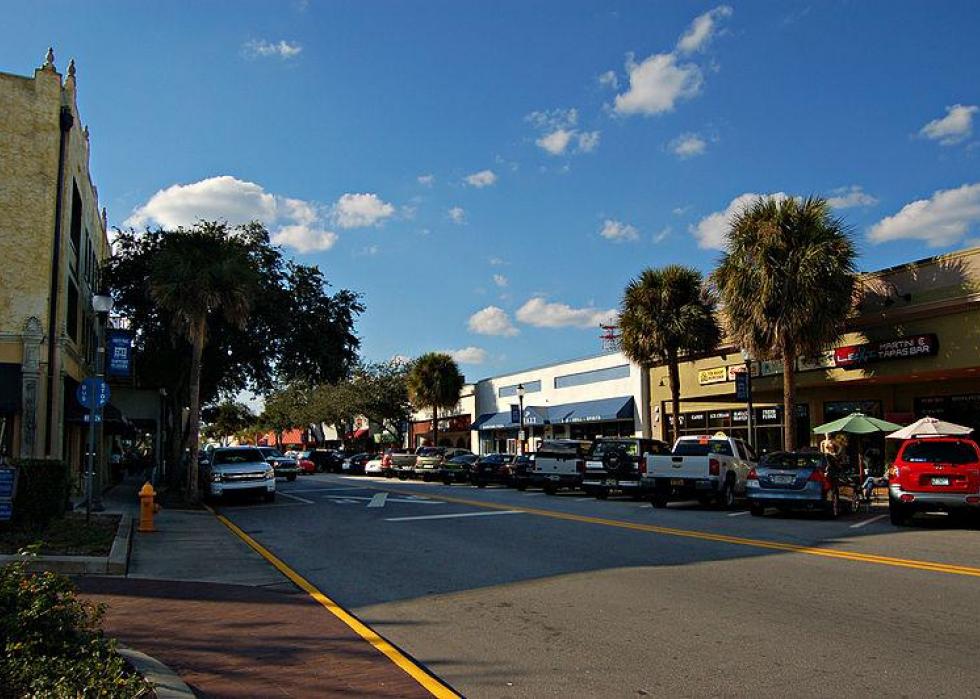
#24. Sebastian-Vero Beach, FL Metro Area
- Migration to Sebastian in 2014-2018: 85
- Migration from Sebastian to Atlantic City: 27 (#45 most common destination from Sebastian)
- Net migration: 58 to Sebastian
- Migration from Sebastian to Atlantic City: 27 (#45 most common destination from Sebastian)
- Net migration: 58 to Sebastian

28 / 50
Sean Pavone // Shutterstock
#23. Boston-Cambridge-Newton, MA-NH Metro Area
- Migration to Boston in 2014-2018: 85
- Migration from Boston to Atlantic City: 68 (#157 most common destination from Boston)
- Net migration: 17 to Boston
- Migration from Boston to Atlantic City: 68 (#157 most common destination from Boston)
- Net migration: 17 to Boston

29 / 50
skeeze // Pixabay
#22. Houston-The Woodlands-Sugar Land, TX Metro Area
- Migration to Houston in 2014-2018: 86
- Migration from Houston to Atlantic City: 23 (#278 most common destination from Houston)
- Net migration: 63 to Houston
- Migration from Houston to Atlantic City: 23 (#278 most common destination from Houston)
- Net migration: 63 to Houston

30 / 50
Luv24jmg // Wikimedia Commons
#21. Ocala, FL Metro Area
- Migration to Ocala in 2014-2018: 87
- Migration from Ocala to Atlantic City: 0
- Net migration: 87 to Ocala
- Migration from Ocala to Atlantic City: 0
- Net migration: 87 to Ocala
31 / 50
Ken Lund // Flickr
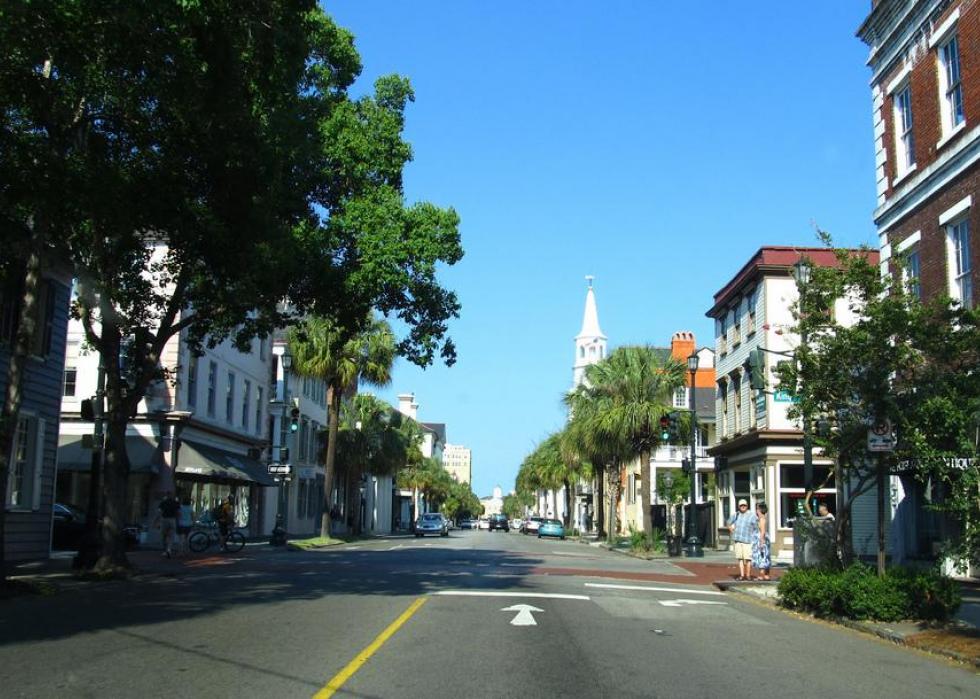
#20. Charleston-North Charleston, SC Metro Area
- Migration to Charleston in 2014-2018: 91
- Migration from Charleston to Atlantic City: 18 (#154 most common destination from Charleston)
- Net migration: 73 to Charleston
- Migration from Charleston to Atlantic City: 18 (#154 most common destination from Charleston)
- Net migration: 73 to Charleston

32 / 50
Pixabay
#19. Sacramento--Roseville--Arden-Arcade, CA Metro Area
- Migration to Sacramento in 2014-2018: 96
- Migration from Sacramento to Atlantic City: 0
- Net migration: 96 to Sacramento
- Migration from Sacramento to Atlantic City: 0
- Net migration: 96 to Sacramento
33 / 50
Skywalker195 // Wikimedia Commons
#18. Greenville-Anderson-Mauldin, SC Metro Area
- Migration to Greenville in 2014-2018: 99
- Migration from Greenville to Atlantic City: 0
- Net migration: 99 to Greenville
- Migration from Greenville to Atlantic City: 0
- Net migration: 99 to Greenville

34 / 50
Alvesgaspar // Wikimedia
#17. Tampa-St. Petersburg-Clearwater, FL Metro Area
- Migration to Tampa in 2014-2018: 103
- Migration from Tampa to Atlantic City: 274 (#76 most common destination from Tampa)
- Net migration: 171 to Atlantic City
- Migration from Tampa to Atlantic City: 274 (#76 most common destination from Tampa)
- Net migration: 171 to Atlantic City

35 / 50
Eric Fischer // Wikicommons
#16. Salisbury, MD-DE Metro Area
- Migration to Salisbury in 2014-2018: 114
- Migration from Salisbury to Atlantic City: 45 (#48 most common destination from Salisbury)
- Net migration: 69 to Salisbury
- Migration from Salisbury to Atlantic City: 45 (#48 most common destination from Salisbury)
- Net migration: 69 to Salisbury

36 / 50
Paul Leiby // Wikimedia Commons
#15. Allentown-Bethlehem-Easton, PA-NJ Metro Area
- Migration to Allentown in 2014-2018: 118
- Migration from Allentown to Atlantic City: 94 (#55 most common destination from Allentown)
- Net migration: 24 to Allentown
- Migration from Allentown to Atlantic City: 94 (#55 most common destination from Allentown)
- Net migration: 24 to Allentown

37 / 50
Ruhrfisch // Wikimedia
#14. Williamsport, PA Metro Area
- Migration to Williamsport in 2014-2018: 145
- Migration from Williamsport to Atlantic City: 0
- Net migration: 145 to Williamsport
- Migration from Williamsport to Atlantic City: 0
- Net migration: 145 to Williamsport

38 / 50
randy andy // Shutterstock
#13. Las Vegas-Henderson-Paradise, NV Metro Area
- Migration to Las Vegas in 2014-2018: 146
- Migration from Las Vegas to Atlantic City: 40 (#181 most common destination from Las Vegas)
- Net migration: 106 to Las Vegas
- Migration from Las Vegas to Atlantic City: 40 (#181 most common destination from Las Vegas)
- Net migration: 106 to Las Vegas

39 / 50
Alan Botting // Wikimedia Commons
#12. Dallas-Fort Worth-Arlington, TX Metro Area
- Migration to Dallas in 2014-2018: 148
- Migration from Dallas to Atlantic City: 0
- Net migration: 148 to Dallas
- Migration from Dallas to Atlantic City: 0
- Net migration: 148 to Dallas
40 / 50
Sanibel Sun // WikiCommons
#11. Cape Coral-Fort Myers, FL Metro Area
- Migration to Cape Coral in 2014-2018: 148
- Migration from Cape Coral to Atlantic City: 23 (#123 most common destination from Cape Coral)
- Net migration: 125 to Cape Coral
- Migration from Cape Coral to Atlantic City: 23 (#123 most common destination from Cape Coral)
- Net migration: 125 to Cape Coral

41 / 50
Andrew Bossi // Wikimedia
#10. Washington-Arlington-Alexandria, DC-VA-MD-WV Metro Area
- Migration to Washington in 2014-2018: 149
- Migration from Washington to Atlantic City: 0
- Net migration: 149 to Washington
- Migration from Washington to Atlantic City: 0
- Net migration: 149 to Washington

42 / 50
Smallbones // Wikimedia Commons
#9. Lancaster, PA Metro Area
- Migration to Lancaster in 2014-2018: 194
- Migration from Lancaster to Atlantic City: 80 (#36 most common destination from Lancaster)
- Net migration: 114 to Lancaster
- Migration from Lancaster to Atlantic City: 80 (#36 most common destination from Lancaster)
- Net migration: 114 to Lancaster

43 / 50
Sherry V Smith // Shutterstock
#8. Virginia Beach-Norfolk-Newport News, VA-NC Metro Area
- Migration to Virginia Beach in 2014-2018: 207
- Migration from Virginia Beach to Atlantic City: 5 (#280 most common destination from Virginia Beach)
- Net migration: 202 to Virginia Beach
- Migration from Virginia Beach to Atlantic City: 5 (#280 most common destination from Virginia Beach)
- Net migration: 202 to Virginia Beach

44 / 50
Famartin // Wikicommons
#7. Baltimore-Columbia-Towson, MD Metro Area
- Migration to Baltimore in 2014-2018: 214
- Migration from Baltimore to Atlantic City: 31 (#192 most common destination from Baltimore)
- Net migration: 183 to Baltimore
- Migration from Baltimore to Atlantic City: 31 (#192 most common destination from Baltimore)
- Net migration: 183 to Baltimore

45 / 50
Christopher Boswell // Shutterstock
#6. Trenton, NJ Metro Area
- Migration to Trenton in 2014-2018: 300
- Migration from Trenton to Atlantic City: 365 (#3 most common destination from Trenton)
- Net migration: 65 to Atlantic City
- Migration from Trenton to Atlantic City: 365 (#3 most common destination from Trenton)
- Net migration: 65 to Atlantic City

46 / 50
Kolossos // Wikimedia Commons
#5. Miami-Fort Lauderdale-West Palm Beach, FL Metro Area
- Migration to Miami in 2014-2018: 354
- Migration from Miami to Atlantic City: 118 (#152 most common destination from Miami)
- Net migration: 236 to Miami
- Migration from Miami to Atlantic City: 118 (#152 most common destination from Miami)
- Net migration: 236 to Miami

47 / 50
JoshE3 // Wikicommons
#4. Ocean City, NJ Metro Area
- Migration to Ocean City in 2014-2018: 507
- Migration from Ocean City to Atlantic City: 1,381 (#1 most common destination from Ocean City)
- Net migration: 874 to Atlantic City
- Migration from Ocean City to Atlantic City: 1,381 (#1 most common destination from Ocean City)
- Net migration: 874 to Atlantic City

48 / 50
Smallbones // Wikicommons
#3. Vineland-Bridgeton, NJ Metro Area
- Migration to Vineland in 2014-2018: 1,059
- Migration from Vineland to Atlantic City: 1,207 (#3 most common destination from Vineland)
- Net migration: 148 to Atlantic City
- Migration from Vineland to Atlantic City: 1,207 (#3 most common destination from Vineland)
- Net migration: 148 to Atlantic City

49 / 50
f11photo // Shutterstock
#2. Philadelphia-Camden-Wilmington, PA-NJ-DE-MD Metro Area
- Migration to Philadelphia in 2014-2018: 2,764
- Migration from Philadelphia to Atlantic City: 3,241 (#12 most common destination from Philadelphia)
- Net migration: 477 to Atlantic City
- Migration from Philadelphia to Atlantic City: 3,241 (#12 most common destination from Philadelphia)
- Net migration: 477 to Atlantic City

50 / 50
King of Hearts // Wikimedia
#1. New York-Newark-Jersey City, NY-NJ-PA Metro Area
- Migration to New York in 2014-2018: 3,042
- Migration from New York to Atlantic City: 2,247 (#50 most common destination from New York)
- Net migration: 795 to New York
- Migration from New York to Atlantic City: 2,247 (#50 most common destination from New York)
- Net migration: 795 to New York


