
Where people in Philadelphia are moving to most
Written by:
April 18, 2021
f11photo // Shutterstock
Where people in Philadelphia are moving to most
Stacker compiled a list of where people in Philadelphia are moving to the most using data from the U.S. Census Bureau. Metros are ranked by the estimated number of people who moved to the metro from Philadelphia between 2014 and 2018. Ties were broken by gross migration.

1 / 50
Don Ramey Logan // Wikicommons
#50. San Jose-Sunnyvale-Santa Clara, CA Metro Area
- Migration to San Jose in 2014-2018: 621
- Migration from San Jose to Philadelphia: 526 (#30 most common destination from San Jose)
- Net migration: 95 to San Jose
- Migration from San Jose to Philadelphia: 526 (#30 most common destination from San Jose)
- Net migration: 95 to San Jose
2 / 50
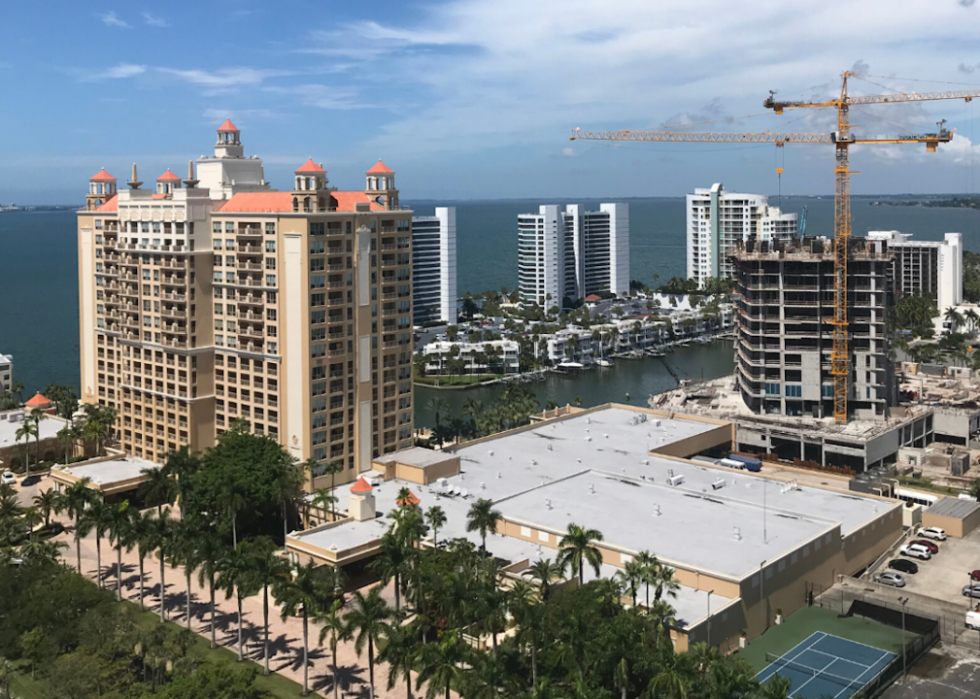
Pat McGinley // Shutterstock
#49. North Port-Sarasota-Bradenton, FL Metro Area
- Migration to North Port in 2014-2018: 639
- Migration from North Port to Philadelphia: 340 (#20 most common destination from North Port)
- Net migration: 299 to North Port
- Migration from North Port to Philadelphia: 340 (#20 most common destination from North Port)
- Net migration: 299 to North Port

3 / 50
Akhenaton06 // Wikicommons
#48. Columbia, SC Metro Area
- Migration to Columbia in 2014-2018: 667
- Migration from Columbia to Philadelphia: 55 (#90 most common destination from Columbia)
- Net migration: 612 to Columbia
- Migration from Columbia to Philadelphia: 55 (#90 most common destination from Columbia)
- Net migration: 612 to Columbia

4 / 50
Sean Pavone // Shutterstock
#47. Columbus, OH Metro Area
- Migration to Columbus in 2014-2018: 697
- Migration from Columbus to Philadelphia: 498 (#26 most common destination from Columbus)
- Net migration: 199 to Columbus
- Migration from Columbus to Philadelphia: 498 (#26 most common destination from Columbus)
- Net migration: 199 to Columbus

5 / 50
Sharkshock // Shutterstock
#46. Raleigh, NC Metro Area
- Migration to Raleigh in 2014-2018: 701
- Migration from Raleigh to Philadelphia: 734 (#15 most common destination from Raleigh)
- Net migration: 33 to Philadelphia
- Migration from Raleigh to Philadelphia: 734 (#15 most common destination from Raleigh)
- Net migration: 33 to Philadelphia
6 / 50
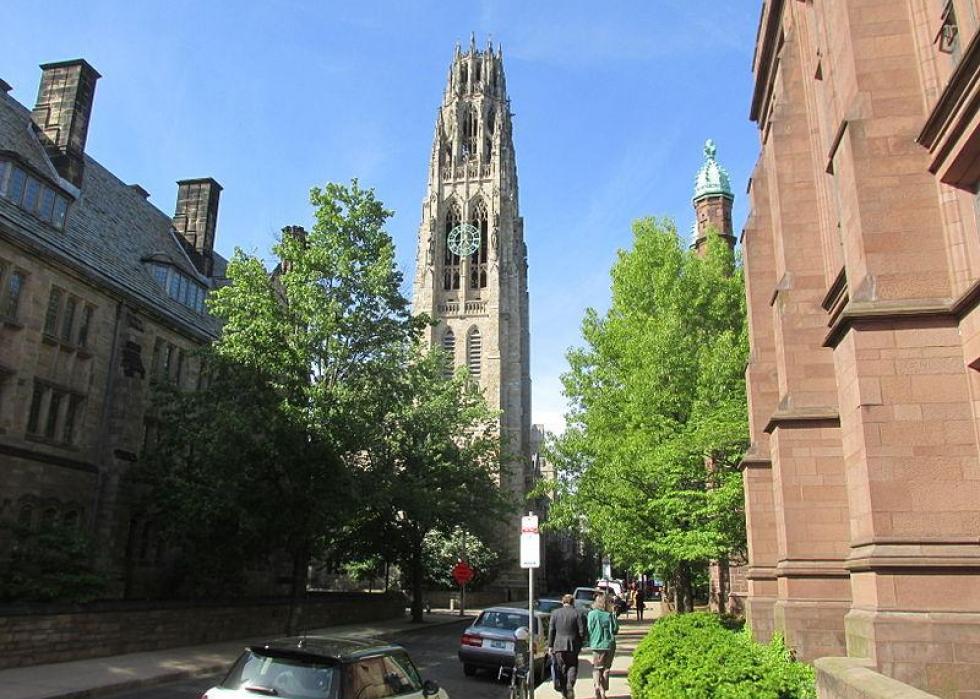
John Phelan // Wikimedia Commons
#45. New Haven-Milford, CT Metro Area
- Migration to New Haven in 2014-2018: 708
- Migration from New Haven to Philadelphia: 414 (#14 most common destination from New Haven)
- Net migration: 294 to New Haven
- Migration from New Haven to Philadelphia: 414 (#14 most common destination from New Haven)
- Net migration: 294 to New Haven

7 / 50
Pixabay
#44. San Antonio-New Braunfels, TX Metro Area
- Migration to San Antonio in 2014-2018: 739
- Migration from San Antonio to Philadelphia: 712 (#22 most common destination from San Antonio)
- Net migration: 27 to San Antonio
- Migration from San Antonio to Philadelphia: 712 (#22 most common destination from San Antonio)
- Net migration: 27 to San Antonio
8 / 50
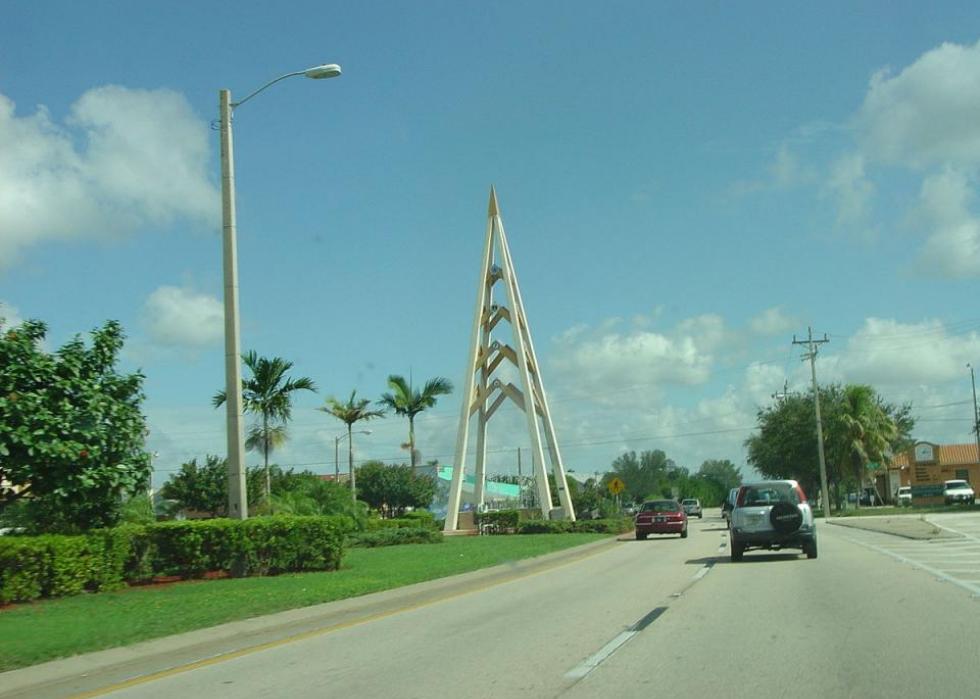
Sanibel Sun // WikiCommons
#43. Cape Coral-Fort Myers, FL Metro Area
- Migration to Cape Coral in 2014-2018: 793
- Migration from Cape Coral to Philadelphia: 113 (#47 most common destination from Cape Coral)
- Net migration: 680 to Cape Coral
- Migration from Cape Coral to Philadelphia: 113 (#47 most common destination from Cape Coral)
- Net migration: 680 to Cape Coral
9 / 50
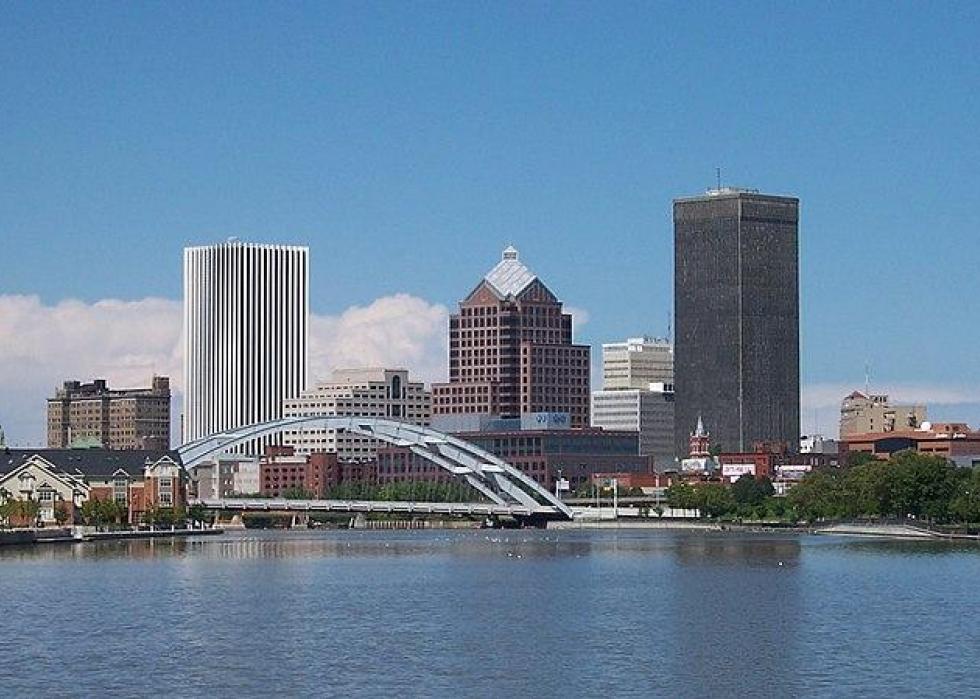
Theresa Marconi // Wikimedia Commons
#42. Rochester, NY Metro Area
- Migration to Rochester in 2014-2018: 797
- Migration from Rochester to Philadelphia: 495 (#11 most common destination from Rochester)
- Net migration: 302 to Rochester
- Migration from Rochester to Philadelphia: 495 (#11 most common destination from Rochester)
- Net migration: 302 to Rochester
10 / 50
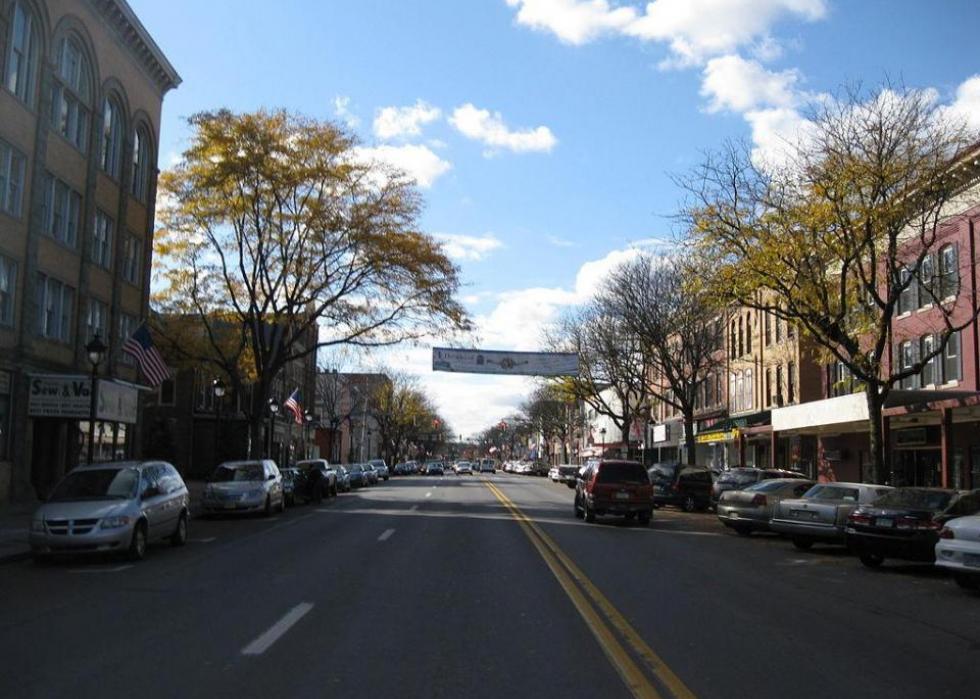
Doug Kerr // Wikicommons
#41. East Stroudsburg, PA Metro Area
- Migration to East Stroudsburg in 2014-2018: 802
- Migration from East Stroudsburg to Philadelphia: 851 (#3 most common destination from East Stroudsburg)
- Net migration: 49 to Philadelphia
- Migration from East Stroudsburg to Philadelphia: 851 (#3 most common destination from East Stroudsburg)
- Net migration: 49 to Philadelphia

11 / 50
PhotosByMahin // Pixabay
#40. Detroit-Warren-Dearborn, MI Metro Area
- Migration to Detroit in 2014-2018: 805
- Migration from Detroit to Philadelphia: 590 (#34 most common destination from Detroit)
- Net migration: 215 to Detroit
- Migration from Detroit to Philadelphia: 590 (#34 most common destination from Detroit)
- Net migration: 215 to Detroit

12 / 50
Atlpedia// Wikimedia
#39. Durham-Chapel Hill, NC Metro Area
- Migration to Durham in 2014-2018: 841
- Migration from Durham to Philadelphia: 586 (#13 most common destination from Durham)
- Net migration: 255 to Durham
- Migration from Durham to Philadelphia: 586 (#13 most common destination from Durham)
- Net migration: 255 to Durham

13 / 50
randy andy // Shutterstock
#38. Las Vegas-Henderson-Paradise, NV Metro Area
- Migration to Las Vegas in 2014-2018: 850
- Migration from Las Vegas to Philadelphia: 493 (#34 most common destination from Las Vegas)
- Net migration: 357 to Las Vegas
- Migration from Las Vegas to Philadelphia: 493 (#34 most common destination from Las Vegas)
- Net migration: 357 to Las Vegas

14 / 50
JonathanVictor // Wikimedia
#37. Bridgeport-Stamford-Norwalk, CT Metro Area
- Migration to Bridgeport in 2014-2018: 943
- Migration from Bridgeport to Philadelphia: 699 (#9 most common destination from Bridgeport)
- Net migration: 244 to Bridgeport
- Migration from Bridgeport to Philadelphia: 699 (#9 most common destination from Bridgeport)
- Net migration: 244 to Bridgeport
15 / 50
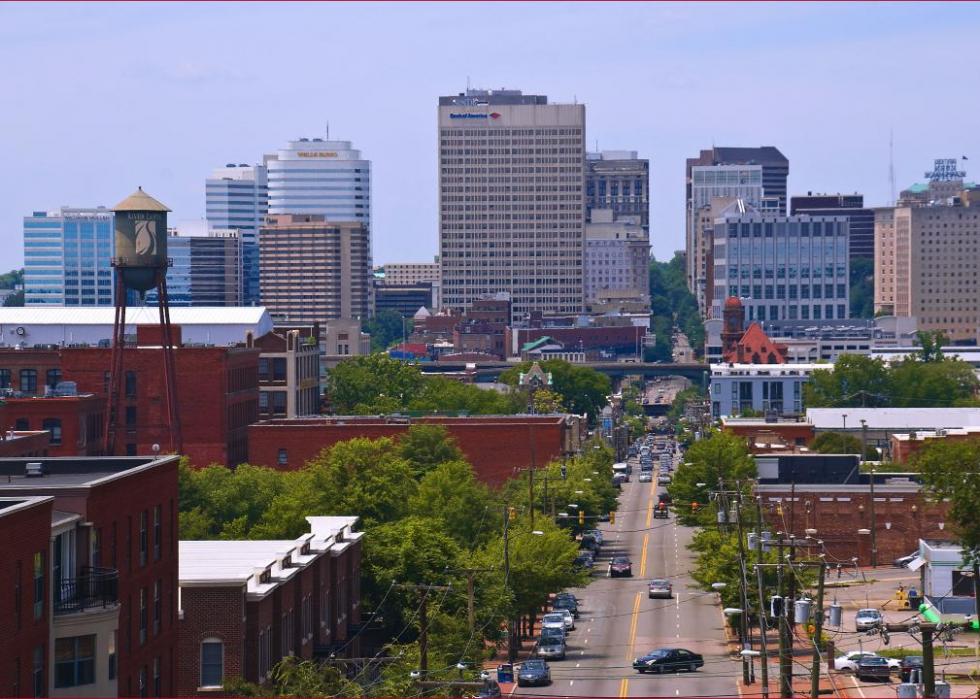
Ron Cogswell//Wikicommons
#36. Richmond, VA Metro Area
- Migration to Richmond in 2014-2018: 1,009
- Migration from Richmond to Philadelphia: 606 (#13 most common destination from Richmond)
- Net migration: 403 to Richmond
- Migration from Richmond to Philadelphia: 606 (#13 most common destination from Richmond)
- Net migration: 403 to Richmond

16 / 50
Ruhrfisch // Wikimedia Commons
#35. Bloomsburg-Berwick, PA Metro Area
- Migration to Bloomsburg in 2014-2018: 1,093
- Migration from Bloomsburg to Philadelphia: 486 (#3 most common destination from Bloomsburg)
- Net migration: 607 to Bloomsburg
- Migration from Bloomsburg to Philadelphia: 486 (#3 most common destination from Bloomsburg)
- Net migration: 607 to Bloomsburg

17 / 50
Smallbones // Wikimedia Commons
#34. York-Hanover, PA Metro Area
- Migration to York in 2014-2018: 1,151
- Migration from York to Philadelphia: 1,125 (#5 most common destination from York)
- Net migration: 26 to York
- Migration from York to Philadelphia: 1,125 (#5 most common destination from York)
- Net migration: 26 to York

18 / 50
SD Dirk // Flickr
#33. San Diego-Carlsbad, CA Metro Area
- Migration to San Diego in 2014-2018: 1,211
- Migration from San Diego to Philadelphia: 313 (#78 most common destination from San Diego)
- Net migration: 898 to San Diego
- Migration from San Diego to Philadelphia: 313 (#78 most common destination from San Diego)
- Net migration: 898 to San Diego
19 / 50
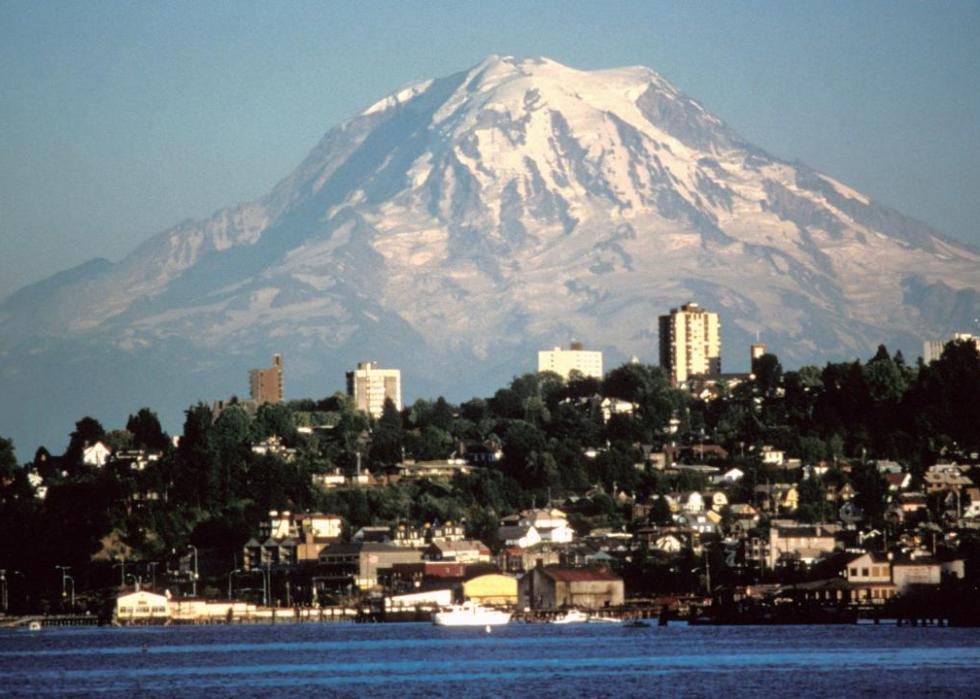
Public Domain
#32. Seattle-Tacoma-Bellevue, WA Metro Area
- Migration to Seattle in 2014-2018: 1,443
- Migration from Seattle to Philadelphia: 1,000 (#35 most common destination from Seattle)
- Net migration: 443 to Seattle
- Migration from Seattle to Philadelphia: 1,000 (#35 most common destination from Seattle)
- Net migration: 443 to Seattle
20 / 50
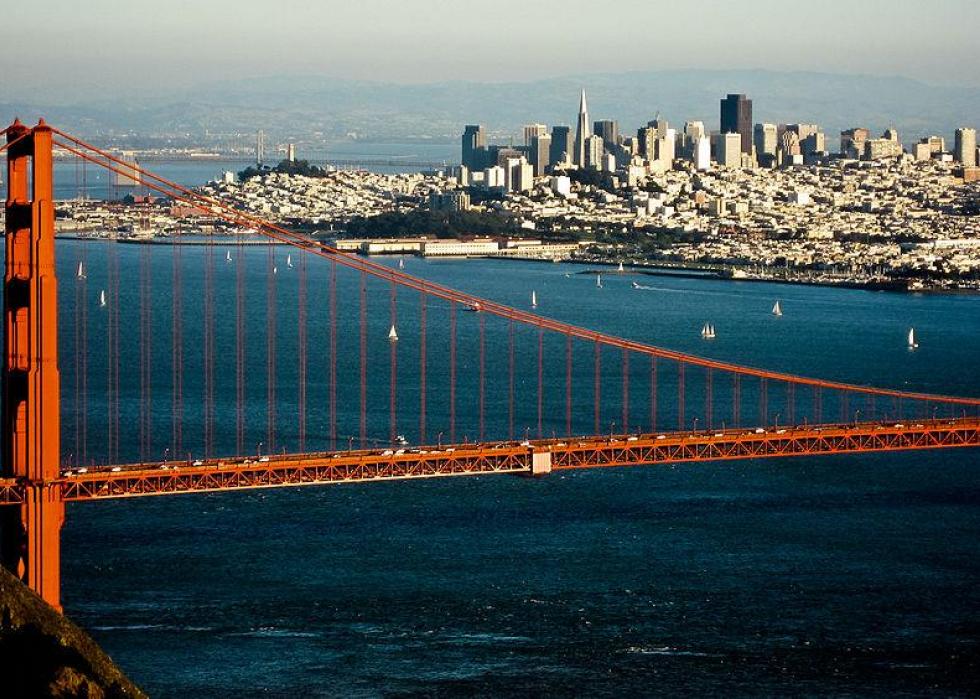
en:User:Paul.h // Wikimedia
#31. San Francisco-Oakland-Hayward, CA Metro Area
- Migration to San Francisco in 2014-2018: 1,527
- Migration from San Francisco to Philadelphia: 1,171 (#32 most common destination from San Francisco)
- Net migration: 356 to San Francisco
- Migration from San Francisco to Philadelphia: 1,171 (#32 most common destination from San Francisco)
- Net migration: 356 to San Francisco

21 / 50
AndrewAvitus // Wikicommons'
#30. Jacksonville, FL Metro Area
- Migration to Jacksonville in 2014-2018: 1,546
- Migration from Jacksonville to Philadelphia: 289 (#48 most common destination from Jacksonville)
- Net migration: 1,257 to Jacksonville
- Migration from Jacksonville to Philadelphia: 289 (#48 most common destination from Jacksonville)
- Net migration: 1,257 to Jacksonville
22 / 50
skeeze // Pixabay
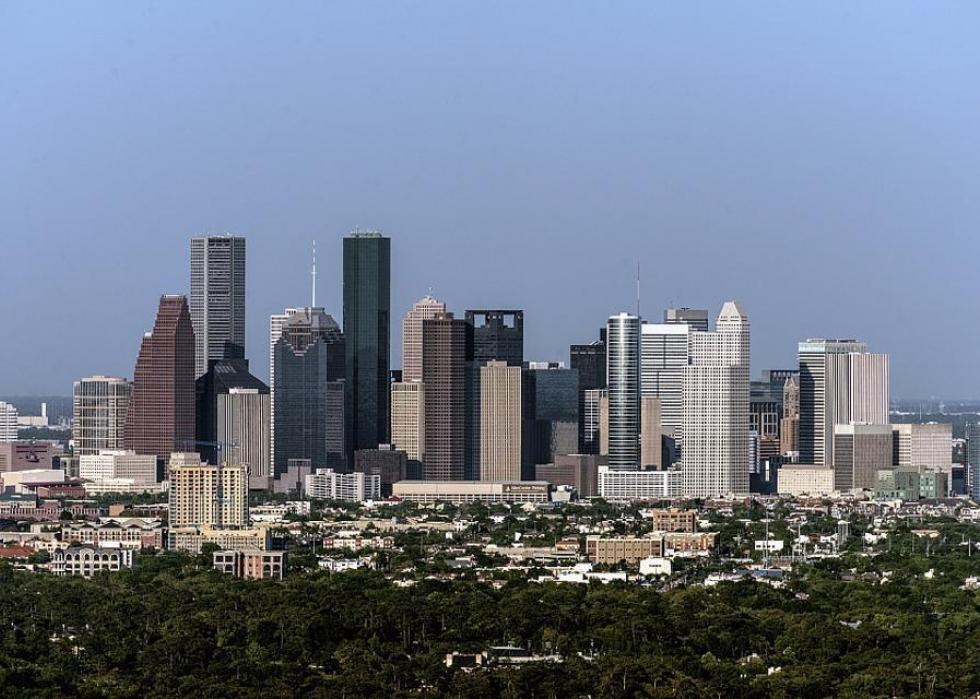
#29. Houston-The Woodlands-Sugar Land, TX Metro Area
- Migration to Houston in 2014-2018: 1,561
- Migration from Houston to Philadelphia: 804 (#40 most common destination from Houston)
- Net migration: 757 to Houston
- Migration from Houston to Philadelphia: 804 (#40 most common destination from Houston)
- Net migration: 757 to Houston

23 / 50
f11photo // Shutterstock
#28. Denver-Aurora-Lakewood, CO Metro Area
- Migration to Denver in 2014-2018: 1,597
- Migration from Denver to Philadelphia: 752 (#29 most common destination from Denver)
- Net migration: 845 to Denver
- Migration from Denver to Philadelphia: 752 (#29 most common destination from Denver)
- Net migration: 845 to Denver

24 / 50
Alan Botting // Wikimedia Commons
#27. Dallas-Fort Worth-Arlington, TX Metro Area
- Migration to Dallas in 2014-2018: 1,638
- Migration from Dallas to Philadelphia: 1,618 (#27 most common destination from Dallas)
- Net migration: 20 to Dallas
- Migration from Dallas to Philadelphia: 1,618 (#27 most common destination from Dallas)
- Net migration: 20 to Dallas

25 / 50
BusinessEditorUSA // Wikimedia Commons
#26. Charlotte-Concord-Gastonia, NC-SC Metro Area
- Migration to Charlotte in 2014-2018: 1,779
- Migration from Charlotte to Philadelphia: 783 (#23 most common destination from Charlotte)
- Net migration: 996 to Charlotte
- Migration from Charlotte to Philadelphia: 783 (#23 most common destination from Charlotte)
- Net migration: 996 to Charlotte
26 / 50
Christopher & Amy Esposito // Wikicommons
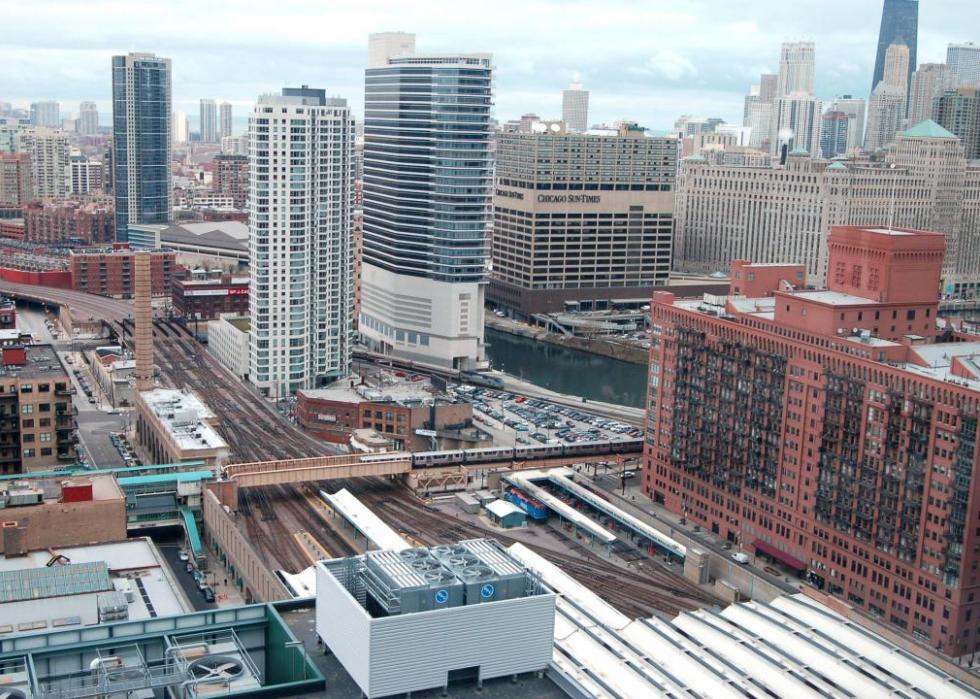
#25. Chicago-Naperville-Elgin, IL-IN-WI Metro Area
- Migration to Chicago in 2014-2018: 1,802
- Migration from Chicago to Philadelphia: 1,547 (#44 most common destination from Chicago)
- Net migration: 255 to Chicago
- Migration from Chicago to Philadelphia: 1,547 (#44 most common destination from Chicago)
- Net migration: 255 to Chicago

27 / 50
DPPed// Wikimedia
#24. Phoenix-Mesa-Scottsdale, AZ Metro Area
- Migration to Phoenix in 2014-2018: 1,901
- Migration from Phoenix to Philadelphia: 812 (#36 most common destination from Phoenix)
- Net migration: 1,089 to Phoenix
- Migration from Phoenix to Philadelphia: 812 (#36 most common destination from Phoenix)
- Net migration: 1,089 to Phoenix

28 / 50
Sherry V Smith // Shutterstock
#23. Virginia Beach-Norfolk-Newport News, VA-NC Metro Area
- Migration to Virginia Beach in 2014-2018: 1,917
- Migration from Virginia Beach to Philadelphia: 1,002 (#20 most common destination from Virginia Beach)
- Net migration: 915 to Virginia Beach
- Migration from Virginia Beach to Philadelphia: 1,002 (#20 most common destination from Virginia Beach)
- Net migration: 915 to Virginia Beach

29 / 50
Smallbones // Wikimedia Commons
#22. Scranton--Wilkes-Barre--Hazleton, PA Metro Area
- Migration to Scranton in 2014-2018: 1,956
- Migration from Scranton to Philadelphia: 1,967 (#1 most common destination from Scranton)
- Net migration: 11 to Philadelphia
- Migration from Scranton to Philadelphia: 1,967 (#1 most common destination from Scranton)
- Net migration: 11 to Philadelphia

30 / 50
Smallbones // Wikicommons
#21. Vineland-Bridgeton, NJ Metro Area
- Migration to Vineland in 2014-2018: 1,991
- Migration from Vineland to Philadelphia: 2,535 (#1 most common destination from Vineland)
- Net migration: 544 to Philadelphia
- Migration from Vineland to Philadelphia: 2,535 (#1 most common destination from Vineland)
- Net migration: 544 to Philadelphia

31 / 50
Songquan Deng // Shutterstock
#20. Orlando-Kissimmee-Sanford, FL Metro Area
- Migration to Orlando in 2014-2018: 2,022
- Migration from Orlando to Philadelphia: 901 (#23 most common destination from Orlando)
- Net migration: 1,121 to Orlando
- Migration from Orlando to Philadelphia: 901 (#23 most common destination from Orlando)
- Net migration: 1,121 to Orlando

32 / 50
JoshE3 // Wikicommons
#19. Ocean City, NJ Metro Area
- Migration to Ocean City in 2014-2018: 2,243
- Migration from Ocean City to Philadelphia: 1,027 (#2 most common destination from Ocean City)
- Net migration: 1,216 to Ocean City
- Migration from Ocean City to Philadelphia: 1,027 (#2 most common destination from Ocean City)
- Net migration: 1,216 to Ocean City

33 / 50
Alvesgaspar // Wikimedia
#18. Tampa-St. Petersburg-Clearwater, FL Metro Area
- Migration to Tampa in 2014-2018: 2,512
- Migration from Tampa to Philadelphia: 995 (#22 most common destination from Tampa)
- Net migration: 1,517 to Tampa
- Migration from Tampa to Philadelphia: 995 (#22 most common destination from Tampa)
- Net migration: 1,517 to Tampa

34 / 50
Keizers // Wikimedia Commons
#17. Atlanta-Sandy Springs-Roswell, GA Metro Area
- Migration to Atlanta in 2014-2018: 2,786
- Migration from Atlanta to Philadelphia: 1,590 (#28 most common destination from Atlanta)
- Net migration: 1,196 to Atlanta
- Migration from Atlanta to Philadelphia: 1,590 (#28 most common destination from Atlanta)
- Net migration: 1,196 to Atlanta
35 / 50
Eric Fischer // Wikicommons
#16. Salisbury, MD-DE Metro Area
- Migration to Salisbury in 2014-2018: 2,835
- Migration from Salisbury to Philadelphia: 2,025 (#1 most common destination from Salisbury)
- Net migration: 810 to Salisbury
- Migration from Salisbury to Philadelphia: 2,025 (#1 most common destination from Salisbury)
- Net migration: 810 to Salisbury
36 / 50
BDS2006 // Wikimedia
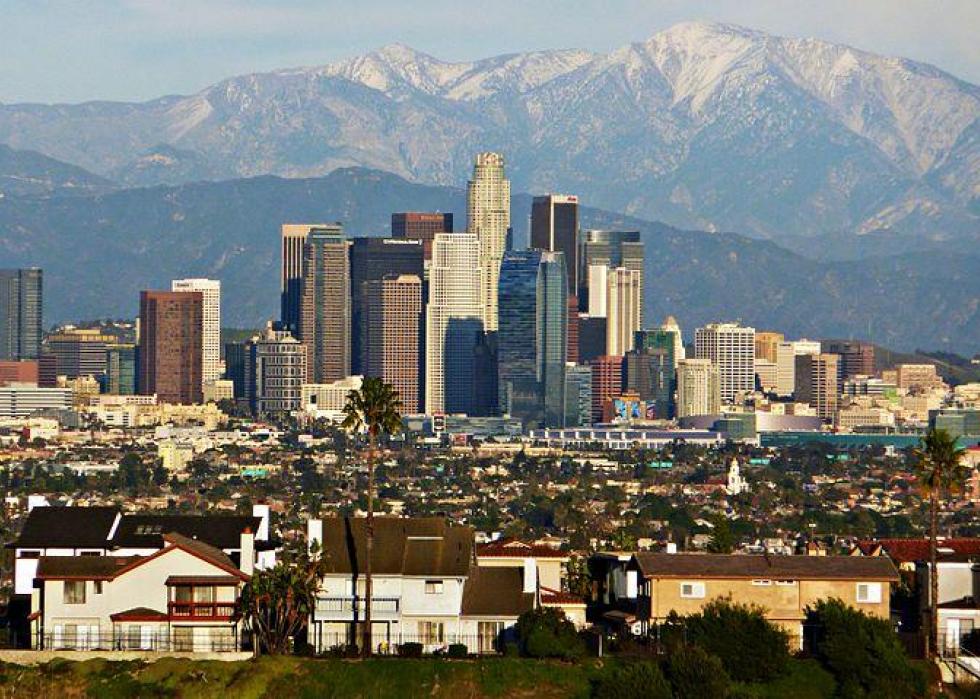
#15. Los Angeles-Long Beach-Anaheim, CA Metro Area
- Migration to Los Angeles in 2014-2018: 2,971
- Migration from Los Angeles to Philadelphia: 1,638 (#32 most common destination from Los Angeles)
- Net migration: 1,333 to Los Angeles
- Migration from Los Angeles to Philadelphia: 1,638 (#32 most common destination from Los Angeles)
- Net migration: 1,333 to Los Angeles
37 / 50
Tim Kiser // Wikicommons
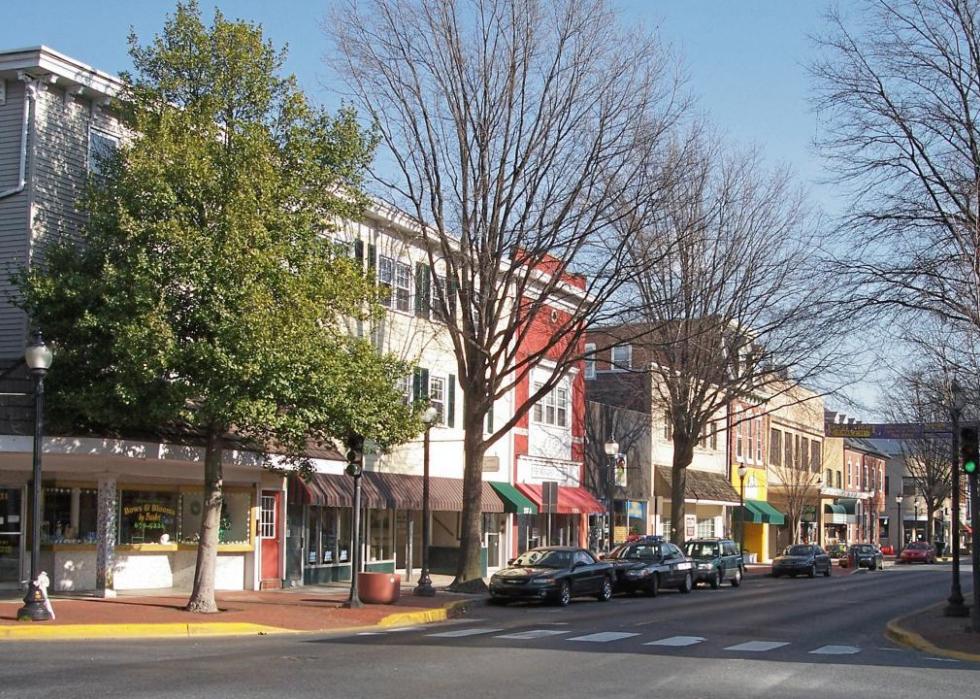
#14. Dover, DE Metro Area
- Migration to Dover in 2014-2018: 3,003
- Migration from Dover to Philadelphia: 3,066 (#1 most common destination from Dover)
- Net migration: 63 to Philadelphia
- Migration from Dover to Philadelphia: 3,066 (#1 most common destination from Dover)
- Net migration: 63 to Philadelphia

38 / 50
Wikicommons
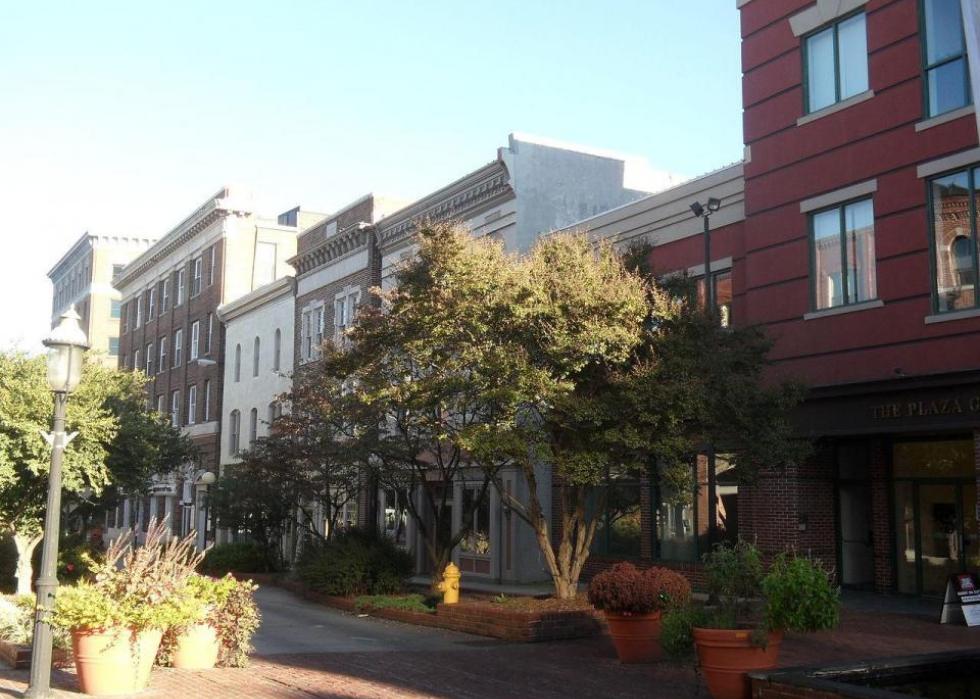
#13. State College, PA Metro Area
- Migration to State College in 2014-2018: 3,160
- Migration from State College to Philadelphia: 1,431 (#1 most common destination from State College)
- Net migration: 1,729 to State College
- Migration from State College to Philadelphia: 1,431 (#1 most common destination from State College)
- Net migration: 1,729 to State College
39 / 50
Bob Jagendorf // Wikicommons
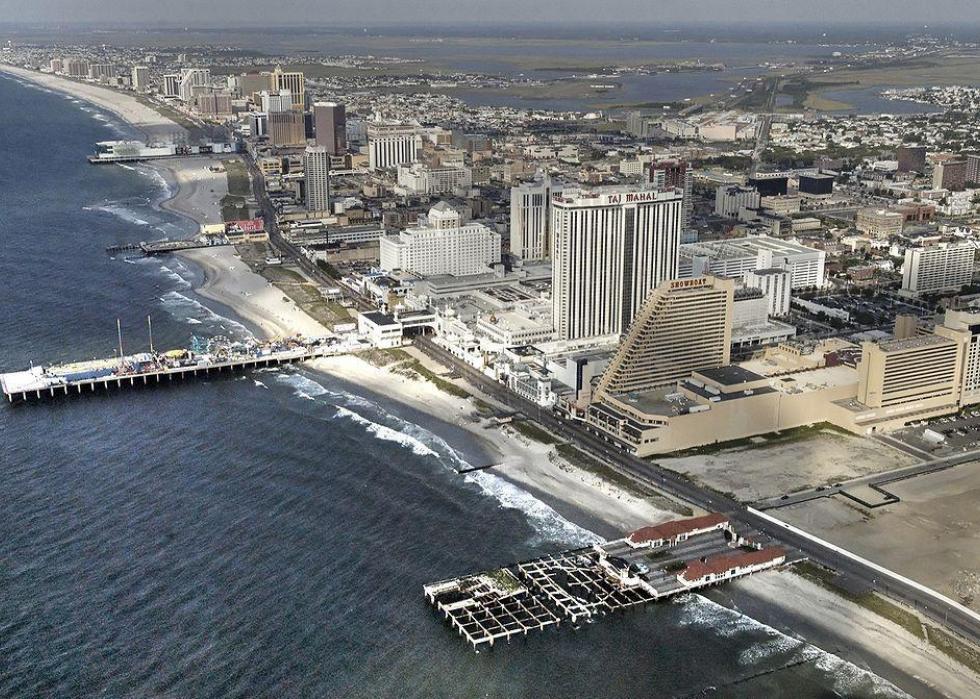
#12. Atlantic City-Hammonton, NJ Metro Area
- Migration to Atlantic City in 2014-2018: 3,241
- Migration from Atlantic City to Philadelphia: 2,764 (#2 most common destination from Atlantic City)
- Net migration: 477 to Atlantic City
- Migration from Atlantic City to Philadelphia: 2,764 (#2 most common destination from Atlantic City)
- Net migration: 477 to Atlantic City

40 / 50
Kolossos // Wikimedia Commons
#11. Miami-Fort Lauderdale-West Palm Beach, FL Metro Area
- Migration to Miami in 2014-2018: 3,269
- Migration from Miami to Philadelphia: 1,691 (#22 most common destination from Miami)
- Net migration: 1,578 to Miami
- Migration from Miami to Philadelphia: 1,691 (#22 most common destination from Miami)
- Net migration: 1,578 to Miami

41 / 50
Christopher Boswell // Shutterstock
#10. Trenton, NJ Metro Area
- Migration to Trenton in 2014-2018: 3,412
- Migration from Trenton to Philadelphia: 5,693 (#2 most common destination from Trenton)
- Net migration: 2,281 to Philadelphia
- Migration from Trenton to Philadelphia: 5,693 (#2 most common destination from Trenton)
- Net migration: 2,281 to Philadelphia

42 / 50
Smallbones // Wikimedia Commons
#9. Lancaster, PA Metro Area
- Migration to Lancaster in 2014-2018: 3,803
- Migration from Lancaster to Philadelphia: 3,177 (#1 most common destination from Lancaster)
- Net migration: 626 to Lancaster
- Migration from Lancaster to Philadelphia: 3,177 (#1 most common destination from Lancaster)
- Net migration: 626 to Lancaster

43 / 50
Sean Pavone // Shutterstock
#8. Boston-Cambridge-Newton, MA-NH Metro Area
- Migration to Boston in 2014-2018: 3,872
- Migration from Boston to Philadelphia: 2,962 (#10 most common destination from Boston)
- Net migration: 910 to Boston
- Migration from Boston to Philadelphia: 2,962 (#10 most common destination from Boston)
- Net migration: 910 to Boston

44 / 50
Rina Pitucci // Flickr
#7. Harrisburg-Carlisle, PA Metro Area
- Migration to Harrisburg in 2014-2018: 3,999
- Migration from Harrisburg to Philadelphia: 2,448 (#1 most common destination from Harrisburg)
- Net migration: 1,551 to Harrisburg
- Migration from Harrisburg to Philadelphia: 2,448 (#1 most common destination from Harrisburg)
- Net migration: 1,551 to Harrisburg

45 / 50
Famartin // Wikicommons
#6. Baltimore-Columbia-Towson, MD Metro Area
- Migration to Baltimore in 2014-2018: 4,474
- Migration from Baltimore to Philadelphia: 5,267 (#2 most common destination from Baltimore)
- Net migration: 793 to Philadelphia
- Migration from Baltimore to Philadelphia: 5,267 (#2 most common destination from Baltimore)
- Net migration: 793 to Philadelphia

46 / 50
Nicholas // Wikimedia Commons
#5. Reading, PA Metro Area
- Migration to Reading in 2014-2018: 4,568
- Migration from Reading to Philadelphia: 3,641 (#1 most common destination from Reading)
- Net migration: 927 to Reading
- Migration from Reading to Philadelphia: 3,641 (#1 most common destination from Reading)
- Net migration: 927 to Reading

47 / 50
ESB Professional // Shutterstock
#4. Pittsburgh, PA Metro Area
- Migration to Pittsburgh in 2014-2018: 4,700
- Migration from Pittsburgh to Philadelphia: 3,241 (#1 most common destination from Pittsburgh)
- Net migration: 1,459 to Pittsburgh
- Migration from Pittsburgh to Philadelphia: 3,241 (#1 most common destination from Pittsburgh)
- Net migration: 1,459 to Pittsburgh

48 / 50
Paul Leiby // Wikimedia Commons
#3. Allentown-Bethlehem-Easton, PA-NJ Metro Area
- Migration to Allentown in 2014-2018: 4,859
- Migration from Allentown to Philadelphia: 5,707 (#1 most common destination from Allentown)
- Net migration: 848 to Philadelphia
- Migration from Allentown to Philadelphia: 5,707 (#1 most common destination from Allentown)
- Net migration: 848 to Philadelphia

49 / 50
Andrew Bossi // Wikimedia
#2. Washington-Arlington-Alexandria, DC-VA-MD-WV Metro Area
- Migration to Washington in 2014-2018: 6,922
- Migration from Washington to Philadelphia: 6,002 (#5 most common destination from Washington)
- Net migration: 920 to Washington
- Migration from Washington to Philadelphia: 6,002 (#5 most common destination from Washington)
- Net migration: 920 to Washington

50 / 50
King of Hearts // Wikimedia
#1. New York-Newark-Jersey City, NY-NJ-PA Metro Area
- Migration to New York in 2014-2018: 18,328
- Migration from New York to Philadelphia: 31,621 (#1 most common destination from New York)
- Net migration: 13,293 to Philadelphia
- Migration from New York to Philadelphia: 31,621 (#1 most common destination from New York)
- Net migration: 13,293 to Philadelphia


