
Where people in San Diego are moving to most
Written by:
April 18, 2021
SD Dirk // Flickr
Where people in San Diego are moving to most
Stacker compiled a list of where people in San Diego are moving to the most using data from the U.S. Census Bureau. Metros are ranked by the estimated number of people who moved to the metro from San Diego between 2014 and 2018. Ties were broken by gross migration.
1 / 50
Aaronbrick // Wikicommons
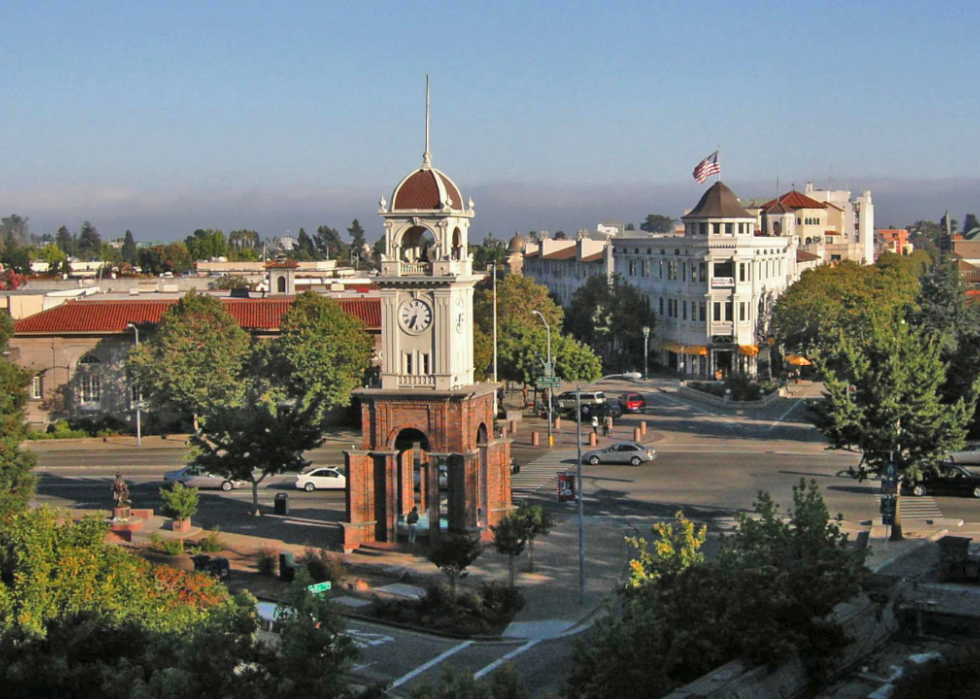
#50. Santa Cruz-Watsonville, CA Metro Area
- Migration to Santa Cruz in 2014-2018: 606
- Migration from Santa Cruz to San Diego: 311 (#8 most common destination from Santa Cruz)
- Net migration: 295 to Santa Cruz
- Migration from Santa Cruz to San Diego: 311 (#8 most common destination from Santa Cruz)
- Net migration: 295 to Santa Cruz

2 / 50
MoodyGroove // Wikimedia Commons
#49. Hilton Head Island-Bluffton-Beaufort, SC Metro Area
- Migration to Hilton Head Island in 2014-2018: 608
- Migration from Hilton Head Island to San Diego: 1,370 (#1 most common destination from Hilton Head Island)
- Net migration: 762 to San Diego
- Migration from Hilton Head Island to San Diego: 1,370 (#1 most common destination from Hilton Head Island)
- Net migration: 762 to San Diego

3 / 50
Daderot // Wikicommons
#48. Chico, CA Metro Area
- Migration to Chico in 2014-2018: 622
- Migration from Chico to San Diego: 266 (#8 most common destination from Chico)
- Net migration: 356 to Chico
- Migration from Chico to San Diego: 266 (#8 most common destination from Chico)
- Net migration: 356 to Chico

4 / 50
Noel Pennington//Flickr
#47. Memphis, TN-MS-AR Metro Area
- Migration to Memphis in 2014-2018: 639
- Migration from Memphis to San Diego: 292 (#33 most common destination from Memphis)
- Net migration: 347 to Memphis
- Migration from Memphis to San Diego: 292 (#33 most common destination from Memphis)
- Net migration: 347 to Memphis

5 / 50
Pedro Szekely // flickr
#46. New Orleans-Metairie, LA Metro Area
- Migration to New Orleans in 2014-2018: 651
- Migration from New Orleans to San Diego: 220 (#39 most common destination from New Orleans)
- Net migration: 431 to New Orleans
- Migration from New Orleans to San Diego: 220 (#39 most common destination from New Orleans)
- Net migration: 431 to New Orleans

6 / 50
Tony Webster // Wikicommons
#45. Minneapolis-St. Paul-Bloomington, MN-WI Metro Area
- Migration to Minneapolis in 2014-2018: 660
- Migration from Minneapolis to San Diego: 862 (#22 most common destination from Minneapolis)
- Net migration: 202 to San Diego
- Migration from Minneapolis to San Diego: 862 (#22 most common destination from Minneapolis)
- Net migration: 202 to San Diego

7 / 50
Derek.cashman // Wikicommons
#44. Flagstaff, AZ Metro Area
- Migration to Flagstaff in 2014-2018: 668
- Migration from Flagstaff to San Diego: 71 (#23 most common destination from Flagstaff)
- Net migration: 597 to Flagstaff
- Migration from Flagstaff to San Diego: 71 (#23 most common destination from Flagstaff)
- Net migration: 597 to Flagstaff

8 / 50
Billy Hathorn // Wikimedia
#43. Asheville, NC Metro Area
- Migration to Asheville in 2014-2018: 700
- Migration from Asheville to San Diego: 0
- Net migration: 700 to Asheville
- Migration from Asheville to San Diego: 0
- Net migration: 700 to Asheville

9 / 50
Robert Corby // Wikimedia Commons
#42. Colorado Springs, CO Metro Area
- Migration to Colorado Springs in 2014-2018: 703
- Migration from Colorado Springs to San Diego: 1,140 (#6 most common destination from Colorado Springs)
- Net migration: 437 to San Diego
- Migration from Colorado Springs to San Diego: 1,140 (#6 most common destination from Colorado Springs)
- Net migration: 437 to San Diego

10 / 50
PhotosByMahin // Pixabay
#41. Detroit-Warren-Dearborn, MI Metro Area
- Migration to Detroit in 2014-2018: 711
- Migration from Detroit to San Diego: 1,083 (#20 most common destination from Detroit)
- Net migration: 372 to San Diego
- Migration from Detroit to San Diego: 1,083 (#20 most common destination from Detroit)
- Net migration: 372 to San Diego

11 / 50
Sue Stokes // Shutterstock
#40. Bremerton-Silverdale, WA Metro Area
- Migration to Bremerton in 2014-2018: 722
- Migration from Bremerton to San Diego: 546 (#2 most common destination from Bremerton)
- Net migration: 176 to Bremerton
- Migration from Bremerton to San Diego: 546 (#2 most common destination from Bremerton)
- Net migration: 176 to Bremerton

12 / 50
Lómelinde // Wikicommons
#39. Reno, NV Metro Area
- Migration to Reno in 2014-2018: 750
- Migration from Reno to San Diego: 326 (#11 most common destination from Reno)
- Net migration: 424 to Reno
- Migration from Reno to San Diego: 326 (#11 most common destination from Reno)
- Net migration: 424 to Reno

13 / 50
Naotake Murayama // Wikicommons
#38. Salinas, CA Metro Area
- Migration to Salinas in 2014-2018: 751
- Migration from Salinas to San Diego: 651 (#8 most common destination from Salinas)
- Net migration: 100 to Salinas
- Migration from Salinas to San Diego: 651 (#8 most common destination from Salinas)
- Net migration: 100 to Salinas

14 / 50
BusinessEditorUSA // Wikimedia Commons
#37. Charlotte-Concord-Gastonia, NC-SC Metro Area
- Migration to Charlotte in 2014-2018: 790
- Migration from Charlotte to San Diego: 144 (#91 most common destination from Charlotte)
- Net migration: 646 to Charlotte
- Migration from Charlotte to San Diego: 144 (#91 most common destination from Charlotte)
- Net migration: 646 to Charlotte

15 / 50
AndrewAvitus // Wikicommons'
#36. Jacksonville, FL Metro Area
- Migration to Jacksonville in 2014-2018: 880
- Migration from Jacksonville to San Diego: 1,089 (#11 most common destination from Jacksonville)
- Net migration: 209 to San Diego
- Migration from Jacksonville to San Diego: 1,089 (#11 most common destination from Jacksonville)
- Net migration: 209 to San Diego
16 / 50
Ken Lund // Flickr
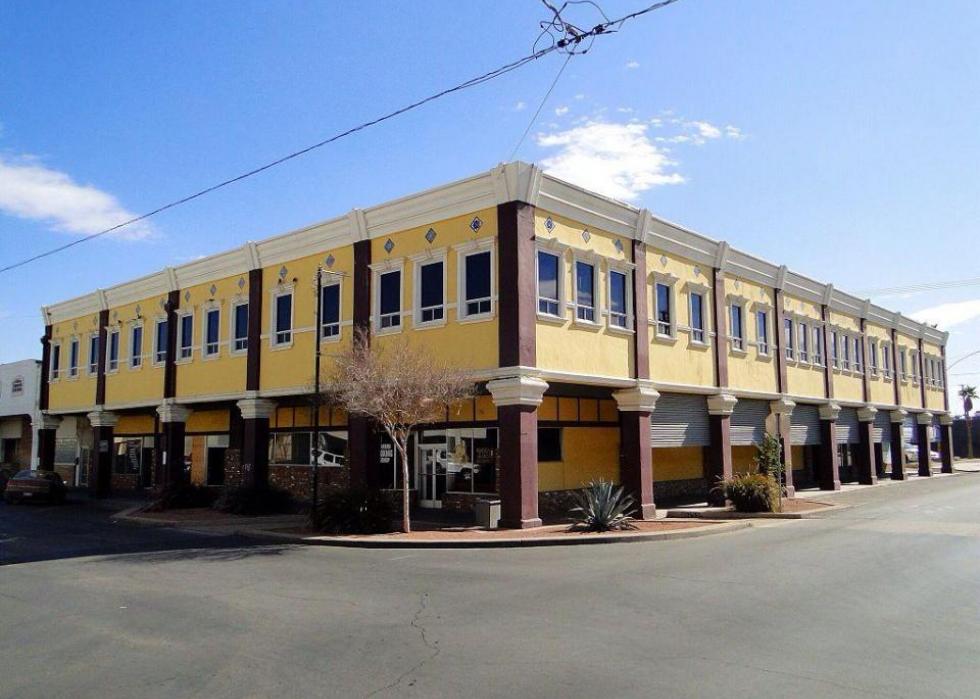
#35. Yuma, AZ Metro Area
- Migration to Yuma in 2014-2018: 888
- Migration from Yuma to San Diego: 406 (#4 most common destination from Yuma)
- Net migration: 482 to Yuma
- Migration from Yuma to San Diego: 406 (#4 most common destination from Yuma)
- Net migration: 482 to Yuma

17 / 50
Alvesgaspar // Wikimedia
#34. Tampa-St. Petersburg-Clearwater, FL Metro Area
- Migration to Tampa in 2014-2018: 915
- Migration from Tampa to San Diego: 634 (#35 most common destination from Tampa)
- Net migration: 281 to Tampa
- Migration from Tampa to San Diego: 634 (#35 most common destination from Tampa)
- Net migration: 281 to Tampa

18 / 50
Ben P L // Wikimedia Commons
#33. Provo-Orem, UT Metro Area
- Migration to Provo in 2014-2018: 939
- Migration from Provo to San Diego: 235 (#25 most common destination from Provo)
- Net migration: 704 to Provo
- Migration from Provo to San Diego: 235 (#25 most common destination from Provo)
- Net migration: 704 to Provo

19 / 50
Famartin // Wikicommons
#32. Baltimore-Columbia-Towson, MD Metro Area
- Migration to Baltimore in 2014-2018: 973
- Migration from Baltimore to San Diego: 826 (#25 most common destination from Baltimore)
- Net migration: 147 to Baltimore
- Migration from Baltimore to San Diego: 826 (#25 most common destination from Baltimore)
- Net migration: 147 to Baltimore

20 / 50
Armona // Wikicommons
#31. Hanford-Corcoran, CA Metro Area
- Migration to Hanford in 2014-2018: 987
- Migration from Hanford to San Diego: 341 (#8 most common destination from Hanford)
- Net migration: 646 to Hanford
- Migration from Hanford to San Diego: 341 (#8 most common destination from Hanford)
- Net migration: 646 to Hanford

21 / 50
Pixabay
#30. Austin-Round Rock, TX Metro Area
- Migration to Austin in 2014-2018: 995
- Migration from Austin to San Diego: 550 (#29 most common destination from Austin)
- Net migration: 445 to Austin
- Migration from Austin to San Diego: 550 (#29 most common destination from Austin)
- Net migration: 445 to Austin

22 / 50
Basar // Wikicommons
#29. San Luis Obispo-Paso Robles-Arroyo Grande, CA Metro Area
- Migration to San Luis Obispo in 2014-2018: 1,017
- Migration from San Luis Obispo to San Diego: 895 (#4 most common destination from San Luis Obispo)
- Net migration: 122 to San Luis Obispo
- Migration from San Luis Obispo to San Diego: 895 (#4 most common destination from San Luis Obispo)
- Net migration: 122 to San Luis Obispo

23 / 50
Boise Metro Chamber // Flickr
#28. Boise City, ID Metro Area
- Migration to Boise City in 2014-2018: 1,028
- Migration from Boise City to San Diego: 208 (#19 most common destination from Boise City)
- Net migration: 820 to Boise City
- Migration from Boise City to San Diego: 208 (#19 most common destination from Boise City)
- Net migration: 820 to Boise City

24 / 50
LPS.1 // Wikicommons
#27. Stockton-Lodi, CA Metro Area
- Migration to Stockton in 2014-2018: 1,101
- Migration from Stockton to San Diego: 456 (#11 most common destination from Stockton)
- Net migration: 645 to Stockton
- Migration from Stockton to San Diego: 456 (#11 most common destination from Stockton)
- Net migration: 645 to Stockton
25 / 50
Cbl62 // Wikicommons
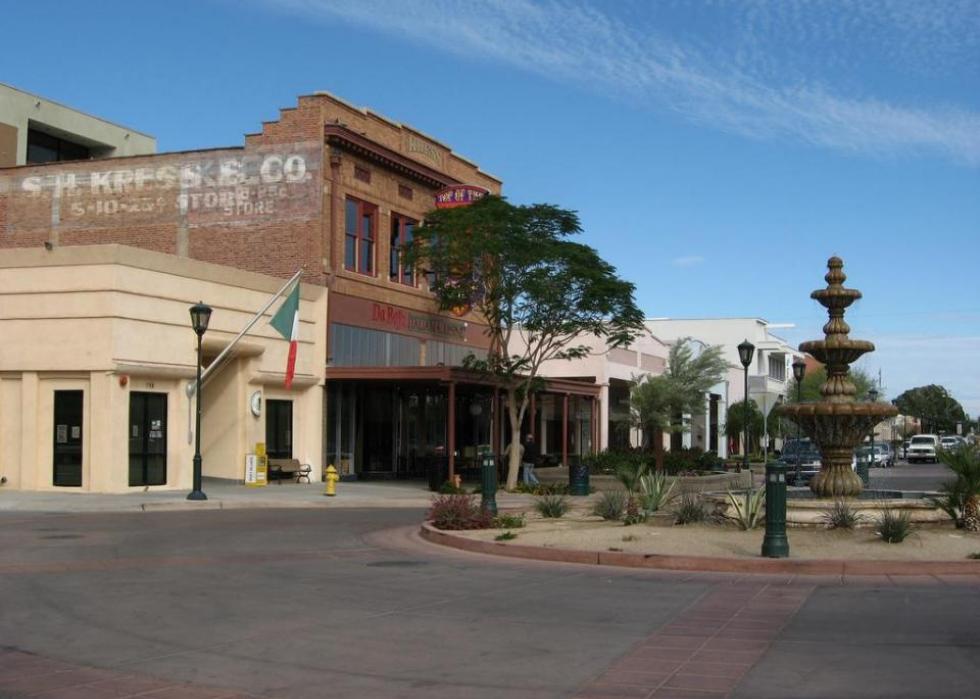
#26. El Centro, CA Metro Area
- Migration to El Centro in 2014-2018: 1,103
- Migration from El Centro to San Diego: 1,114 (#2 most common destination from El Centro)
- Net migration: 11 to San Diego
- Migration from El Centro to San Diego: 1,114 (#2 most common destination from El Centro)
- Net migration: 11 to San Diego

26 / 50
Pixabay
#25. San Antonio-New Braunfels, TX Metro Area
- Migration to San Antonio in 2014-2018: 1,114
- Migration from San Antonio to San Diego: 516 (#29 most common destination from San Antonio)
- Net migration: 598 to San Antonio
- Migration from San Antonio to San Diego: 516 (#29 most common destination from San Antonio)
- Net migration: 598 to San Antonio

27 / 50
nickchapman // Wikicommons
#24. Bakersfield, CA Metro Area
- Migration to Bakersfield in 2014-2018: 1,148
- Migration from Bakersfield to San Diego: 878 (#10 most common destination from Bakersfield)
- Net migration: 270 to Bakersfield
- Migration from Bakersfield to San Diego: 878 (#10 most common destination from Bakersfield)
- Net migration: 270 to Bakersfield

28 / 50
Jdcollins13 // Wikimedia Commons
#23. Jacksonville, NC Metro Area
- Migration to Jacksonville in 2014-2018: 1,273
- Migration from Jacksonville to San Diego: 990 (#2 most common destination from Jacksonville)
- Net migration: 283 to Jacksonville
- Migration from Jacksonville to San Diego: 990 (#2 most common destination from Jacksonville)
- Net migration: 283 to Jacksonville

29 / 50
Keizers // Wikimedia Commons
#22. Atlanta-Sandy Springs-Roswell, GA Metro Area
- Migration to Atlanta in 2014-2018: 1,382
- Migration from Atlanta to San Diego: 745 (#58 most common destination from Atlanta)
- Net migration: 637 to Atlanta
- Migration from Atlanta to San Diego: 745 (#58 most common destination from Atlanta)
- Net migration: 637 to Atlanta

30 / 50
Pixabay
#21. Santa Maria-Santa Barbara, CA Metro Area
- Migration to Santa Maria in 2014-2018: 1,455
- Migration from Santa Maria to San Diego: 797 (#7 most common destination from Santa Maria)
- Net migration: 658 to Santa Maria
- Migration from Santa Maria to San Diego: 797 (#7 most common destination from Santa Maria)
- Net migration: 658 to Santa Maria

31 / 50
Zereshk // Wikimedia
#20. Tucson, AZ Metro Area
- Migration to Tucson in 2014-2018: 1,496
- Migration from Tucson to San Diego: 1,204 (#3 most common destination from Tucson)
- Net migration: 292 to Tucson
- Migration from Tucson to San Diego: 1,204 (#3 most common destination from Tucson)
- Net migration: 292 to Tucson

32 / 50
CameronK23 // Wikimedia Commons
#19. Oxnard-Thousand Oaks-Ventura, CA Metro Area
- Migration to Oxnard in 2014-2018: 1,516
- Migration from Oxnard to San Diego: 1,053 (#6 most common destination from Oxnard)
- Net migration: 463 to Oxnard
- Migration from Oxnard to San Diego: 1,053 (#6 most common destination from Oxnard)
- Net migration: 463 to Oxnard

33 / 50
Sean Pavone // Shutterstock
#18. Boston-Cambridge-Newton, MA-NH Metro Area
- Migration to Boston in 2014-2018: 1,553
- Migration from Boston to San Diego: 1,587 (#18 most common destination from Boston)
- Net migration: 34 to San Diego
- Migration from Boston to San Diego: 1,587 (#18 most common destination from Boston)
- Net migration: 34 to San Diego

34 / 50
Edmund Garman // Flickr
#17. Urban Honolulu, HI Metro Area
- Migration to Urban Honolulu in 2014-2018: 1,662
- Migration from Urban Honolulu to San Diego: 2,245 (#4 most common destination from Urban Honolulu)
- Net migration: 583 to San Diego
- Migration from Urban Honolulu to San Diego: 2,245 (#4 most common destination from Urban Honolulu)
- Net migration: 583 to San Diego

35 / 50
f11photo // Shutterstock
#16. Denver-Aurora-Lakewood, CO Metro Area
- Migration to Denver in 2014-2018: 1,877
- Migration from Denver to San Diego: 1,471 (#15 most common destination from Denver)
- Net migration: 406 to Denver
- Migration from Denver to San Diego: 1,471 (#15 most common destination from Denver)
- Net migration: 406 to Denver

36 / 50
Christopher & Amy Esposito // Wikicommons
#15. Chicago-Naperville-Elgin, IL-IN-WI Metro Area
- Migration to Chicago in 2014-2018: 1,928
- Migration from Chicago to San Diego: 3,370 (#22 most common destination from Chicago)
- Net migration: 1,442 to San Diego
- Migration from Chicago to San Diego: 3,370 (#22 most common destination from Chicago)
- Net migration: 1,442 to San Diego

37 / 50
skeeze // Pixabay
#14. Houston-The Woodlands-Sugar Land, TX Metro Area
- Migration to Houston in 2014-2018: 1,943
- Migration from Houston to San Diego: 1,228 (#25 most common destination from Houston)
- Net migration: 715 to Houston
- Migration from Houston to San Diego: 1,228 (#25 most common destination from Houston)
- Net migration: 715 to Houston

38 / 50
Pixabay
#13. Sacramento--Roseville--Arden-Arcade, CA Metro Area
- Migration to Sacramento in 2014-2018: 2,071
- Migration from Sacramento to San Diego: 1,995 (#8 most common destination from Sacramento)
- Net migration: 76 to Sacramento
- Migration from Sacramento to San Diego: 1,995 (#8 most common destination from Sacramento)
- Net migration: 76 to Sacramento

39 / 50
Stuart Seeger // Wikicommons
#12. Portland-Vancouver-Hillsboro, OR-WA Metro Area
- Migration to Portland in 2014-2018: 2,328
- Migration from Portland to San Diego: 1,705 (#10 most common destination from Portland)
- Net migration: 623 to Portland
- Migration from Portland to San Diego: 1,705 (#10 most common destination from Portland)
- Net migration: 623 to Portland

40 / 50
King of Hearts // Wikimedia
#11. New York-Newark-Jersey City, NY-NJ-PA Metro Area
- Migration to New York in 2014-2018: 2,435
- Migration from New York to San Diego: 3,740 (#32 most common destination from New York)
- Net migration: 1,305 to San Diego
- Migration from New York to San Diego: 3,740 (#32 most common destination from New York)
- Net migration: 1,305 to San Diego

41 / 50
Don Ramey Logan // Wikicommons
#10. San Jose-Sunnyvale-Santa Clara, CA Metro Area
- Migration to San Jose in 2014-2018: 2,574
- Migration from San Jose to San Diego: 2,753 (#6 most common destination from San Jose)
- Net migration: 179 to San Diego
- Migration from San Jose to San Diego: 2,753 (#6 most common destination from San Jose)
- Net migration: 179 to San Diego

42 / 50
Sherry V Smith // Shutterstock
#9. Virginia Beach-Norfolk-Newport News, VA-NC Metro Area
- Migration to Virginia Beach in 2014-2018: 2,742
- Migration from Virginia Beach to San Diego: 2,522 (#4 most common destination from Virginia Beach)
- Net migration: 220 to Virginia Beach
- Migration from Virginia Beach to San Diego: 2,522 (#4 most common destination from Virginia Beach)
- Net migration: 220 to Virginia Beach

43 / 50
randy andy // Shutterstock
#8. Las Vegas-Henderson-Paradise, NV Metro Area
- Migration to Las Vegas in 2014-2018: 2,852
- Migration from Las Vegas to San Diego: 1,783 (#5 most common destination from Las Vegas)
- Net migration: 1,069 to Las Vegas
- Migration from Las Vegas to San Diego: 1,783 (#5 most common destination from Las Vegas)
- Net migration: 1,069 to Las Vegas
44 / 50
Public Domain
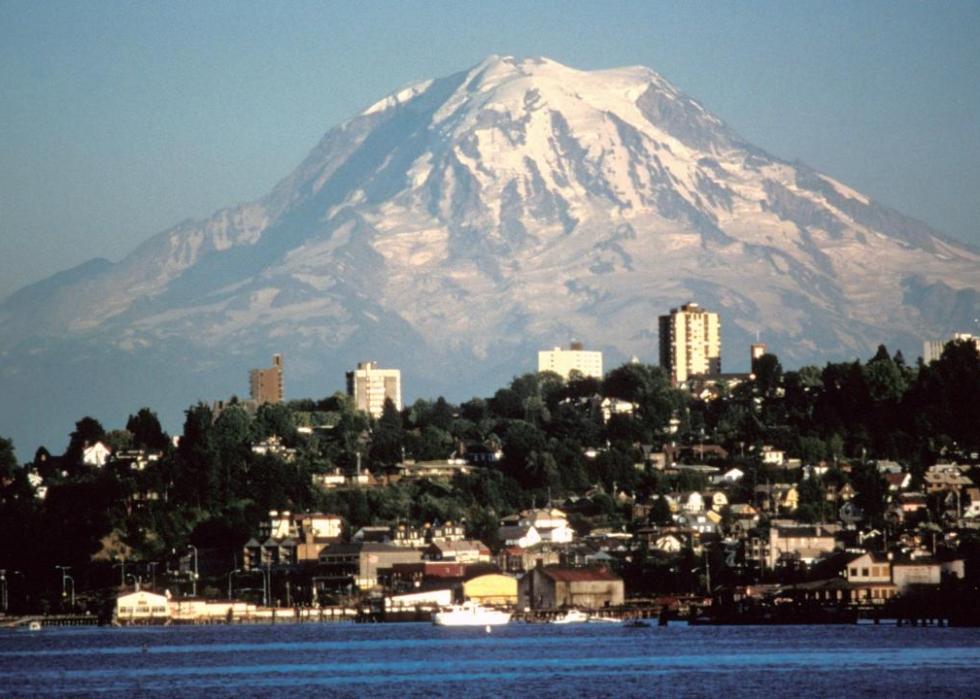
#7. Seattle-Tacoma-Bellevue, WA Metro Area
- Migration to Seattle in 2014-2018: 2,996
- Migration from Seattle to San Diego: 2,194 (#11 most common destination from Seattle)
- Net migration: 802 to Seattle
- Migration from Seattle to San Diego: 2,194 (#11 most common destination from Seattle)
- Net migration: 802 to Seattle

45 / 50
Alan Botting // Wikimedia Commons
#6. Dallas-Fort Worth-Arlington, TX Metro Area
- Migration to Dallas in 2014-2018: 3,063
- Migration from Dallas to San Diego: 1,902 (#21 most common destination from Dallas)
- Net migration: 1,161 to Dallas
- Migration from Dallas to San Diego: 1,902 (#21 most common destination from Dallas)
- Net migration: 1,161 to Dallas

46 / 50
Andrew Bossi // Wikimedia
#5. Washington-Arlington-Alexandria, DC-VA-MD-WV Metro Area
- Migration to Washington in 2014-2018: 3,689
- Migration from Washington to San Diego: 4,109 (#10 most common destination from Washington)
- Net migration: 420 to San Diego
- Migration from Washington to San Diego: 4,109 (#10 most common destination from Washington)
- Net migration: 420 to San Diego

47 / 50
DPPed// Wikimedia
#4. Phoenix-Mesa-Scottsdale, AZ Metro Area
- Migration to Phoenix in 2014-2018: 5,638
- Migration from Phoenix to San Diego: 2,976 (#10 most common destination from Phoenix)
- Net migration: 2,662 to Phoenix
- Migration from Phoenix to San Diego: 2,976 (#10 most common destination from Phoenix)
- Net migration: 2,662 to Phoenix

48 / 50
en:User:Paul.h // Wikimedia
#3. San Francisco-Oakland-Hayward, CA Metro Area
- Migration to San Francisco in 2014-2018: 6,835
- Migration from San Francisco to San Diego: 4,882 (#9 most common destination from San Francisco)
- Net migration: 1,953 to San Francisco
- Migration from San Francisco to San Diego: 4,882 (#9 most common destination from San Francisco)
- Net migration: 1,953 to San Francisco

49 / 50
BDS2006 // Wikimedia
#2. Los Angeles-Long Beach-Anaheim, CA Metro Area
- Migration to Los Angeles in 2014-2018: 15,808
- Migration from Los Angeles to San Diego: 17,009 (#3 most common destination from Los Angeles)
- Net migration: 1,201 to San Diego
- Migration from Los Angeles to San Diego: 17,009 (#3 most common destination from Los Angeles)
- Net migration: 1,201 to San Diego

50 / 50
Daniel Orth // Flickr
#1. Riverside-San Bernardino-Ontario, CA Metro Area
- Migration to Riverside in 2014-2018: 22,362
- Migration from Riverside to San Diego: 13,566 (#2 most common destination from Riverside)
- Net migration: 8,796 to Riverside
- Migration from Riverside to San Diego: 13,566 (#2 most common destination from Riverside)
- Net migration: 8,796 to Riverside


