
Where people in Tampa are moving to most
Written by:
April 18, 2021
Alvesgaspar // Wikimedia
Where people in Tampa are moving to most
Stacker compiled a list of where people in Tampa are moving to the most using data from the U.S. Census Bureau. Metros are ranked by the estimated number of people who moved to the metro from Tampa between 2014 and 2018. Ties were broken by gross migration.

1 / 50
Kevin Ruck // Shutterstock
#50. Augusta-Richmond County, GA-SC Metro Area
- Migration to Augusta in 2014-2018: 503
- Migration from Augusta to Tampa: 335 (#12 most common destination from Augusta)
- Net migration: 168 to Augusta
- Migration from Augusta to Tampa: 335 (#12 most common destination from Augusta)
- Net migration: 168 to Augusta

2 / 50
ESB Professional // Shutterstock
#49. Pittsburgh, PA Metro Area
- Migration to Pittsburgh in 2014-2018: 515
- Migration from Pittsburgh to Tampa: 1,495 (#7 most common destination from Pittsburgh)
- Net migration: 980 to Tampa
- Migration from Pittsburgh to Tampa: 1,495 (#7 most common destination from Pittsburgh)
- Net migration: 980 to Tampa

3 / 50
Grguy2011 // Wikimedia Commons
#48. Grand Rapids-Wyoming, MI Metro Area
- Migration to Grand Rapids in 2014-2018: 518
- Migration from Grand Rapids to Tampa: 291 (#16 most common destination from Grand Rapids)
- Net migration: 227 to Grand Rapids
- Migration from Grand Rapids to Tampa: 291 (#16 most common destination from Grand Rapids)
- Net migration: 227 to Grand Rapids

4 / 50
Ebyabe // Wikicommons
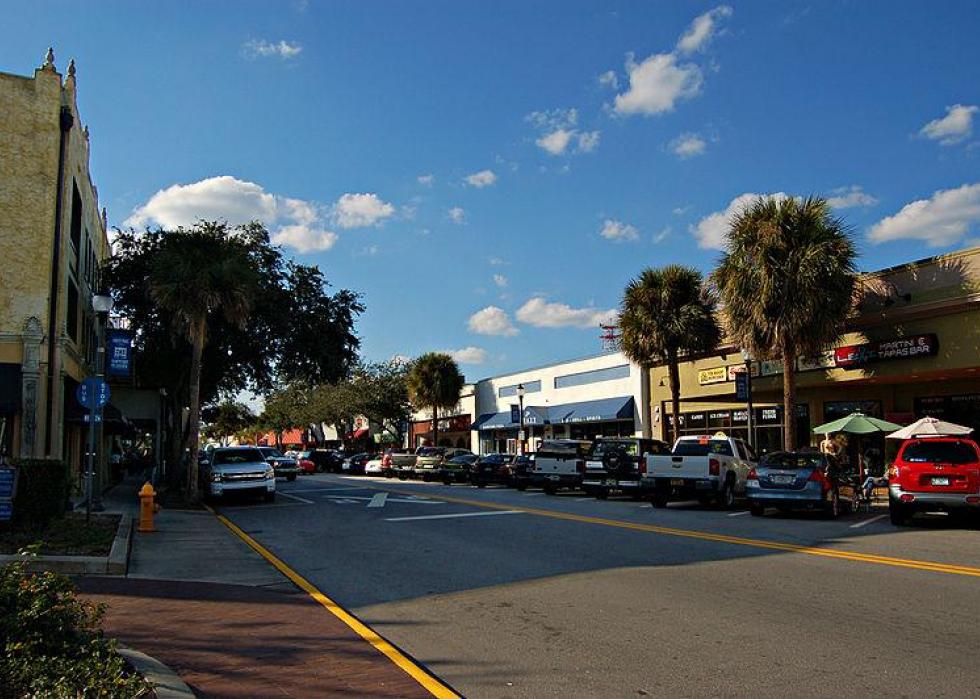
#47. Crestview-Fort Walton Beach-Destin, FL Metro Area
- Migration to Crestview in 2014-2018: 523
- Migration from Crestview to Tampa: 506 (#7 most common destination from Crestview)
- Net migration: 17 to Crestview
- Migration from Crestview to Tampa: 506 (#7 most common destination from Crestview)
- Net migration: 17 to Crestview

5 / 50
Famartin // Wikicommons
#46. Baltimore-Columbia-Towson, MD Metro Area
- Migration to Baltimore in 2014-2018: 532
- Migration from Baltimore to Tampa: 1,330 (#11 most common destination from Baltimore)
- Net migration: 798 to Tampa
- Migration from Baltimore to Tampa: 1,330 (#11 most common destination from Baltimore)
- Net migration: 798 to Tampa

6 / 50
Sean Pavone // Shutterstock
#45. St. Louis, MO-IL Metro Area
- Migration to St. Louis in 2014-2018: 551
- Migration from St. Louis to Tampa: 1,107 (#12 most common destination from St. Louis)
- Net migration: 556 to Tampa
- Migration from St. Louis to Tampa: 1,107 (#12 most common destination from St. Louis)
- Net migration: 556 to Tampa

7 / 50
Jack Pearce // Wikimedia Commons
#44. Youngstown-Warren-Boardman, OH-PA Metro Area
- Migration to Youngstown in 2014-2018: 563
- Migration from Youngstown to Tampa: 268 (#12 most common destination from Youngstown)
- Net migration: 295 to Youngstown
- Migration from Youngstown to Tampa: 268 (#12 most common destination from Youngstown)
- Net migration: 295 to Youngstown

8 / 50
spablab // Flickr
#43. Providence-Warwick, RI-MA Metro Area
- Migration to Providence in 2014-2018: 563
- Migration from Providence to Tampa: 820 (#9 most common destination from Providence)
- Net migration: 257 to Tampa
- Migration from Providence to Tampa: 820 (#9 most common destination from Providence)
- Net migration: 257 to Tampa

9 / 50
Edmund Garman // Flickr
#42. Urban Honolulu, HI Metro Area
- Migration to Urban Honolulu in 2014-2018: 580
- Migration from Urban Honolulu to Tampa: 276 (#45 most common destination from Urban Honolulu)
- Net migration: 304 to Urban Honolulu
- Migration from Urban Honolulu to Tampa: 276 (#45 most common destination from Urban Honolulu)
- Net migration: 304 to Urban Honolulu

10 / 50
en:User:Paul.h // Wikimedia
#41. San Francisco-Oakland-Hayward, CA Metro Area
- Migration to San Francisco in 2014-2018: 598
- Migration from San Francisco to Tampa: 359 (#62 most common destination from San Francisco)
- Net migration: 239 to San Francisco
- Migration from San Francisco to Tampa: 359 (#62 most common destination from San Francisco)
- Net migration: 239 to San Francisco

11 / 50
Blankfaze // Wikimedia Commons
#40. Pensacola-Ferry Pass-Brent, FL Metro Area
- Migration to Pensacola in 2014-2018: 602
- Migration from Pensacola to Tampa: 1,061 (#2 most common destination from Pensacola)
- Net migration: 459 to Tampa
- Migration from Pensacola to Tampa: 1,061 (#2 most common destination from Pensacola)
- Net migration: 459 to Tampa

12 / 50
Ebyabe // Wikicommons
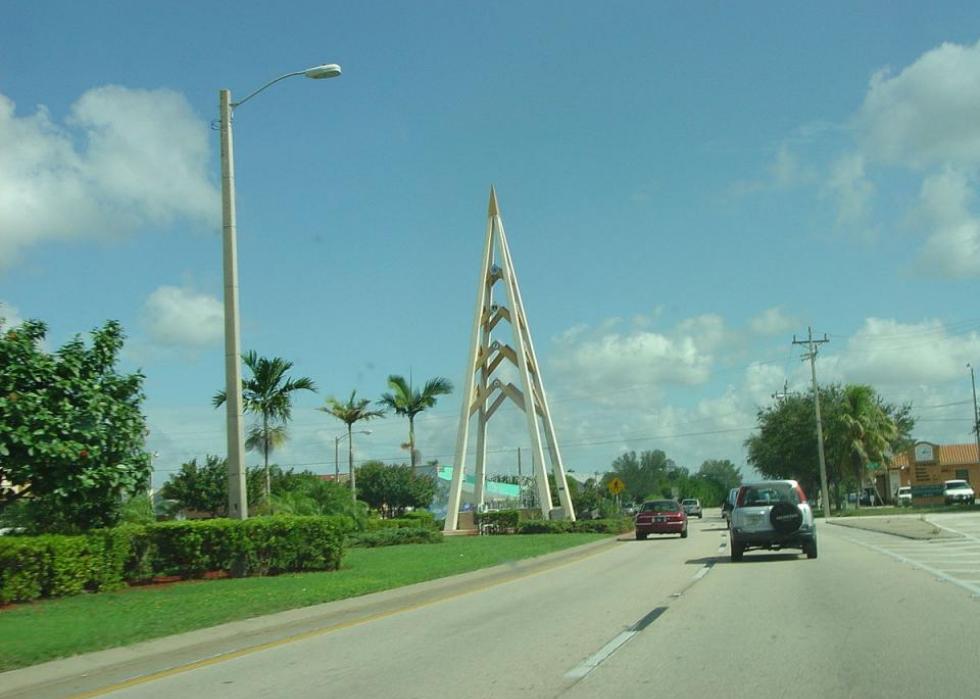
#39. Sebring, FL Metro Area
- Migration to Sebring in 2014-2018: 622
- Migration from Sebring to Tampa: 646 (#1 most common destination from Sebring)
- Net migration: 24 to Tampa
- Migration from Sebring to Tampa: 646 (#1 most common destination from Sebring)
- Net migration: 24 to Tampa

13 / 50
Ted Eytan // Wikicommons
#38. The Villages, FL Metro Area
- Migration to The Villages in 2014-2018: 623
- Migration from The Villages to Tampa: 402 (#4 most common destination from The Villages)
- Net migration: 221 to The Villages
- Migration from The Villages to Tampa: 402 (#4 most common destination from The Villages)
- Net migration: 221 to The Villages

14 / 50
Canva
#37. Cincinnati, OH-KY-IN Metro Area
- Migration to Cincinnati in 2014-2018: 629
- Migration from Cincinnati to Tampa: 880 (#11 most common destination from Cincinnati)
- Net migration: 251 to Tampa
- Migration from Cincinnati to Tampa: 880 (#11 most common destination from Cincinnati)
- Net migration: 251 to Tampa

15 / 50
Canva
#36. Cleveland-Elyria, OH Metro Area
- Migration to Cleveland in 2014-2018: 634
- Migration from Cleveland to Tampa: 652 (#18 most common destination from Cleveland)
- Net migration: 18 to Tampa
- Migration from Cleveland to Tampa: 652 (#18 most common destination from Cleveland)
- Net migration: 18 to Tampa

16 / 50
SD Dirk // Flickr
#35. San Diego-Carlsbad, CA Metro Area
- Migration to San Diego in 2014-2018: 634
- Migration from San Diego to Tampa: 915 (#34 most common destination from San Diego)
- Net migration: 281 to Tampa
- Migration from San Diego to Tampa: 915 (#34 most common destination from San Diego)
- Net migration: 281 to Tampa

17 / 50
BDS2006 // Wikimedia
#34. Los Angeles-Long Beach-Anaheim, CA Metro Area
- Migration to Los Angeles in 2014-2018: 671
- Migration from Los Angeles to Tampa: 591 (#79 most common destination from Los Angeles)
- Net migration: 80 to Los Angeles
- Migration from Los Angeles to Tampa: 591 (#79 most common destination from Los Angeles)
- Net migration: 80 to Los Angeles

18 / 50
David Wilson // Flickr
#33. Knoxville, TN Metro Area
- Migration to Knoxville in 2014-2018: 673
- Migration from Knoxville to Tampa: 366 (#14 most common destination from Knoxville)
- Net migration: 307 to Knoxville
- Migration from Knoxville to Tampa: 366 (#14 most common destination from Knoxville)
- Net migration: 307 to Knoxville

19 / 50
f11photo // Shutterstock
#32. Nashville-Davidson--Murfreesboro--Franklin, TN Metro Area
- Migration to Nashville in 2014-2018: 709
- Migration from Nashville to Tampa: 772 (#13 most common destination from Nashville)
- Net migration: 63 to Tampa
- Migration from Nashville to Tampa: 772 (#13 most common destination from Nashville)
- Net migration: 63 to Tampa

20 / 50
Ebyabe // Wikicommons
#31. Sebastian-Vero Beach, FL Metro Area
- Migration to Sebastian in 2014-2018: 763
- Migration from Sebastian to Tampa: 254 (#4 most common destination from Sebastian)
- Net migration: 509 to Sebastian
- Migration from Sebastian to Tampa: 254 (#4 most common destination from Sebastian)
- Net migration: 509 to Sebastian

21 / 50
Sean Pavone // Shutterstock
#30. Boston-Cambridge-Newton, MA-NH Metro Area
- Migration to Boston in 2014-2018: 768
- Migration from Boston to Tampa: 1,800 (#16 most common destination from Boston)
- Net migration: 1,032 to Tampa
- Migration from Boston to Tampa: 1,800 (#16 most common destination from Boston)
- Net migration: 1,032 to Tampa

22 / 50
FloridaStock // Shutterstock
#29. Naples-Immokalee-Marco Island, FL Metro Area
- Migration to Naples in 2014-2018: 775
- Migration from Naples to Tampa: 987 (#4 most common destination from Naples)
- Net migration: 212 to Tampa
- Migration from Naples to Tampa: 987 (#4 most common destination from Naples)
- Net migration: 212 to Tampa

23 / 50
Felix Mizioznikov // Shutterstock
#28. Port St. Lucie, FL Metro Area
- Migration to Port St. Lucie in 2014-2018: 785
- Migration from Port St. Lucie to Tampa: 478 (#7 most common destination from Port St. Lucie)
- Net migration: 307 to Port St. Lucie
- Migration from Port St. Lucie to Tampa: 478 (#7 most common destination from Port St. Lucie)
- Net migration: 307 to Port St. Lucie

24 / 50
Sharkshock // Shutterstock
#27. Raleigh, NC Metro Area
- Migration to Raleigh in 2014-2018: 792
- Migration from Raleigh to Tampa: 703 (#17 most common destination from Raleigh)
- Net migration: 89 to Raleigh
- Migration from Raleigh to Tampa: 703 (#17 most common destination from Raleigh)
- Net migration: 89 to Raleigh

25 / 50
randy andy // Shutterstock
#26. Las Vegas-Henderson-Paradise, NV Metro Area
- Migration to Las Vegas in 2014-2018: 804
- Migration from Las Vegas to Tampa: 272 (#53 most common destination from Las Vegas)
- Net migration: 532 to Las Vegas
- Migration from Las Vegas to Tampa: 272 (#53 most common destination from Las Vegas)
- Net migration: 532 to Las Vegas

26 / 50
PhotosByMahin // Pixabay
#25. Detroit-Warren-Dearborn, MI Metro Area
- Migration to Detroit in 2014-2018: 852
- Migration from Detroit to Tampa: 2,291 (#8 most common destination from Detroit)
- Net migration: 1,439 to Tampa
- Migration from Detroit to Tampa: 2,291 (#8 most common destination from Detroit)
- Net migration: 1,439 to Tampa

27 / 50
DPPed// Wikimedia
#24. Phoenix-Mesa-Scottsdale, AZ Metro Area
- Migration to Phoenix in 2014-2018: 869
- Migration from Phoenix to Tampa: 714 (#39 most common destination from Phoenix)
- Net migration: 155 to Phoenix
- Migration from Phoenix to Tampa: 714 (#39 most common destination from Phoenix)
- Net migration: 155 to Phoenix

28 / 50
skeeze // Pixabay
#23. Houston-The Woodlands-Sugar Land, TX Metro Area
- Migration to Houston in 2014-2018: 876
- Migration from Houston to Tampa: 918 (#33 most common destination from Houston)
- Net migration: 42 to Tampa
- Migration from Houston to Tampa: 918 (#33 most common destination from Houston)
- Net migration: 42 to Tampa

29 / 50
f11photo // Shutterstock
#22. Philadelphia-Camden-Wilmington, PA-NJ-DE-MD Metro Area
- Migration to Philadelphia in 2014-2018: 995
- Migration from Philadelphia to Tampa: 2,512 (#18 most common destination from Philadelphia)
- Net migration: 1,517 to Tampa
- Migration from Philadelphia to Tampa: 2,512 (#18 most common destination from Philadelphia)
- Net migration: 1,517 to Tampa

30 / 50
Public Domain
#21. Seattle-Tacoma-Bellevue, WA Metro Area
- Migration to Seattle in 2014-2018: 1,024
- Migration from Seattle to Tampa: 560 (#53 most common destination from Seattle)
- Net migration: 464 to Seattle
- Migration from Seattle to Tampa: 560 (#53 most common destination from Seattle)
- Net migration: 464 to Seattle

31 / 50
Sherry V Smith // Shutterstock
#20. Virginia Beach-Norfolk-Newport News, VA-NC Metro Area
- Migration to Virginia Beach in 2014-2018: 1,057
- Migration from Virginia Beach to Tampa: 1,234 (#13 most common destination from Virginia Beach)
- Net migration: 177 to Tampa
- Migration from Virginia Beach to Tampa: 1,234 (#13 most common destination from Virginia Beach)
- Net migration: 177 to Tampa
32 / 50
MicheleHaro // Wikimedia
#19. Palm Bay-Melbourne-Titusville, FL Metro Area
- Migration to Palm Bay in 2014-2018: 1,088
- Migration from Palm Bay to Tampa: 1,451 (#3 most common destination from Palm Bay)
- Net migration: 363 to Tampa
- Migration from Palm Bay to Tampa: 1,451 (#3 most common destination from Palm Bay)
- Net migration: 363 to Tampa

33 / 50
Yinan Chen // Wikimedia
#18. Deltona-Daytona Beach-Ormond Beach, FL Metro Area
- Migration to Deltona in 2014-2018: 1,151
- Migration from Deltona to Tampa: 840 (#5 most common destination from Deltona)
- Net migration: 311 to Deltona
- Migration from Deltona to Tampa: 840 (#5 most common destination from Deltona)
- Net migration: 311 to Deltona

34 / 50
Alan Botting // Wikimedia Commons
#17. Dallas-Fort Worth-Arlington, TX Metro Area
- Migration to Dallas in 2014-2018: 1,180
- Migration from Dallas to Tampa: 1,231 (#32 most common destination from Dallas)
- Net migration: 51 to Tampa
- Migration from Dallas to Tampa: 1,231 (#32 most common destination from Dallas)
- Net migration: 51 to Tampa

35 / 50
Luv24jmg // Wikimedia Commons
#16. Ocala, FL Metro Area
- Migration to Ocala in 2014-2018: 1,185
- Migration from Ocala to Tampa: 1,235 (#3 most common destination from Ocala)
- Net migration: 50 to Tampa
- Migration from Ocala to Tampa: 1,235 (#3 most common destination from Ocala)
- Net migration: 50 to Tampa

36 / 50
f11photo // Shutterstock
#15. Denver-Aurora-Lakewood, CO Metro Area
- Migration to Denver in 2014-2018: 1,218
- Migration from Denver to Tampa: 1,123 (#18 most common destination from Denver)
- Net migration: 95 to Denver
- Migration from Denver to Tampa: 1,123 (#18 most common destination from Denver)
- Net migration: 95 to Denver

37 / 50
Christopher & Amy Esposito // Wikicommons
#14. Chicago-Naperville-Elgin, IL-IN-WI Metro Area
- Migration to Chicago in 2014-2018: 1,281
- Migration from Chicago to Tampa: 3,734 (#18 most common destination from Chicago)
- Net migration: 2,453 to Tampa
- Migration from Chicago to Tampa: 3,734 (#18 most common destination from Chicago)
- Net migration: 2,453 to Tampa

38 / 50
BusinessEditorUSA // Wikimedia Commons
#13. Charlotte-Concord-Gastonia, NC-SC Metro Area
- Migration to Charlotte in 2014-2018: 1,401
- Migration from Charlotte to Tampa: 825 (#19 most common destination from Charlotte)
- Net migration: 576 to Charlotte
- Migration from Charlotte to Tampa: 825 (#19 most common destination from Charlotte)
- Net migration: 576 to Charlotte

39 / 50
AndrewAvitus // Wikicommons'
#12. Jacksonville, FL Metro Area
- Migration to Jacksonville in 2014-2018: 1,922
- Migration from Jacksonville to Tampa: 2,152 (#3 most common destination from Jacksonville)
- Net migration: 230 to Tampa
- Migration from Jacksonville to Tampa: 2,152 (#3 most common destination from Jacksonville)
- Net migration: 230 to Tampa

40 / 50
Ebyabe // Wikicommons
#11. Homosassa Springs, FL Metro Area
- Migration to Homosassa Springs in 2014-2018: 1,997
- Migration from Homosassa Springs to Tampa: 1,096 (#1 most common destination from Homosassa Springs)
- Net migration: 901 to Homosassa Springs
- Migration from Homosassa Springs to Tampa: 1,096 (#1 most common destination from Homosassa Springs)
- Net migration: 901 to Homosassa Springs
41 / 50
Sanibel Sun // WikiCommons
#10. Cape Coral-Fort Myers, FL Metro Area
- Migration to Cape Coral in 2014-2018: 2,047
- Migration from Cape Coral to Tampa: 1,400 (#5 most common destination from Cape Coral)
- Net migration: 647 to Cape Coral
- Migration from Cape Coral to Tampa: 1,400 (#5 most common destination from Cape Coral)
- Net migration: 647 to Cape Coral

42 / 50
Andrew Bossi // Wikimedia
#9. Washington-Arlington-Alexandria, DC-VA-MD-WV Metro Area
- Migration to Washington in 2014-2018: 2,457
- Migration from Washington to Tampa: 2,609 (#27 most common destination from Washington)
- Net migration: 152 to Tampa
- Migration from Washington to Tampa: 2,609 (#27 most common destination from Washington)
- Net migration: 152 to Tampa

43 / 50
Keizers // Wikimedia Commons
#8. Atlanta-Sandy Springs-Roswell, GA Metro Area
- Migration to Atlanta in 2014-2018: 2,971
- Migration from Atlanta to Tampa: 2,646 (#17 most common destination from Atlanta)
- Net migration: 325 to Atlanta
- Migration from Atlanta to Tampa: 2,646 (#17 most common destination from Atlanta)
- Net migration: 325 to Atlanta

44 / 50
User:DouglasGreen // Wikimedia
#7. Gainesville, FL Metro Area
- Migration to Gainesville in 2014-2018: 3,136
- Migration from Gainesville to Tampa: 1,684 (#3 most common destination from Gainesville)
- Net migration: 1,452 to Gainesville
- Migration from Gainesville to Tampa: 1,684 (#3 most common destination from Gainesville)
- Net migration: 1,452 to Gainesville

45 / 50
UrbanTallahassee// Wikimedia
#6. Tallahassee, FL Metro Area
- Migration to Tallahassee in 2014-2018: 3,450
- Migration from Tallahassee to Tampa: 1,495 (#4 most common destination from Tallahassee)
- Net migration: 1,955 to Tallahassee
- Migration from Tallahassee to Tampa: 1,495 (#4 most common destination from Tallahassee)
- Net migration: 1,955 to Tallahassee

46 / 50
King of Hearts // Wikimedia
#5. New York-Newark-Jersey City, NY-NJ-PA Metro Area
- Migration to New York in 2014-2018: 3,624
- Migration from New York to Tampa: 10,524 (#10 most common destination from New York)
- Net migration: 6,900 to Tampa
- Migration from New York to Tampa: 10,524 (#10 most common destination from New York)
- Net migration: 6,900 to Tampa
47 / 50
Pat McGinley // Shutterstock
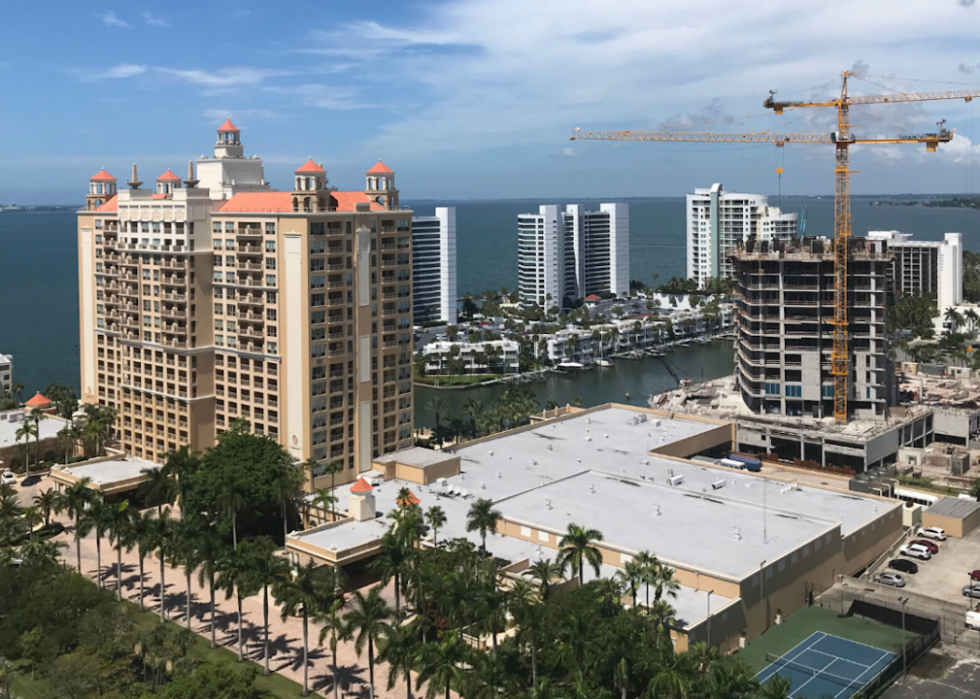
#4. North Port-Sarasota-Bradenton, FL Metro Area
- Migration to North Port in 2014-2018: 3,969
- Migration from North Port to Tampa: 3,272 (#1 most common destination from North Port)
- Net migration: 697 to North Port
- Migration from North Port to Tampa: 3,272 (#1 most common destination from North Port)
- Net migration: 697 to North Port

48 / 50
Kolossos // Wikimedia Commons
#3. Miami-Fort Lauderdale-West Palm Beach, FL Metro Area
- Migration to Miami in 2014-2018: 4,610
- Migration from Miami to Tampa: 10,097 (#3 most common destination from Miami)
- Net migration: 5,487 to Tampa
- Migration from Miami to Tampa: 10,097 (#3 most common destination from Miami)
- Net migration: 5,487 to Tampa

49 / 50
VisitCentralFL // Flickr
#2. Lakeland-Winter Haven, FL Metro Area
- Migration to Lakeland in 2014-2018: 7,148
- Migration from Lakeland to Tampa: 5,774 (#2 most common destination from Lakeland)
- Net migration: 1,374 to Lakeland
- Migration from Lakeland to Tampa: 5,774 (#2 most common destination from Lakeland)
- Net migration: 1,374 to Lakeland

50 / 50
Songquan Deng // Shutterstock
#1. Orlando-Kissimmee-Sanford, FL Metro Area
- Migration to Orlando in 2014-2018: 8,079
- Migration from Orlando to Tampa: 6,197 (#4 most common destination from Orlando)
- Net migration: 1,882 to Orlando
- Migration from Orlando to Tampa: 6,197 (#4 most common destination from Orlando)
- Net migration: 1,882 to Orlando


