
Where people in Toledo are moving to most
Written by:
April 18, 2021
Michael Shake // Shutterstock
Where people in Toledo are moving to most
Stacker compiled a list of where people in Toledo are moving to the most using data from the U.S. Census Bureau. Metros are ranked by the estimated number of people who moved to the metro from Toledo between 2014 and 2018. Ties were broken by gross migration.

1 / 50
Blankfaze // Wikimedia Commons
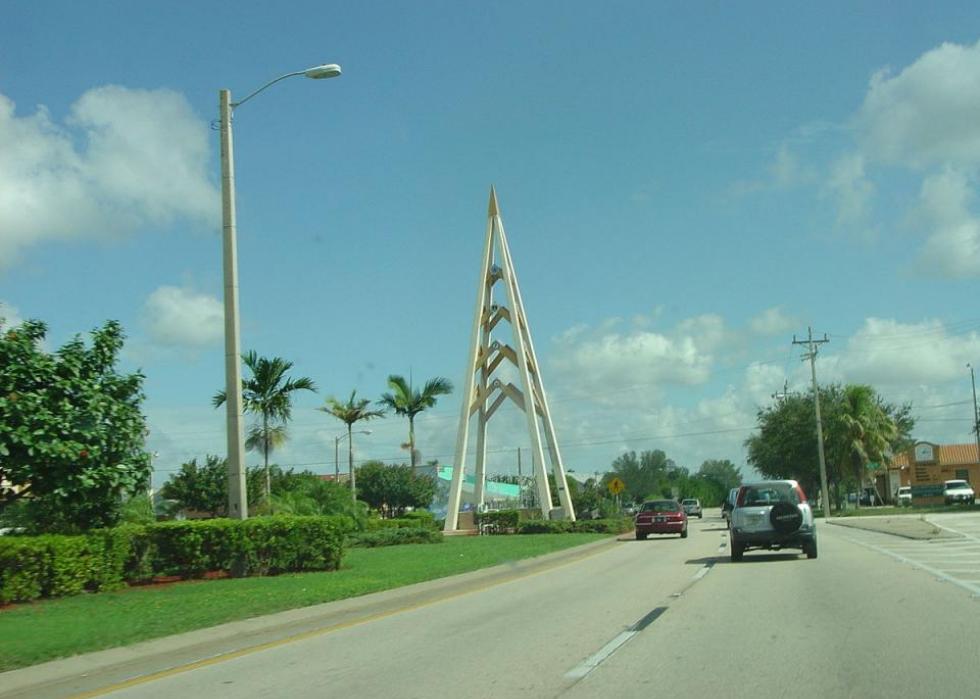
#50. Pensacola-Ferry Pass-Brent, FL Metro Area
- Migration to Pensacola in 2014-2018: 68
- Migration from Pensacola to Toledo: 0
- Net migration: 68 to Pensacola
- Migration from Pensacola to Toledo: 0
- Net migration: 68 to Pensacola

2 / 50
FloNight // Wikimedia Commons
#49. Lexington-Fayette, KY Metro Area
- Migration to Lexington in 2014-2018: 69
- Migration from Lexington to Toledo: 13 (#125 most common destination from Lexington)
- Net migration: 56 to Lexington
- Migration from Lexington to Toledo: 13 (#125 most common destination from Lexington)
- Net migration: 56 to Lexington

3 / 50
Skywalker195 // Wikimedia Commons
#48. Greenville-Anderson-Mauldin, SC Metro Area
- Migration to Greenville in 2014-2018: 71
- Migration from Greenville to Toledo: 0
- Net migration: 71 to Greenville
- Migration from Greenville to Toledo: 0
- Net migration: 71 to Greenville

4 / 50
Ron Reiring // Wikicommons
#47. Spokane-Spokane Valley, WA Metro Area
- Migration to Spokane in 2014-2018: 76
- Migration from Spokane to Toledo: 0
- Net migration: 76 to Spokane
- Migration from Spokane to Toledo: 0
- Net migration: 76 to Spokane

5 / 50
BDS2006 // Wikimedia
#46. Los Angeles-Long Beach-Anaheim, CA Metro Area
- Migration to Los Angeles in 2014-2018: 77
- Migration from Los Angeles to Toledo: 40 (#274 most common destination from Los Angeles)
- Net migration: 37 to Los Angeles
- Migration from Los Angeles to Toledo: 40 (#274 most common destination from Los Angeles)
- Net migration: 37 to Los Angeles

6 / 50
Ben P L // Wikimedia Commons
#45. Provo-Orem, UT Metro Area
- Migration to Provo in 2014-2018: 79
- Migration from Provo to Toledo: 0
- Net migration: 79 to Provo
- Migration from Provo to Toledo: 0
- Net migration: 79 to Provo

7 / 50
Quibik // Wikimedia Commons
#44. Battle Creek, MI Metro Area
- Migration to Battle Creek in 2014-2018: 83
- Migration from Battle Creek to Toledo: 7 (#60 most common destination from Battle Creek)
- Net migration: 76 to Battle Creek
- Migration from Battle Creek to Toledo: 7 (#60 most common destination from Battle Creek)
- Net migration: 76 to Battle Creek

8 / 50
Pixabay
#43. Savannah, GA Metro Area
- Migration to Savannah in 2014-2018: 83
- Migration from Savannah to Toledo: 23 (#118 most common destination from Savannah)
- Net migration: 60 to Savannah
- Migration from Savannah to Toledo: 23 (#118 most common destination from Savannah)
- Net migration: 60 to Savannah

9 / 50
Sean Pavone // Shutterstock
#42. Indianapolis-Carmel-Anderson, IN Metro Area
- Migration to Indianapolis in 2014-2018: 86
- Migration from Indianapolis to Toledo: 77 (#111 most common destination from Indianapolis)
- Net migration: 9 to Indianapolis
- Migration from Indianapolis to Toledo: 77 (#111 most common destination from Indianapolis)
- Net migration: 9 to Indianapolis

10 / 50
Citycommunications // Wikicommons
#41. Fort Collins, CO Metro Area
- Migration to Fort Collins in 2014-2018: 88
- Migration from Fort Collins to Toledo: 13 (#135 most common destination from Fort Collins)
- Net migration: 75 to Fort Collins
- Migration from Fort Collins to Toledo: 13 (#135 most common destination from Fort Collins)
- Net migration: 75 to Fort Collins

11 / 50
Joe Mabel // Wikicommons
#40. Olympia-Tumwater, WA Metro Area
- Migration to Olympia in 2014-2018: 90
- Migration from Olympia to Toledo: 0
- Net migration: 90 to Olympia
- Migration from Olympia to Toledo: 0
- Net migration: 90 to Olympia

12 / 50
Quasselkasper // Wikimedia
#39. Lawrence, KS Metro Area
- Migration to Lawrence in 2014-2018: 91
- Migration from Lawrence to Toledo: 0
- Net migration: 91 to Lawrence
- Migration from Lawrence to Toledo: 0
- Net migration: 91 to Lawrence

13 / 50
DPPed// Wikimedia
#38. Phoenix-Mesa-Scottsdale, AZ Metro Area
- Migration to Phoenix in 2014-2018: 93
- Migration from Phoenix to Toledo: 70 (#215 most common destination from Phoenix)
- Net migration: 23 to Phoenix
- Migration from Phoenix to Toledo: 70 (#215 most common destination from Phoenix)
- Net migration: 23 to Phoenix

14 / 50
Phillip L. Hofmeister // Wikimedia Commons
#37. Jackson, MI Metro Area
- Migration to Jackson in 2014-2018: 94
- Migration from Jackson to Toledo: 60 (#14 most common destination from Jackson)
- Net migration: 34 to Jackson
- Migration from Jackson to Toledo: 60 (#14 most common destination from Jackson)
- Net migration: 34 to Jackson

15 / 50
Sherry V Smith // Shutterstock
#36. Virginia Beach-Norfolk-Newport News, VA-NC Metro Area
- Migration to Virginia Beach in 2014-2018: 95
- Migration from Virginia Beach to Toledo: 6 (#278 most common destination from Virginia Beach)
- Net migration: 89 to Virginia Beach
- Migration from Virginia Beach to Toledo: 6 (#278 most common destination from Virginia Beach)
- Net migration: 89 to Virginia Beach

16 / 50
f11photo // Shutterstock
#35. Philadelphia-Camden-Wilmington, PA-NJ-DE-MD Metro Area
- Migration to Philadelphia in 2014-2018: 95
- Migration from Philadelphia to Toledo: 201 (#113 most common destination from Philadelphia)
- Net migration: 106 to Toledo
- Migration from Philadelphia to Toledo: 201 (#113 most common destination from Philadelphia)
- Net migration: 106 to Toledo
17 / 50
Sanibel Sun // WikiCommons
#34. Cape Coral-Fort Myers, FL Metro Area
- Migration to Cape Coral in 2014-2018: 97
- Migration from Cape Coral to Toledo: 0
- Net migration: 97 to Cape Coral
- Migration from Cape Coral to Toledo: 0
- Net migration: 97 to Cape Coral

18 / 50
pubdog // Wikimedia Commons
#33. Erie, PA Metro Area
- Migration to Erie in 2014-2018: 113
- Migration from Erie to Toledo: 14 (#99 most common destination from Erie)
- Net migration: 99 to Erie
- Migration from Erie to Toledo: 14 (#99 most common destination from Erie)
- Net migration: 99 to Erie

19 / 50
randy andy // Shutterstock
#32. Las Vegas-Henderson-Paradise, NV Metro Area
- Migration to Las Vegas in 2014-2018: 120
- Migration from Las Vegas to Toledo: 28 (#208 most common destination from Las Vegas)
- Net migration: 92 to Las Vegas
- Migration from Las Vegas to Toledo: 28 (#208 most common destination from Las Vegas)
- Net migration: 92 to Las Vegas

20 / 50
f11photo // Shutterstock
#31. Nashville-Davidson--Murfreesboro--Franklin, TN Metro Area
- Migration to Nashville in 2014-2018: 120
- Migration from Nashville to Toledo: 109 (#92 most common destination from Nashville)
- Net migration: 11 to Nashville
- Migration from Nashville to Toledo: 109 (#92 most common destination from Nashville)
- Net migration: 11 to Nashville

21 / 50
Stepshep // Wikimedia Commons
#30. Lima, OH Metro Area
- Migration to Lima in 2014-2018: 122
- Migration from Lima to Toledo: 244 (#3 most common destination from Lima)
- Net migration: 122 to Toledo
- Migration from Lima to Toledo: 244 (#3 most common destination from Lima)
- Net migration: 122 to Toledo

22 / 50
Yipdw // Wikicommons
#29. Terre Haute, IN Metro Area
- Migration to Terre Haute in 2014-2018: 129
- Migration from Terre Haute to Toledo: 0
- Net migration: 129 to Terre Haute
- Migration from Terre Haute to Toledo: 0
- Net migration: 129 to Terre Haute

23 / 50
Keizers // Wikimedia Commons
#28. Atlanta-Sandy Springs-Roswell, GA Metro Area
- Migration to Atlanta in 2014-2018: 134
- Migration from Atlanta to Toledo: 52 (#232 most common destination from Atlanta)
- Net migration: 82 to Atlanta
- Migration from Atlanta to Toledo: 52 (#232 most common destination from Atlanta)
- Net migration: 82 to Atlanta

24 / 50
Pat McGinley // Shutterstock
#27. North Port-Sarasota-Bradenton, FL Metro Area
- Migration to North Port in 2014-2018: 153
- Migration from North Port to Toledo: 13 (#179 most common destination from North Port)
- Net migration: 140 to North Port
- Migration from North Port to Toledo: 13 (#179 most common destination from North Port)
- Net migration: 140 to North Port

25 / 50
Ebyabe // Wikicommons
#26. Homosassa Springs, FL Metro Area
- Migration to Homosassa Springs in 2014-2018: 165
- Migration from Homosassa Springs to Toledo: 0
- Net migration: 165 to Homosassa Springs
- Migration from Homosassa Springs to Toledo: 0
- Net migration: 165 to Homosassa Springs

26 / 50
en:User:Paul.h // Wikimedia
#25. San Francisco-Oakland-Hayward, CA Metro Area
- Migration to San Francisco in 2014-2018: 173
- Migration from San Francisco to Toledo: 41 (#168 most common destination from San Francisco)
- Net migration: 132 to San Francisco
- Migration from San Francisco to Toledo: 41 (#168 most common destination from San Francisco)
- Net migration: 132 to San Francisco

27 / 50
skeeze // Pixabay
#24. Houston-The Woodlands-Sugar Land, TX Metro Area
- Migration to Houston in 2014-2018: 174
- Migration from Houston to Toledo: 148 (#141 most common destination from Houston)
- Net migration: 26 to Houston
- Migration from Houston to Toledo: 148 (#141 most common destination from Houston)
- Net migration: 26 to Houston

28 / 50
Jeffness // Wikimedia Commons
#23. Lansing-East Lansing, MI Metro Area
- Migration to Lansing in 2014-2018: 177
- Migration from Lansing to Toledo: 9 (#124 most common destination from Lansing)
- Net migration: 168 to Lansing
- Migration from Lansing to Toledo: 9 (#124 most common destination from Lansing)
- Net migration: 168 to Lansing

29 / 50
Grguy2011 // Wikimedia Commons
#22. Grand Rapids-Wyoming, MI Metro Area
- Migration to Grand Rapids in 2014-2018: 185
- Migration from Grand Rapids to Toledo: 63 (#73 most common destination from Grand Rapids)
- Net migration: 122 to Grand Rapids
- Migration from Grand Rapids to Toledo: 63 (#73 most common destination from Grand Rapids)
- Net migration: 122 to Grand Rapids

30 / 50
Andrew Bossi // Wikimedia
#21. Washington-Arlington-Alexandria, DC-VA-MD-WV Metro Area
- Migration to Washington in 2014-2018: 194
- Migration from Washington to Toledo: 217 (#150 most common destination from Washington)
- Net migration: 23 to Toledo
- Migration from Washington to Toledo: 217 (#150 most common destination from Washington)
- Net migration: 23 to Toledo

31 / 50
ESB Professional // Shutterstock
#20. Pittsburgh, PA Metro Area
- Migration to Pittsburgh in 2014-2018: 194
- Migration from Pittsburgh to Toledo: 287 (#51 most common destination from Pittsburgh)
- Net migration: 93 to Toledo
- Migration from Pittsburgh to Toledo: 287 (#51 most common destination from Pittsburgh)
- Net migration: 93 to Toledo

32 / 50
Alycat // Wikimedia Commons
#19. Canton-Massillon, OH Metro Area
- Migration to Canton in 2014-2018: 200
- Migration from Canton to Toledo: 175 (#12 most common destination from Canton)
- Net migration: 25 to Canton
- Migration from Canton to Toledo: 175 (#12 most common destination from Canton)
- Net migration: 25 to Canton

33 / 50
John Siegenthaler // Wikimedia Commons
#18. Mansfield, OH Metro Area
- Migration to Mansfield in 2014-2018: 203
- Migration from Mansfield to Toledo: 159 (#6 most common destination from Mansfield)
- Net migration: 44 to Mansfield
- Migration from Mansfield to Toledo: 159 (#6 most common destination from Mansfield)
- Net migration: 44 to Mansfield

34 / 50
Chris Watson // Wikicommons
#17. Louisville/Jefferson County, KY-IN Metro Area
- Migration to Louisville/Jefferson County in 2014-2018: 217
- Migration from Louisville/Jefferson County to Toledo: 74 (#86 most common destination from Louisville/Jefferson County)
- Net migration: 143 to Louisville/Jefferson County
- Migration from Louisville/Jefferson County to Toledo: 74 (#86 most common destination from Louisville/Jefferson County)
- Net migration: 143 to Louisville/Jefferson County

35 / 50
King of Hearts // Wikimedia
#16. New York-Newark-Jersey City, NY-NJ-PA Metro Area
- Migration to New York in 2014-2018: 217
- Migration from New York to Toledo: 439 (#126 most common destination from New York)
- Net migration: 222 to Toledo
- Migration from New York to Toledo: 439 (#126 most common destination from New York)
- Net migration: 222 to Toledo

36 / 50
Kolossos // Wikimedia Commons
#15. Miami-Fort Lauderdale-West Palm Beach, FL Metro Area
- Migration to Miami in 2014-2018: 273
- Migration from Miami to Toledo: 270 (#96 most common destination from Miami)
- Net migration: 3 to Miami
- Migration from Miami to Toledo: 270 (#96 most common destination from Miami)
- Net migration: 3 to Miami

37 / 50
Jack Pearce // Wikimedia Commons
#14. Youngstown-Warren-Boardman, OH-PA Metro Area
- Migration to Youngstown in 2014-2018: 290
- Migration from Youngstown to Toledo: 272 (#11 most common destination from Youngstown)
- Net migration: 18 to Youngstown
- Migration from Youngstown to Toledo: 272 (#11 most common destination from Youngstown)
- Net migration: 18 to Youngstown

38 / 50
AndrewAvitus // Wikicommons'
#13. Jacksonville, FL Metro Area
- Migration to Jacksonville in 2014-2018: 309
- Migration from Jacksonville to Toledo: 15 (#226 most common destination from Jacksonville)
- Net migration: 294 to Jacksonville
- Migration from Jacksonville to Toledo: 15 (#226 most common destination from Jacksonville)
- Net migration: 294 to Jacksonville

39 / 50
Alan Botting // Wikimedia Commons
#12. Dallas-Fort Worth-Arlington, TX Metro Area
- Migration to Dallas in 2014-2018: 310
- Migration from Dallas to Toledo: 99 (#182 most common destination from Dallas)
- Net migration: 211 to Dallas
- Migration from Dallas to Toledo: 99 (#182 most common destination from Dallas)
- Net migration: 211 to Dallas

40 / 50
Alvesgaspar // Wikimedia
#11. Tampa-St. Petersburg-Clearwater, FL Metro Area
- Migration to Tampa in 2014-2018: 345
- Migration from Tampa to Toledo: 28 (#234 most common destination from Tampa)
- Net migration: 317 to Tampa
- Migration from Tampa to Toledo: 28 (#234 most common destination from Tampa)
- Net migration: 317 to Tampa

41 / 50
Christopher & Amy Esposito // Wikicommons
#10. Chicago-Naperville-Elgin, IL-IN-WI Metro Area
- Migration to Chicago in 2014-2018: 380
- Migration from Chicago to Toledo: 467 (#107 most common destination from Chicago)
- Net migration: 87 to Toledo
- Migration from Chicago to Toledo: 467 (#107 most common destination from Chicago)
- Net migration: 87 to Toledo

42 / 50
Sleepydre // Wikicommons
#9. Akron, OH Metro Area
- Migration to Akron in 2014-2018: 453
- Migration from Akron to Toledo: 610 (#6 most common destination from Akron)
- Net migration: 157 to Toledo
- Migration from Akron to Toledo: 610 (#6 most common destination from Akron)
- Net migration: 157 to Toledo

43 / 50
AndrewHorne // Wikimedia Commons
#8. Ann Arbor, MI Metro Area
- Migration to Ann Arbor in 2014-2018: 488
- Migration from Ann Arbor to Toledo: 146 (#31 most common destination from Ann Arbor)
- Net migration: 342 to Ann Arbor
- Migration from Ann Arbor to Toledo: 146 (#31 most common destination from Ann Arbor)
- Net migration: 342 to Ann Arbor

44 / 50
SD Dirk // Flickr
#7. San Diego-Carlsbad, CA Metro Area
- Migration to San Diego in 2014-2018: 534
- Migration from San Diego to Toledo: 171 (#114 most common destination from San Diego)
- Net migration: 363 to San Diego
- Migration from San Diego to Toledo: 171 (#114 most common destination from San Diego)
- Net migration: 363 to San Diego

45 / 50
Tysto // Wikimedia Commons
#6. Dayton, OH Metro Area
- Migration to Dayton in 2014-2018: 733
- Migration from Dayton to Toledo: 829 (#6 most common destination from Dayton)
- Net migration: 96 to Toledo
- Migration from Dayton to Toledo: 829 (#6 most common destination from Dayton)
- Net migration: 96 to Toledo

46 / 50
PhotosByMahin // Pixabay
#5. Detroit-Warren-Dearborn, MI Metro Area
- Migration to Detroit in 2014-2018: 830
- Migration from Detroit to Toledo: 1,366 (#14 most common destination from Detroit)
- Net migration: 536 to Toledo
- Migration from Detroit to Toledo: 1,366 (#14 most common destination from Detroit)
- Net migration: 536 to Toledo

47 / 50
Canva
#4. Cincinnati, OH-KY-IN Metro Area
- Migration to Cincinnati in 2014-2018: 1,131
- Migration from Cincinnati to Toledo: 1,179 (#9 most common destination from Cincinnati)
- Net migration: 48 to Toledo
- Migration from Cincinnati to Toledo: 1,179 (#9 most common destination from Cincinnati)
- Net migration: 48 to Toledo

48 / 50
Canva
#3. Cleveland-Elyria, OH Metro Area
- Migration to Cleveland in 2014-2018: 1,219
- Migration from Cleveland to Toledo: 2,922 (#3 most common destination from Cleveland)
- Net migration: 1,703 to Toledo
- Migration from Cleveland to Toledo: 2,922 (#3 most common destination from Cleveland)
- Net migration: 1,703 to Toledo

49 / 50
Notorious4life // Wikimedia Commons
#2. Monroe, MI Metro Area
- Migration to Monroe in 2014-2018: 1,647
- Migration from Monroe to Toledo: 1,350 (#2 most common destination from Monroe)
- Net migration: 297 to Monroe
- Migration from Monroe to Toledo: 1,350 (#2 most common destination from Monroe)
- Net migration: 297 to Monroe

50 / 50
Sean Pavone // Shutterstock
#1. Columbus, OH Metro Area
- Migration to Columbus in 2014-2018: 2,685
- Migration from Columbus to Toledo: 1,660 (#4 most common destination from Columbus)
- Net migration: 1,025 to Columbus
- Migration from Columbus to Toledo: 1,660 (#4 most common destination from Columbus)
- Net migration: 1,025 to Columbus


