
Metros sending the most people to Chicago
Written by:
March 11, 2021
Christopher & Amy Esposito // Wikicommons
Metros sending the most people to Chicago
Stacker compiled a list of metros that are sending the most people to Chicago using data from the U.S. Census Bureau. Metros are ranked by the estimated number of people who moved to Chicago from the metro between 2014 and 2018. Ties were broken by gross migration.

1 / 50
Billwhittaker // Wikimedia Commons
#50. Iowa City, IA Metro Area
- Migration to Chicago from Iowa City in 2014-2018: 856 (#3 most common destination from Iowa City)
- Migration from Chicago to Iowa City: 1,748 (#41 most common destination from Chicago)
- Net migration: 892 to Iowa City
- Migration from Chicago to Iowa City: 1,748 (#41 most common destination from Chicago)
- Net migration: 892 to Iowa City

2 / 50
Grguy2011 // Wikimedia Commons
#49. Grand Rapids-Wyoming, MI Metro Area
- Migration to Chicago from Grand Rapids in 2014-2018: 904 (#6 most common destination from Grand Rapids)
- Migration from Chicago to Grand Rapids: 2,075 (#37 most common destination from Chicago)
- Net migration: 1,171 to Grand Rapids
- Migration from Chicago to Grand Rapids: 2,075 (#37 most common destination from Chicago)
- Net migration: 1,171 to Grand Rapids

3 / 50
Pixabay
#48. San Antonio-New Braunfels, TX Metro Area
- Migration to Chicago from San Antonio in 2014-2018: 947 (#12 most common destination from San Antonio)
- Migration from Chicago to San Antonio: 1,802 (#40 most common destination from Chicago)
- Net migration: 855 to San Antonio
- Migration from Chicago to San Antonio: 1,802 (#40 most common destination from Chicago)
- Net migration: 855 to San Antonio

4 / 50
Daniel Orth // Flickr
#47. Riverside-San Bernardino-Ontario, CA Metro Area
- Migration to Chicago from Riverside in 2014-2018: 962 (#22 most common destination from Riverside)
- Migration from Chicago to Riverside: 1,133 (#55 most common destination from Chicago)
- Net migration: 171 to Riverside
- Migration from Chicago to Riverside: 1,133 (#55 most common destination from Chicago)
- Net migration: 171 to Riverside

5 / 50
TommyBrison // Shutterstock
#46. Kansas City, MO-KS Metro Area
- Migration to Chicago from Kansas City in 2014-2018: 998 (#14 most common destination from Kansas City)
- Migration from Chicago to Kansas City: 1,126 (#56 most common destination from Chicago)
- Net migration: 128 to Kansas City
- Migration from Chicago to Kansas City: 1,126 (#56 most common destination from Chicago)
- Net migration: 128 to Kansas City

6 / 50
Matt Morse // Wikimedia Commons
#45. Michigan City-La Porte, IN Metro Area
- Migration to Chicago from Michigan City in 2014-2018: 1,044 (#2 most common destination from Michigan City)
- Migration from Chicago to Michigan City: 2,595 (#28 most common destination from Chicago)
- Net migration: 1,551 to Michigan City
- Migration from Chicago to Michigan City: 2,595 (#28 most common destination from Chicago)
- Net migration: 1,551 to Michigan City

7 / 50
randy andy // Shutterstock
#44. Las Vegas-Henderson-Paradise, NV Metro Area
- Migration to Chicago from Las Vegas in 2014-2018: 1,133 (#13 most common destination from Las Vegas)
- Migration from Chicago to Las Vegas: 2,441 (#30 most common destination from Chicago)
- Net migration: 1,308 to Las Vegas
- Migration from Chicago to Las Vegas: 2,441 (#30 most common destination from Chicago)
- Net migration: 1,308 to Las Vegas

8 / 50
Explorecdale // Wikimedia Commons
#43. Carbondale-Marion, IL Metro Area
- Migration to Chicago from Carbondale in 2014-2018: 1,149 (#1 most common destination from Carbondale)
- Migration from Chicago to Carbondale: 2,479 (#29 most common destination from Chicago)
- Net migration: 1,330 to Carbondale
- Migration from Chicago to Carbondale: 2,479 (#29 most common destination from Chicago)
- Net migration: 1,330 to Carbondale

9 / 50
Famartin // Wikicommons
#42. Baltimore-Columbia-Towson, MD Metro Area
- Migration to Chicago from Baltimore in 2014-2018: 1,156 (#17 most common destination from Baltimore)
- Migration from Chicago to Baltimore: 591 (#89 most common destination from Chicago)
- Net migration: 565 to Chicago
- Migration from Chicago to Baltimore: 591 (#89 most common destination from Chicago)
- Net migration: 565 to Chicago

10 / 50
Songquan Deng // Shutterstock
#41. Orlando-Kissimmee-Sanford, FL Metro Area
- Migration to Chicago from Orlando in 2014-2018: 1,170 (#20 most common destination from Orlando)
- Migration from Chicago to Orlando: 2,694 (#25 most common destination from Chicago)
- Net migration: 1,524 to Orlando
- Migration from Chicago to Orlando: 2,694 (#25 most common destination from Chicago)
- Net migration: 1,524 to Orlando

11 / 50
AndrewHorne // Wikimedia Commons
#40. Ann Arbor, MI Metro Area
- Migration to Chicago from Ann Arbor in 2014-2018: 1,229 (#2 most common destination from Ann Arbor)
- Migration from Chicago to Ann Arbor: 1,541 (#45 most common destination from Chicago)
- Net migration: 312 to Ann Arbor
- Migration from Chicago to Ann Arbor: 1,541 (#45 most common destination from Chicago)
- Net migration: 312 to Ann Arbor

12 / 50
ESB Professional // Shutterstock
#39. Pittsburgh, PA Metro Area
- Migration to Chicago from Pittsburgh in 2014-2018: 1,271 (#9 most common destination from Pittsburgh)
- Migration from Chicago to Pittsburgh: 983 (#62 most common destination from Chicago)
- Net migration: 288 to Chicago
- Migration from Chicago to Pittsburgh: 983 (#62 most common destination from Chicago)
- Net migration: 288 to Chicago

13 / 50
Alvesgaspar // Wikimedia
#38. Tampa-St. Petersburg-Clearwater, FL Metro Area
- Migration to Chicago from Tampa in 2014-2018: 1,281 (#14 most common destination from Tampa)
- Migration from Chicago to Tampa: 3,734 (#18 most common destination from Chicago)
- Net migration: 2,453 to Tampa
- Migration from Chicago to Tampa: 3,734 (#18 most common destination from Chicago)
- Net migration: 2,453 to Tampa

14 / 50
aka Kath // Flickr
#37. Springfield, IL Metro Area
- Migration to Chicago from Springfield in 2014-2018: 1,296 (#2 most common destination from Springfield)
- Migration from Chicago to Springfield: 1,484 (#49 most common destination from Chicago)
- Net migration: 188 to Springfield
- Migration from Chicago to Springfield: 1,484 (#49 most common destination from Chicago)
- Net migration: 188 to Springfield

15 / 50
Qsthomson // Wikimedia Commons
#36. Lafayette-West Lafayette, IN Metro Area
- Migration to Chicago from Lafayette in 2014-2018: 1,310 (#2 most common destination from Lafayette)
- Migration from Chicago to Lafayette: 2,632 (#27 most common destination from Chicago)
- Net migration: 1,322 to Lafayette
- Migration from Chicago to Lafayette: 2,632 (#27 most common destination from Chicago)
- Net migration: 1,322 to Lafayette

16 / 50
JamesPatrick.pro // Shutterstock
#35. Davenport-Moline-Rock Island, IA-IL Metro Area
- Migration to Chicago from Davenport in 2014-2018: 1,329 (#1 most common destination from Davenport)
- Migration from Chicago to Davenport: 2,100 (#36 most common destination from Chicago)
- Net migration: 771 to Davenport
- Migration from Chicago to Davenport: 2,100 (#36 most common destination from Chicago)
- Net migration: 771 to Davenport

17 / 50
Pixabay
#34. Austin-Round Rock, TX Metro Area
- Migration to Chicago from Austin in 2014-2018: 1,332 (#12 most common destination from Austin)
- Migration from Chicago to Austin: 2,033 (#38 most common destination from Chicago)
- Net migration: 701 to Austin
- Migration from Chicago to Austin: 2,033 (#38 most common destination from Chicago)
- Net migration: 701 to Austin

18 / 50
Sean Pavone // Shutterstock
#33. Columbus, OH Metro Area
- Migration to Chicago from Columbus in 2014-2018: 1,348 (#6 most common destination from Columbus)
- Migration from Chicago to Columbus: 2,227 (#35 most common destination from Chicago)
- Net migration: 879 to Columbus
- Migration from Chicago to Columbus: 2,227 (#35 most common destination from Chicago)
- Net migration: 879 to Columbus

19 / 50
BusinessEditorUSA // Wikimedia Commons
#32. Charlotte-Concord-Gastonia, NC-SC Metro Area
- Migration to Chicago from Charlotte in 2014-2018: 1,462 (#13 most common destination from Charlotte)
- Migration from Chicago to Charlotte: 1,504 (#47 most common destination from Chicago)
- Net migration: 42 to Charlotte
- Migration from Chicago to Charlotte: 1,504 (#47 most common destination from Chicago)
- Net migration: 42 to Charlotte

20 / 50
Henryk Sadura // Shutterstock
#31. South Bend-Mishawaka, IN-MI Metro Area
- Migration to Chicago from South Bend in 2014-2018: 1,505 (#2 most common destination from South Bend)
- Migration from Chicago to South Bend: 1,548 (#43 most common destination from Chicago)
- Net migration: 43 to South Bend
- Migration from Chicago to South Bend: 1,548 (#43 most common destination from Chicago)
- Net migration: 43 to South Bend

21 / 50
Canva
#30. Cleveland-Elyria, OH Metro Area
- Migration to Chicago from Cleveland in 2014-2018: 1,515 (#5 most common destination from Cleveland)
- Migration from Chicago to Cleveland: 1,366 (#50 most common destination from Chicago)
- Net migration: 149 to Chicago
- Migration from Chicago to Cleveland: 1,366 (#50 most common destination from Chicago)
- Net migration: 149 to Chicago

22 / 50
f11photo // Shutterstock
#29. Nashville-Davidson--Murfreesboro--Franklin, TN Metro Area
- Migration to Chicago from Nashville in 2014-2018: 1,579 (#7 most common destination from Nashville)
- Migration from Chicago to Nashville: 3,208 (#23 most common destination from Chicago)
- Net migration: 1,629 to Nashville
- Migration from Chicago to Nashville: 3,208 (#23 most common destination from Chicago)
- Net migration: 1,629 to Nashville
23 / 50
Public Domain
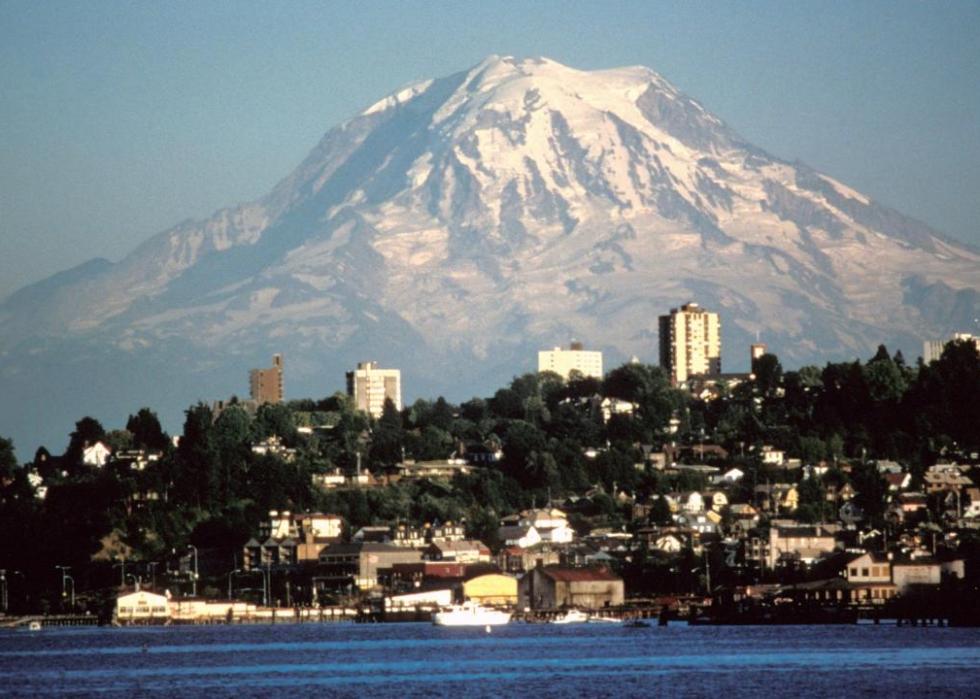
#28. Seattle-Tacoma-Bellevue, WA Metro Area
- Migration to Chicago from Seattle in 2014-2018: 1,607 (#20 most common destination from Seattle)
- Migration from Chicago to Seattle: 3,744 (#17 most common destination from Chicago)
- Net migration: 2,137 to Seattle
- Migration from Chicago to Seattle: 3,744 (#17 most common destination from Chicago)
- Net migration: 2,137 to Seattle

24 / 50
Sherry V Smith // Shutterstock
#27. Virginia Beach-Norfolk-Newport News, VA-NC Metro Area
- Migration to Chicago from Virginia Beach in 2014-2018: 1,694 (#6 most common destination from Virginia Beach)
- Migration from Chicago to Virginia Beach: 2,642 (#26 most common destination from Chicago)
- Net migration: 948 to Virginia Beach
- Migration from Chicago to Virginia Beach: 2,642 (#26 most common destination from Chicago)
- Net migration: 948 to Virginia Beach

25 / 50
f11photo // Shutterstock
#26. Denver-Aurora-Lakewood, CO Metro Area
- Migration to Chicago from Denver in 2014-2018: 1,723 (#13 most common destination from Denver)
- Migration from Chicago to Denver: 4,478 (#13 most common destination from Chicago)
- Net migration: 2,755 to Denver
- Migration from Chicago to Denver: 4,478 (#13 most common destination from Chicago)
- Net migration: 2,755 to Denver

26 / 50
f11photo // Shutterstock
#25. Philadelphia-Camden-Wilmington, PA-NJ-DE-MD Metro Area
- Migration to Chicago from Philadelphia in 2014-2018: 1,802 (#25 most common destination from Philadelphia)
- Migration from Chicago to Philadelphia: 1,547 (#44 most common destination from Chicago)
- Net migration: 255 to Chicago
- Migration from Chicago to Philadelphia: 1,547 (#44 most common destination from Chicago)
- Net migration: 255 to Chicago

27 / 50
Yahala // Wikimedia Commons
#24. Bloomington, IL Metro Area
- Migration to Chicago from Bloomington in 2014-2018: 1,847 (#1 most common destination from Bloomington)
- Migration from Chicago to Bloomington: 4,404 (#14 most common destination from Chicago)
- Net migration: 2,557 to Bloomington
- Migration from Chicago to Bloomington: 4,404 (#14 most common destination from Chicago)
- Net migration: 2,557 to Bloomington

28 / 50
SD Dirk // Flickr
#23. San Diego-Carlsbad, CA Metro Area
- Migration to Chicago from San Diego in 2014-2018: 1,928 (#15 most common destination from San Diego)
- Migration from Chicago to San Diego: 3,370 (#22 most common destination from Chicago)
- Net migration: 1,442 to San Diego
- Migration from Chicago to San Diego: 3,370 (#22 most common destination from Chicago)
- Net migration: 1,442 to San Diego

29 / 50
Michael // Wikimedia Comons
#22. Kankakee, IL Metro Area
- Migration to Chicago from Kankakee in 2014-2018: 2,048 (#1 most common destination from Kankakee)
- Migration from Chicago to Kankakee: 2,298 (#34 most common destination from Chicago)
- Net migration: 250 to Kankakee
- Migration from Chicago to Kankakee: 2,298 (#34 most common destination from Chicago)
- Net migration: 250 to Kankakee

30 / 50
Paul Brady Photography // Shutterstock
#21. Madison, WI Metro Area
- Migration to Chicago from Madison in 2014-2018: 2,098 (#2 most common destination from Madison)
- Migration from Chicago to Madison: 3,434 (#21 most common destination from Chicago)
- Net migration: 1,336 to Madison
- Migration from Chicago to Madison: 3,434 (#21 most common destination from Chicago)
- Net migration: 1,336 to Madison

31 / 50
Canva
#20. Cincinnati, OH-KY-IN Metro Area
- Migration to Chicago from Cincinnati in 2014-2018: 2,115 (#5 most common destination from Cincinnati)
- Migration from Chicago to Cincinnati: 1,983 (#39 most common destination from Chicago)
- Net migration: 132 to Chicago
- Migration from Chicago to Cincinnati: 1,983 (#39 most common destination from Chicago)
- Net migration: 132 to Chicago

32 / 50
gillfoto // Wikimedia Commons
#19. Racine, WI Metro Area
- Migration to Chicago from Racine in 2014-2018: 2,151 (#2 most common destination from Racine)
- Migration from Chicago to Racine: 2,334 (#33 most common destination from Chicago)
- Net migration: 183 to Racine
- Migration from Chicago to Racine: 2,334 (#33 most common destination from Chicago)
- Net migration: 183 to Racine

33 / 50
Robert Lawton // Wikimedia
#18. Peoria, IL Metro Area
- Migration to Chicago from Peoria in 2014-2018: 2,243 (#1 most common destination from Peoria)
- Migration from Chicago to Peoria: 1,617 (#42 most common destination from Chicago)
- Net migration: 626 to Chicago
- Migration from Chicago to Peoria: 1,617 (#42 most common destination from Chicago)
- Net migration: 626 to Chicago

34 / 50
skeeze // Pixabay
#17. Houston-The Woodlands-Sugar Land, TX Metro Area
- Migration to Chicago from Houston in 2014-2018: 2,518 (#10 most common destination from Houston)
- Migration from Chicago to Houston: 4,629 (#12 most common destination from Chicago)
- Net migration: 2,111 to Houston
- Migration from Chicago to Houston: 4,629 (#12 most common destination from Chicago)
- Net migration: 2,111 to Houston

35 / 50
Kolossos // Wikimedia Commons
#16. Miami-Fort Lauderdale-West Palm Beach, FL Metro Area
- Migration to Chicago from Miami in 2014-2018: 2,534 (#16 most common destination from Miami)
- Migration from Chicago to Miami: 3,480 (#20 most common destination from Chicago)
- Net migration: 946 to Miami
- Migration from Chicago to Miami: 3,480 (#20 most common destination from Chicago)
- Net migration: 946 to Miami

36 / 50
Alexbaumgarner // Wikimedia
#15. Rockford, IL Metro Area
- Migration to Chicago from Rockford in 2014-2018: 2,554 (#1 most common destination from Rockford)
- Migration from Chicago to Rockford: 5,983 (#8 most common destination from Chicago)
- Net migration: 3,429 to Rockford
- Migration from Chicago to Rockford: 5,983 (#8 most common destination from Chicago)
- Net migration: 3,429 to Rockford

37 / 50
Alan Botting // Wikimedia Commons
#14. Dallas-Fort Worth-Arlington, TX Metro Area
- Migration to Chicago from Dallas in 2014-2018: 2,574 (#17 most common destination from Dallas)
- Migration from Chicago to Dallas: 6,037 (#6 most common destination from Chicago)
- Net migration: 3,463 to Dallas
- Migration from Chicago to Dallas: 6,037 (#6 most common destination from Chicago)
- Net migration: 3,463 to Dallas

38 / 50
DPPed// Wikimedia
#13. Phoenix-Mesa-Scottsdale, AZ Metro Area
- Migration to Chicago from Phoenix in 2014-2018: 2,587 (#14 most common destination from Phoenix)
- Migration from Chicago to Phoenix: 7,675 (#2 most common destination from Chicago)
- Net migration: 5,088 to Phoenix
- Migration from Chicago to Phoenix: 7,675 (#2 most common destination from Chicago)
- Net migration: 5,088 to Phoenix

39 / 50
Sean Pavone // Shutterstock
#12. Boston-Cambridge-Newton, MA-NH Metro Area
- Migration to Chicago from Boston in 2014-2018: 2,677 (#13 most common destination from Boston)
- Migration from Chicago to Boston: 2,939 (#24 most common destination from Chicago)
- Net migration: 262 to Boston
- Migration from Chicago to Boston: 2,939 (#24 most common destination from Chicago)
- Net migration: 262 to Boston

40 / 50
en:User:Paul.h // Wikimedia
#11. San Francisco-Oakland-Hayward, CA Metro Area
- Migration to Chicago from San Francisco in 2014-2018: 2,865 (#18 most common destination from San Francisco)
- Migration from Chicago to San Francisco: 3,842 (#16 most common destination from Chicago)
- Net migration: 977 to San Francisco
- Migration from Chicago to San Francisco: 3,842 (#16 most common destination from Chicago)
- Net migration: 977 to San Francisco

41 / 50
PhotosByMahin // Pixabay
#10. Detroit-Warren-Dearborn, MI Metro Area
- Migration to Chicago from Detroit in 2014-2018: 2,882 (#5 most common destination from Detroit)
- Migration from Chicago to Detroit: 3,562 (#19 most common destination from Chicago)
- Net migration: 680 to Detroit
- Migration from Chicago to Detroit: 3,562 (#19 most common destination from Chicago)
- Net migration: 680 to Detroit

42 / 50
Tony Webster // Wikicommons
#9. Minneapolis-St. Paul-Bloomington, MN-WI Metro Area
- Migration to Chicago from Minneapolis in 2014-2018: 3,086 (#5 most common destination from Minneapolis)
- Migration from Chicago to Minneapolis: 6,031 (#7 most common destination from Chicago)
- Net migration: 2,945 to Minneapolis
- Migration from Chicago to Minneapolis: 6,031 (#7 most common destination from Chicago)
- Net migration: 2,945 to Minneapolis

43 / 50
Keizers // Wikimedia Commons
#8. Atlanta-Sandy Springs-Roswell, GA Metro Area
- Migration to Chicago from Atlanta in 2014-2018: 3,300 (#9 most common destination from Atlanta)
- Migration from Chicago to Atlanta: 5,323 (#11 most common destination from Chicago)
- Net migration: 2,023 to Atlanta
- Migration from Chicago to Atlanta: 5,323 (#11 most common destination from Chicago)
- Net migration: 2,023 to Atlanta

44 / 50
Andrew Bossi // Wikimedia
#7. Washington-Arlington-Alexandria, DC-VA-MD-WV Metro Area
- Migration to Chicago from Washington in 2014-2018: 3,531 (#16 most common destination from Washington)
- Migration from Chicago to Washington: 4,142 (#15 most common destination from Chicago)
- Net migration: 611 to Washington
- Migration from Chicago to Washington: 4,142 (#15 most common destination from Chicago)
- Net migration: 611 to Washington

45 / 50
Daniel Schwen // Wikimedia Commons
#6. Champaign-Urbana, IL Metro Area
- Migration to Chicago from Champaign in 2014-2018: 3,826 (#1 most common destination from Champaign)
- Migration from Chicago to Champaign: 11,042 (#1 most common destination from Chicago)
- Net migration: 7,216 to Champaign
- Migration from Chicago to Champaign: 11,042 (#1 most common destination from Chicago)
- Net migration: 7,216 to Champaign

46 / 50
Max Pixel
#5. Milwaukee-Waukesha-West Allis, WI Metro Area
- Migration to Chicago from Milwaukee in 2014-2018: 4,122 (#2 most common destination from Milwaukee)
- Migration from Chicago to Milwaukee: 7,197 (#3 most common destination from Chicago)
- Net migration: 3,075 to Milwaukee
- Migration from Chicago to Milwaukee: 7,197 (#3 most common destination from Chicago)
- Net migration: 3,075 to Milwaukee

47 / 50
Sean Pavone // Shutterstock
#4. Indianapolis-Carmel-Anderson, IN Metro Area
- Migration to Chicago from Indianapolis in 2014-2018: 4,319 (#2 most common destination from Indianapolis)
- Migration from Chicago to Indianapolis: 6,868 (#5 most common destination from Chicago)
- Net migration: 2,549 to Indianapolis
- Migration from Chicago to Indianapolis: 6,868 (#5 most common destination from Chicago)
- Net migration: 2,549 to Indianapolis

48 / 50
Sean Pavone // Shutterstock
#3. St. Louis, MO-IL Metro Area
- Migration to Chicago from St. Louis in 2014-2018: 4,479 (#1 most common destination from St. Louis)
- Migration from Chicago to St. Louis: 5,491 (#10 most common destination from Chicago)
- Net migration: 1,012 to St. Louis
- Migration from Chicago to St. Louis: 5,491 (#10 most common destination from Chicago)
- Net migration: 1,012 to St. Louis

49 / 50
BDS2006 // Wikimedia
#2. Los Angeles-Long Beach-Anaheim, CA Metro Area
- Migration to Chicago from Los Angeles in 2014-2018: 4,753 (#16 most common destination from Los Angeles)
- Migration from Chicago to Los Angeles: 6,869 (#4 most common destination from Chicago)
- Net migration: 2,116 to Los Angeles
- Migration from Chicago to Los Angeles: 6,869 (#4 most common destination from Chicago)
- Net migration: 2,116 to Los Angeles

50 / 50
King of Hearts // Wikimedia
#1. New York-Newark-Jersey City, NY-NJ-PA Metro Area
- Migration to Chicago from New York in 2014-2018: 7,432 (#15 most common destination from New York)
- Migration from Chicago to New York: 5,751 (#9 most common destination from Chicago)
- Net migration: 1,681 to Chicago
- Migration from Chicago to New York: 5,751 (#9 most common destination from Chicago)
- Net migration: 1,681 to Chicago


