
Metros sending the most people to New York
Written by:
March 11, 2021
King of Hearts // Wikimedia
Metros sending the most people to New York
Stacker compiled a list of metros that are sending the most people to New York using data from the U.S. Census Bureau. Metros are ranked by the estimated number of people who moved to New York from the metro between 2014 and 2018. Ties were broken by gross migration.

1 / 50
Jmancuso // Wikimedia Commons
#50. Utica-Rome, NY Metro Area
- Migration to New York from Utica in 2014-2018: 900 (#2 most common destination from Utica)
- Migration from New York to Utica: 2,471 (#45 most common destination from New York)
- Net migration: 1,571 to Utica
- Migration from New York to Utica: 2,471 (#45 most common destination from New York)
- Net migration: 1,571 to Utica

2 / 50
waitscm // Flickr
#49. Binghamton, NY Metro Area
- Migration to New York from Binghamton in 2014-2018: 928 (#1 most common destination from Binghamton)
- Migration from New York to Binghamton: 4,475 (#25 most common destination from New York)
- Net migration: 3,547 to Binghamton
- Migration from New York to Binghamton: 4,475 (#25 most common destination from New York)
- Net migration: 3,547 to Binghamton

3 / 50
Sean Pavone // Shutterstock
#48. St. Louis, MO-IL Metro Area
- Migration to New York from St. Louis in 2014-2018: 958 (#16 most common destination from St. Louis)
- Migration from New York to St. Louis: 1,901 (#58 most common destination from New York)
- Net migration: 943 to St. Louis
- Migration from New York to St. Louis: 1,901 (#58 most common destination from New York)
- Net migration: 943 to St. Louis

4 / 50
Ron Cogswell//Wikicommons
#47. Richmond, VA Metro Area
- Migration to New York from Richmond in 2014-2018: 975 (#6 most common destination from Richmond)
- Migration from New York to Richmond: 3,118 (#38 most common destination from New York)
- Net migration: 2,143 to Richmond
- Migration from New York to Richmond: 3,118 (#38 most common destination from New York)
- Net migration: 2,143 to Richmond

5 / 50
John Phelan // Wikimedia
#46. Worcester, MA-CT Metro Area
- Migration to New York from Worcester in 2014-2018: 983 (#6 most common destination from Worcester)
- Migration from New York to Worcester: 1,365 (#70 most common destination from New York)
- Net migration: 382 to Worcester
- Migration from New York to Worcester: 1,365 (#70 most common destination from New York)
- Net migration: 382 to Worcester

6 / 50
f11photo // Shutterstock
#45. Nashville-Davidson--Murfreesboro--Franklin, TN Metro Area
- Migration to New York from Nashville in 2014-2018: 1,047 (#10 most common destination from Nashville)
- Migration from New York to Nashville: 1,833 (#59 most common destination from New York)
- Net migration: 786 to Nashville
- Migration from New York to Nashville: 1,833 (#59 most common destination from New York)
- Net migration: 786 to Nashville

7 / 50
Pixabay
#44. Sacramento--Roseville--Arden-Arcade, CA Metro Area
- Migration to New York from Sacramento in 2014-2018: 1,069 (#18 most common destination from Sacramento)
- Migration from New York to Sacramento: 1,317 (#73 most common destination from New York)
- Net migration: 248 to Sacramento
- Migration from New York to Sacramento: 1,317 (#73 most common destination from New York)
- Net migration: 248 to Sacramento

8 / 50
Canva
#43. Cleveland-Elyria, OH Metro Area
- Migration to New York from Cleveland in 2014-2018: 1,095 (#11 most common destination from Cleveland)
- Migration from New York to Cleveland: 1,534 (#66 most common destination from New York)
- Net migration: 439 to Cleveland
- Migration from New York to Cleveland: 1,534 (#66 most common destination from New York)
- Net migration: 439 to Cleveland

9 / 50
Stuart Seeger // Wikicommons
#42. Portland-Vancouver-Hillsboro, OR-WA Metro Area
- Migration to New York from Portland in 2014-2018: 1,134 (#15 most common destination from Portland)
- Migration from New York to Portland: 2,277 (#49 most common destination from New York)
- Net migration: 1,143 to Portland
- Migration from New York to Portland: 2,277 (#49 most common destination from New York)
- Net migration: 1,143 to Portland

10 / 50
Atlpedia// Wikimedia
#41. Durham-Chapel Hill, NC Metro Area
- Migration to New York from Durham in 2014-2018: 1,181 (#6 most common destination from Durham)
- Migration from New York to Durham: 2,740 (#40 most common destination from New York)
- Net migration: 1,559 to Durham
- Migration from New York to Durham: 2,740 (#40 most common destination from New York)
- Net migration: 1,559 to Durham

11 / 50
f11photo // Shutterstock
#40. Denver-Aurora-Lakewood, CO Metro Area
- Migration to New York from Denver in 2014-2018: 1,245 (#16 most common destination from Denver)
- Migration from New York to Denver: 3,721 (#33 most common destination from New York)
- Net migration: 2,476 to Denver
- Migration from New York to Denver: 3,721 (#33 most common destination from New York)
- Net migration: 2,476 to Denver

12 / 50
Sean Pavone // Shutterstock
#39. Columbus, OH Metro Area
- Migration to New York from Columbus in 2014-2018: 1,275 (#7 most common destination from Columbus)
- Migration from New York to Columbus: 2,654 (#42 most common destination from New York)
- Net migration: 1,379 to Columbus
- Migration from New York to Columbus: 2,654 (#42 most common destination from New York)
- Net migration: 1,379 to Columbus

13 / 50
Pixabay
#38. Austin-Round Rock, TX Metro Area
- Migration to New York from Austin in 2014-2018: 1,408 (#11 most common destination from Austin)
- Migration from New York to Austin: 3,870 (#31 most common destination from New York)
- Net migration: 2,462 to Austin
- Migration from New York to Austin: 3,870 (#31 most common destination from New York)
- Net migration: 2,462 to Austin

14 / 50
PhotosByMahin // Pixabay
#37. Detroit-Warren-Dearborn, MI Metro Area
- Migration to New York from Detroit in 2014-2018: 1,444 (#12 most common destination from Detroit)
- Migration from New York to Detroit: 2,360 (#48 most common destination from New York)
- Net migration: 916 to Detroit
- Migration from New York to Detroit: 2,360 (#48 most common destination from New York)
- Net migration: 916 to Detroit

15 / 50
Smallbones // Wikicommons
#36. Vineland-Bridgeton, NJ Metro Area
- Migration to New York from Vineland in 2014-2018: 1,481 (#2 most common destination from Vineland)
- Migration from New York to Vineland: 1,917 (#55 most common destination from New York)
- Net migration: 436 to Vineland
- Migration from New York to Vineland: 1,917 (#55 most common destination from New York)
- Net migration: 436 to Vineland

16 / 50
Lewis Liu // Shutterstock
#35. Ithaca, NY Metro Area
- Migration to New York from Ithaca in 2014-2018: 1,515 (#1 most common destination from Ithaca)
- Migration from New York to Ithaca: 3,062 (#39 most common destination from New York)
- Net migration: 1,547 to Ithaca
- Migration from New York to Ithaca: 3,062 (#39 most common destination from New York)
- Net migration: 1,547 to Ithaca

17 / 50
Sharkshock // Shutterstock
#34. Raleigh, NC Metro Area
- Migration to New York from Raleigh in 2014-2018: 1,579 (#6 most common destination from Raleigh)
- Migration from New York to Raleigh: 4,121 (#29 most common destination from New York)
- Net migration: 2,542 to Raleigh
- Migration from New York to Raleigh: 4,121 (#29 most common destination from New York)
- Net migration: 2,542 to Raleigh

18 / 50
spablab // Flickr
#33. Providence-Warwick, RI-MA Metro Area
- Migration to New York from Providence in 2014-2018: 1,746 (#3 most common destination from Providence)
- Migration from New York to Providence: 3,670 (#34 most common destination from New York)
- Net migration: 1,924 to Providence
- Migration from New York to Providence: 3,670 (#34 most common destination from New York)
- Net migration: 1,924 to Providence
19 / 50
Doug Kerr // Wikicommons
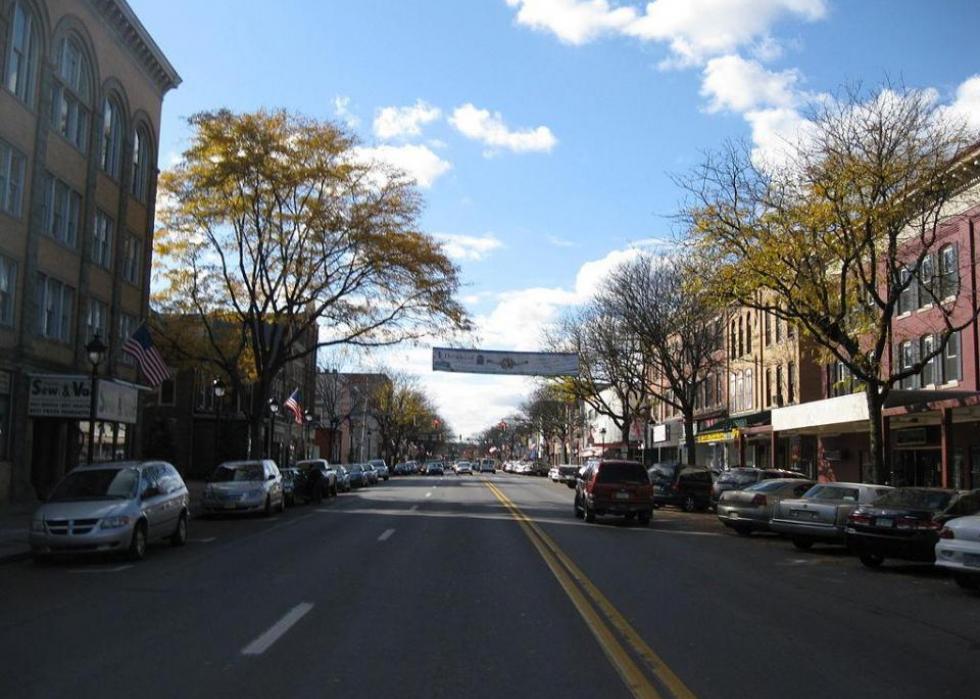
#32. East Stroudsburg, PA Metro Area
- Migration to New York from East Stroudsburg in 2014-2018: 1,768 (#1 most common destination from East Stroudsburg)
- Migration from New York to East Stroudsburg: 3,571 (#35 most common destination from New York)
- Net migration: 1,803 to East Stroudsburg
- Migration from New York to East Stroudsburg: 3,571 (#35 most common destination from New York)
- Net migration: 1,803 to East Stroudsburg

20 / 50
Sherry V Smith // Shutterstock
#31. Virginia Beach-Norfolk-Newport News, VA-NC Metro Area
- Migration to New York from Virginia Beach in 2014-2018: 1,773 (#5 most common destination from Virginia Beach)
- Migration from New York to Virginia Beach: 4,059 (#30 most common destination from New York)
- Net migration: 2,286 to Virginia Beach
- Migration from New York to Virginia Beach: 4,059 (#30 most common destination from New York)
- Net migration: 2,286 to Virginia Beach

21 / 50
Don Ramey Logan // Wikicommons
#30. San Jose-Sunnyvale-Santa Clara, CA Metro Area
- Migration to New York from San Jose in 2014-2018: 1,834 (#10 most common destination from San Jose)
- Migration from New York to San Jose: 3,442 (#36 most common destination from New York)
- Net migration: 1,608 to San Jose
- Migration from New York to San Jose: 3,442 (#36 most common destination from New York)
- Net migration: 1,608 to San Jose

22 / 50
ESB Professional // Shutterstock
#29. Pittsburgh, PA Metro Area
- Migration to New York from Pittsburgh in 2014-2018: 1,891 (#5 most common destination from Pittsburgh)
- Migration from New York to Pittsburgh: 3,249 (#37 most common destination from New York)
- Net migration: 1,358 to Pittsburgh
- Migration from New York to Pittsburgh: 3,249 (#37 most common destination from New York)
- Net migration: 1,358 to Pittsburgh

23 / 50
BusinessEditorUSA // Wikimedia Commons
#28. Charlotte-Concord-Gastonia, NC-SC Metro Area
- Migration to New York from Charlotte in 2014-2018: 2,141 (#8 most common destination from Charlotte)
- Migration from New York to Charlotte: 8,674 (#14 most common destination from New York)
- Net migration: 6,533 to Charlotte
- Migration from New York to Charlotte: 8,674 (#14 most common destination from New York)
- Net migration: 6,533 to Charlotte

24 / 50
John Phelan // Wikimedia
#27. Hartford-West Hartford-East Hartford, CT Metro Area
- Migration to New York from Hartford in 2014-2018: 2,284 (#4 most common destination from Hartford)
- Migration from New York to Hartford: 4,135 (#28 most common destination from New York)
- Net migration: 1,851 to Hartford
- Migration from New York to Hartford: 4,135 (#28 most common destination from New York)
- Net migration: 1,851 to Hartford

25 / 50
SD Dirk // Flickr
#26. San Diego-Carlsbad, CA Metro Area
- Migration to New York from San Diego in 2014-2018: 2,435 (#11 most common destination from San Diego)
- Migration from New York to San Diego: 3,740 (#32 most common destination from New York)
- Net migration: 1,305 to San Diego
- Migration from New York to San Diego: 3,740 (#32 most common destination from New York)
- Net migration: 1,305 to San Diego

26 / 50
skeeze // Pixabay
#25. Houston-The Woodlands-Sugar Land, TX Metro Area
- Migration to New York from Houston in 2014-2018: 2,544 (#9 most common destination from Houston)
- Migration from New York to Houston: 6,251 (#19 most common destination from New York)
- Net migration: 3,707 to Houston
- Migration from New York to Houston: 6,251 (#19 most common destination from New York)
- Net migration: 3,707 to Houston

27 / 50
DPPed// Wikimedia
#24. Phoenix-Mesa-Scottsdale, AZ Metro Area
- Migration to New York from Phoenix in 2014-2018: 2,690 (#12 most common destination from Phoenix)
- Migration from New York to Phoenix: 4,391 (#27 most common destination from New York)
- Net migration: 1,701 to Phoenix
- Migration from New York to Phoenix: 4,391 (#27 most common destination from New York)
- Net migration: 1,701 to Phoenix
28 / 50
Daniel Case // Wikicommons
#23. Kingston, NY Metro Area
- Migration to New York from Kingston in 2014-2018: 2,905 (#1 most common destination from Kingston)
- Migration from New York to Kingston: 4,613 (#24 most common destination from New York)
- Net migration: 1,708 to Kingston
- Migration from New York to Kingston: 4,613 (#24 most common destination from New York)
- Net migration: 1,708 to Kingston

29 / 50
Public Domain
#22. Seattle-Tacoma-Bellevue, WA Metro Area
- Migration to New York from Seattle in 2014-2018: 2,953 (#9 most common destination from Seattle)
- Migration from New York to Seattle: 5,112 (#22 most common destination from New York)
- Net migration: 2,159 to Seattle
- Migration from New York to Seattle: 5,112 (#22 most common destination from New York)
- Net migration: 2,159 to Seattle

30 / 50
Stephen Zimmermann // Wikimedia Commons
#21. Buffalo-Cheektowaga-Niagara Falls, NY Metro Area
- Migration to New York from Buffalo in 2014-2018: 2,980 (#2 most common destination from Buffalo)
- Migration from New York to Buffalo: 6,772 (#17 most common destination from New York)
- Net migration: 3,792 to Buffalo
- Migration from New York to Buffalo: 6,772 (#17 most common destination from New York)
- Net migration: 3,792 to Buffalo

31 / 50
Bob Jagendorf // Wikicommons
#20. Atlantic City-Hammonton, NJ Metro Area
- Migration to New York from Atlantic City in 2014-2018: 3,042 (#1 most common destination from Atlantic City)
- Migration from New York to Atlantic City: 2,247 (#50 most common destination from New York)
- Net migration: 795 to New York
- Migration from New York to Atlantic City: 2,247 (#50 most common destination from New York)
- Net migration: 795 to New York

32 / 50
Songquan Deng // Shutterstock
#19. Orlando-Kissimmee-Sanford, FL Metro Area
- Migration to New York from Orlando in 2014-2018: 3,210 (#6 most common destination from Orlando)
- Migration from New York to Orlando: 10,378 (#11 most common destination from New York)
- Net migration: 7,168 to Orlando
- Migration from New York to Orlando: 10,378 (#11 most common destination from New York)
- Net migration: 7,168 to Orlando

33 / 50
John Phelan // Wikimedia Commons
#18. New Haven-Milford, CT Metro Area
- Migration to New York from New Haven in 2014-2018: 3,246 (#3 most common destination from New Haven)
- Migration from New York to New Haven: 4,440 (#26 most common destination from New York)
- Net migration: 1,194 to New Haven
- Migration from New York to New Haven: 4,440 (#26 most common destination from New York)
- Net migration: 1,194 to New Haven

34 / 50
Doug Kerr // Wikimedia Commons
#17. Syracuse, NY Metro Area
- Migration to New York from Syracuse in 2014-2018: 3,376 (#1 most common destination from Syracuse)
- Migration from New York to Syracuse: 5,641 (#21 most common destination from New York)
- Net migration: 2,265 to Syracuse
- Migration from New York to Syracuse: 5,641 (#21 most common destination from New York)
- Net migration: 2,265 to Syracuse

35 / 50
Alan Botting // Wikimedia Commons
#16. Dallas-Fort Worth-Arlington, TX Metro Area
- Migration to New York from Dallas in 2014-2018: 3,471 (#10 most common destination from Dallas)
- Migration from New York to Dallas: 6,868 (#16 most common destination from New York)
- Net migration: 3,397 to Dallas
- Migration from New York to Dallas: 6,868 (#16 most common destination from New York)
- Net migration: 3,397 to Dallas

36 / 50
Alvesgaspar // Wikimedia
#15. Tampa-St. Petersburg-Clearwater, FL Metro Area
- Migration to New York from Tampa in 2014-2018: 3,624 (#5 most common destination from Tampa)
- Migration from New York to Tampa: 10,524 (#10 most common destination from New York)
- Net migration: 6,900 to Tampa
- Migration from New York to Tampa: 10,524 (#10 most common destination from New York)
- Net migration: 6,900 to Tampa

37 / 50
Paul Leiby // Wikimedia Commons
#14. Allentown-Bethlehem-Easton, PA-NJ Metro Area
- Migration to New York from Allentown in 2014-2018: 3,761 (#2 most common destination from Allentown)
- Migration from New York to Allentown: 10,703 (#9 most common destination from New York)
- Net migration: 6,942 to Allentown
- Migration from New York to Allentown: 10,703 (#9 most common destination from New York)
- Net migration: 6,942 to Allentown

38 / 50
Famartin // Wikicommons
#13. Baltimore-Columbia-Towson, MD Metro Area
- Migration to New York from Baltimore in 2014-2018: 3,824 (#4 most common destination from Baltimore)
- Migration from New York to Baltimore: 6,717 (#18 most common destination from New York)
- Net migration: 2,893 to Baltimore
- Migration from New York to Baltimore: 6,717 (#18 most common destination from New York)
- Net migration: 2,893 to Baltimore

39 / 50
Keizers // Wikimedia Commons
#12. Atlanta-Sandy Springs-Roswell, GA Metro Area
- Migration to New York from Atlanta in 2014-2018: 4,725 (#2 most common destination from Atlanta)
- Migration from New York to Atlanta: 12,320 (#7 most common destination from New York)
- Net migration: 7,595 to Atlanta
- Migration from New York to Atlanta: 12,320 (#7 most common destination from New York)
- Net migration: 7,595 to Atlanta

40 / 50
Wangkun Jia // Shutterstock
#11. Albany-Schenectady-Troy, NY Metro Area
- Migration to New York from Albany in 2014-2018: 5,389 (#1 most common destination from Albany)
- Migration from New York to Albany: 10,012 (#12 most common destination from New York)
- Net migration: 4,623 to Albany
- Migration from New York to Albany: 10,012 (#12 most common destination from New York)
- Net migration: 4,623 to Albany

41 / 50
Christopher & Amy Esposito // Wikicommons
#10. Chicago-Naperville-Elgin, IL-IN-WI Metro Area
- Migration to New York from Chicago in 2014-2018: 5,751 (#9 most common destination from Chicago)
- Migration from New York to Chicago: 7,432 (#15 most common destination from New York)
- Net migration: 1,681 to Chicago
- Migration from New York to Chicago: 7,432 (#15 most common destination from New York)
- Net migration: 1,681 to Chicago

42 / 50
en:User:Paul.h // Wikimedia
#9. San Francisco-Oakland-Hayward, CA Metro Area
- Migration to New York from San Francisco in 2014-2018: 5,942 (#7 most common destination from San Francisco)
- Migration from New York to San Francisco: 9,761 (#13 most common destination from New York)
- Net migration: 3,819 to San Francisco
- Migration from New York to San Francisco: 9,761 (#13 most common destination from New York)
- Net migration: 3,819 to San Francisco

43 / 50
Theresa Marconi // Wikimedia Commons
#8. Rochester, NY Metro Area
- Migration to New York from Rochester in 2014-2018: 6,304 (#1 most common destination from Rochester)
- Migration from New York to Rochester: 6,180 (#20 most common destination from New York)
- Net migration: 124 to New York
- Migration from New York to Rochester: 6,180 (#20 most common destination from New York)
- Net migration: 124 to New York

44 / 50
Christopher Boswell // Shutterstock
#7. Trenton, NJ Metro Area
- Migration to New York from Trenton in 2014-2018: 7,387 (#1 most common destination from Trenton)
- Migration from New York to Trenton: 12,288 (#8 most common destination from New York)
- Net migration: 4,901 to Trenton
- Migration from New York to Trenton: 12,288 (#8 most common destination from New York)
- Net migration: 4,901 to Trenton

45 / 50
JonathanVictor // Wikimedia
#6. Bridgeport-Stamford-Norwalk, CT Metro Area
- Migration to New York from Bridgeport in 2014-2018: 7,402 (#1 most common destination from Bridgeport)
- Migration from New York to Bridgeport: 14,095 (#6 most common destination from New York)
- Net migration: 6,693 to Bridgeport
- Migration from New York to Bridgeport: 14,095 (#6 most common destination from New York)
- Net migration: 6,693 to Bridgeport
46 / 50
BDS2006 // Wikimedia
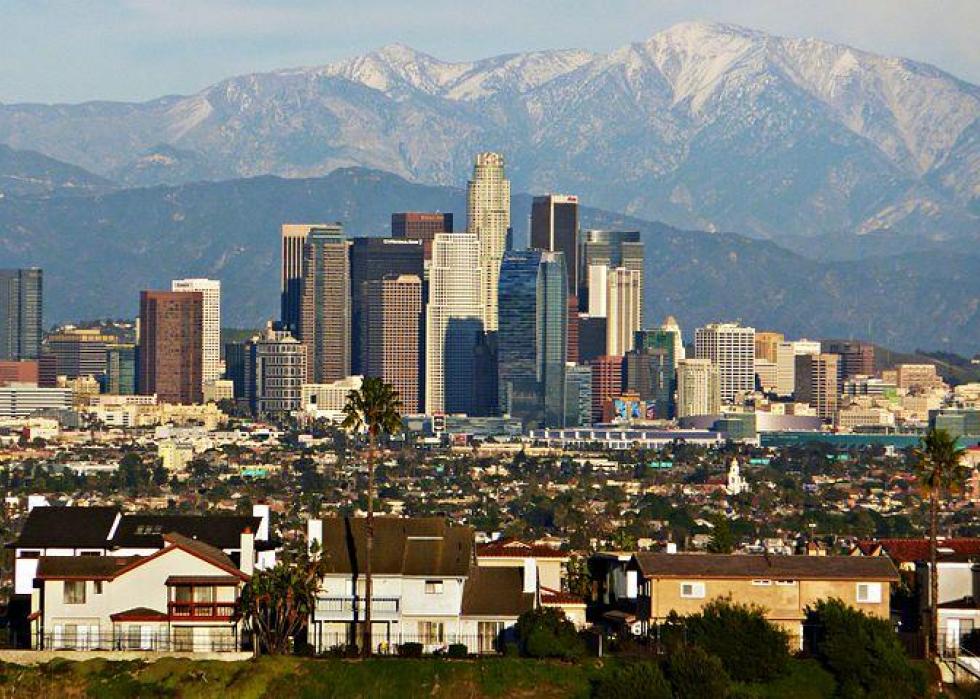
#5. Los Angeles-Long Beach-Anaheim, CA Metro Area
- Migration to New York from Los Angeles in 2014-2018: 8,887 (#10 most common destination from Los Angeles)
- Migration from New York to Los Angeles: 15,542 (#5 most common destination from New York)
- Net migration: 6,655 to Los Angeles
- Migration from New York to Los Angeles: 15,542 (#5 most common destination from New York)
- Net migration: 6,655 to Los Angeles

47 / 50
Kolossos // Wikimedia Commons
#4. Miami-Fort Lauderdale-West Palm Beach, FL Metro Area
- Migration to New York from Miami in 2014-2018: 9,282 (#4 most common destination from Miami)
- Migration from New York to Miami: 23,228 (#2 most common destination from New York)
- Net migration: 13,946 to Miami
- Migration from New York to Miami: 23,228 (#2 most common destination from New York)
- Net migration: 13,946 to Miami

48 / 50
Sean Pavone // Shutterstock
#3. Boston-Cambridge-Newton, MA-NH Metro Area
- Migration to New York from Boston in 2014-2018: 9,565 (#4 most common destination from Boston)
- Migration from New York to Boston: 16,264 (#3 most common destination from New York)
- Net migration: 6,699 to Boston
- Migration from New York to Boston: 16,264 (#3 most common destination from New York)
- Net migration: 6,699 to Boston

49 / 50
Andrew Bossi // Wikimedia
#2. Washington-Arlington-Alexandria, DC-VA-MD-WV Metro Area
- Migration to New York from Washington in 2014-2018: 10,600 (#4 most common destination from Washington)
- Migration from New York to Washington: 16,086 (#4 most common destination from New York)
- Net migration: 5,486 to Washington
- Migration from New York to Washington: 16,086 (#4 most common destination from New York)
- Net migration: 5,486 to Washington

50 / 50
f11photo // Shutterstock
#1. Philadelphia-Camden-Wilmington, PA-NJ-DE-MD Metro Area
- Migration to New York from Philadelphia in 2014-2018: 18,328 (#1 most common destination from Philadelphia)
- Migration from New York to Philadelphia: 31,621 (#1 most common destination from New York)
- Net migration: 13,293 to Philadelphia
- Migration from New York to Philadelphia: 31,621 (#1 most common destination from New York)
- Net migration: 13,293 to Philadelphia


