
Where people in San Angelo are moving to most
Written by:
February 9, 2021
Billy Hathorn // Wikimedia
Where people in San Angelo are moving to most
Stacker compiled a list of where people in San Angelo are moving to the most using data from the U.S. Census Bureau. Metros are ranked by the estimated number of people who moved to the metro from San Angelo between 2014 and 2018. Ties were broken by gross migration.

1 / 25
Lpret // Wikicommons
#25. Waco, TX Metro Area
- Migration to Waco in 2014-2018: 53
- Migration from Waco to San Angelo: 28 (#46 most common destination from Waco)
- Net migration: 25 to Waco
- Migration from Waco to San Angelo: 28 (#46 most common destination from Waco)
- Net migration: 25 to Waco

2 / 25
Tricia Daniel // Shutterstock
#24. College Station-Bryan, TX Metro Area
- Migration to College Station in 2014-2018: 55
- Migration from College Station to San Angelo: 130 (#24 most common destination from College Station)
- Net migration: 75 to San Angelo
- Migration from College Station to San Angelo: 130 (#24 most common destination from College Station)
- Net migration: 75 to San Angelo

3 / 25
Tysto // Wikimedia Commons
#23. Dayton, OH Metro Area
- Migration to Dayton in 2014-2018: 65
- Migration from Dayton to San Angelo: 27 (#116 most common destination from Dayton)
- Net migration: 38 to Dayton
- Migration from Dayton to San Angelo: 27 (#116 most common destination from Dayton)
- Net migration: 38 to Dayton

4 / 25
lowahwyman // Wikimedia Commons
#22. Des Moines-West Des Moines, IA Metro Area
- Migration to Des Moines in 2014-2018: 71
- Migration from Des Moines to San Angelo: 117 (#35 most common destination from Des Moines)
- Net migration: 46 to San Angelo
- Migration from Des Moines to San Angelo: 117 (#35 most common destination from Des Moines)
- Net migration: 46 to San Angelo

5 / 25
Glorioussandwich // Wikimedia
#21. Grand Forks, ND-MN Metro Area
- Migration to Grand Forks in 2014-2018: 73
- Migration from Grand Forks to San Angelo: 0
- Net migration: 73 to Grand Forks
- Migration from Grand Forks to San Angelo: 0
- Net migration: 73 to Grand Forks

6 / 25
randy andy // Shutterstock
#20. Las Vegas-Henderson-Paradise, NV Metro Area
- Migration to Las Vegas in 2014-2018: 75
- Migration from Las Vegas to San Angelo: 45 (#170 most common destination from Las Vegas)
- Net migration: 30 to Las Vegas
- Migration from Las Vegas to San Angelo: 45 (#170 most common destination from Las Vegas)
- Net migration: 30 to Las Vegas

7 / 25
Stuart Seeger // Wikicommons
#19. Portland-Vancouver-Hillsboro, OR-WA Metro Area
- Migration to Portland in 2014-2018: 77
- Migration from Portland to San Angelo: 10 (#247 most common destination from Portland)
- Net migration: 67 to Portland
- Migration from Portland to San Angelo: 10 (#247 most common destination from Portland)
- Net migration: 67 to Portland

8 / 25
Jdcollins13 // Wikimedia Commons
#18. Jacksonville, NC Metro Area
- Migration to Jacksonville in 2014-2018: 84
- Migration from Jacksonville to San Angelo: 72 (#74 most common destination from Jacksonville)
- Net migration: 12 to Jacksonville
- Migration from Jacksonville to San Angelo: 72 (#74 most common destination from Jacksonville)
- Net migration: 12 to Jacksonville

9 / 25
Sherry V Smith // Shutterstock
#17. Virginia Beach-Norfolk-Newport News, VA-NC Metro Area
- Migration to Virginia Beach in 2014-2018: 86
- Migration from Virginia Beach to San Angelo: 30 (#199 most common destination from Virginia Beach)
- Net migration: 56 to Virginia Beach
- Migration from Virginia Beach to San Angelo: 30 (#199 most common destination from Virginia Beach)
- Net migration: 56 to Virginia Beach
10 / 25
Ray Bouknight // Wikicommons
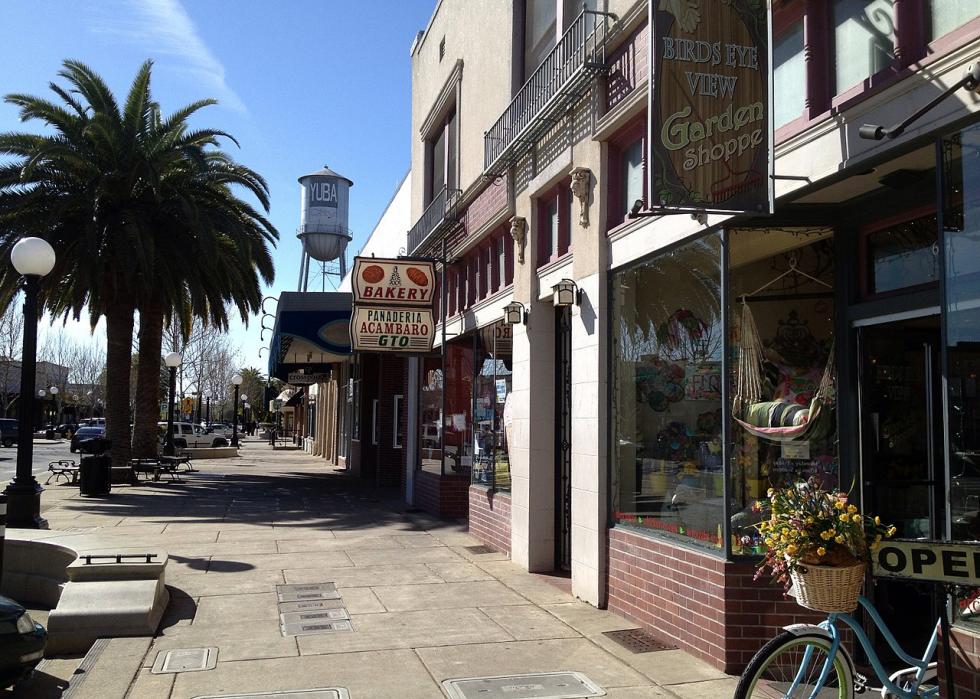
#16. Yuba City, CA Metro Area
- Migration to Yuba City in 2014-2018: 98
- Migration from Yuba City to San Angelo: 64 (#21 most common destination from Yuba City)
- Net migration: 34 to Yuba City
- Migration from Yuba City to San Angelo: 64 (#21 most common destination from Yuba City)
- Net migration: 34 to Yuba City

11 / 25
Zereshk // Wikimedia
#15. Tucson, AZ Metro Area
- Migration to Tucson in 2014-2018: 120
- Migration from Tucson to San Angelo: 0
- Net migration: 120 to Tucson
- Migration from Tucson to San Angelo: 0
- Net migration: 120 to Tucson

12 / 25
AndrewAvitus // Wikicommons'
#14. Jacksonville, FL Metro Area
- Migration to Jacksonville in 2014-2018: 125
- Migration from Jacksonville to San Angelo: 0
- Net migration: 125 to Jacksonville
- Migration from Jacksonville to San Angelo: 0
- Net migration: 125 to Jacksonville

13 / 25
DPPed// Wikimedia
#13. Phoenix-Mesa-Scottsdale, AZ Metro Area
- Migration to Phoenix in 2014-2018: 131
- Migration from Phoenix to San Angelo: 10 (#320 most common destination from Phoenix)
- Net migration: 121 to Phoenix
- Migration from Phoenix to San Angelo: 10 (#320 most common destination from Phoenix)
- Net migration: 121 to Phoenix

14 / 25
SG Arts // Shutterstock
#12. Midland, TX Metro Area
- Migration to Midland in 2014-2018: 170
- Migration from Midland to San Angelo: 271 (#8 most common destination from Midland)
- Net migration: 101 to San Angelo
- Migration from Midland to San Angelo: 271 (#8 most common destination from Midland)
- Net migration: 101 to San Angelo

15 / 25
Epccedu // Wikimedia Commons
#11. El Paso, TX Metro Area
- Migration to El Paso in 2014-2018: 179
- Migration from El Paso to San Angelo: 82 (#84 most common destination from El Paso)
- Net migration: 97 to El Paso
- Migration from El Paso to San Angelo: 82 (#84 most common destination from El Paso)
- Net migration: 97 to El Paso

16 / 25
Famartin // Wikicommons
#10. Baltimore-Columbia-Towson, MD Metro Area
- Migration to Baltimore in 2014-2018: 194
- Migration from Baltimore to San Angelo: 81 (#137 most common destination from Baltimore)
- Net migration: 113 to Baltimore
- Migration from Baltimore to San Angelo: 81 (#137 most common destination from Baltimore)
- Net migration: 113 to Baltimore

17 / 25
Billy Hathorn // Wikimedia
#9. Killeen-Temple, TX Metro Area
- Migration to Killeen in 2014-2018: 194
- Migration from Killeen to San Angelo: 123 (#54 most common destination from Killeen)
- Net migration: 71 to Killeen
- Migration from Killeen to San Angelo: 123 (#54 most common destination from Killeen)
- Net migration: 71 to Killeen

18 / 25
Barbara Brannon//Flickr
#8. Abilene, TX Metro Area
- Migration to Abilene in 2014-2018: 259
- Migration from Abilene to San Angelo: 465 (#4 most common destination from Abilene)
- Net migration: 206 to San Angelo
- Migration from Abilene to San Angelo: 465 (#4 most common destination from Abilene)
- Net migration: 206 to San Angelo

19 / 25
skeeze // Pixabay
#7. Houston-The Woodlands-Sugar Land, TX Metro Area
- Migration to Houston in 2014-2018: 259
- Migration from Houston to San Angelo: 717 (#45 most common destination from Houston)
- Net migration: 458 to San Angelo
- Migration from Houston to San Angelo: 717 (#45 most common destination from Houston)
- Net migration: 458 to San Angelo

20 / 25
Rusalkin Dmytro // Shutterstock
#6. Odessa, TX Metro Area
- Migration to Odessa in 2014-2018: 271
- Migration from Odessa to San Angelo: 61 (#22 most common destination from Odessa)
- Net migration: 210 to Odessa
- Migration from Odessa to San Angelo: 61 (#22 most common destination from Odessa)
- Net migration: 210 to Odessa

21 / 25
Elred // Wikimedia Commons
#5. Lubbock, TX Metro Area
- Migration to Lubbock in 2014-2018: 295
- Migration from Lubbock to San Angelo: 75 (#35 most common destination from Lubbock)
- Net migration: 220 to Lubbock
- Migration from Lubbock to San Angelo: 75 (#35 most common destination from Lubbock)
- Net migration: 220 to Lubbock

22 / 25
Robert Corby // Wikimedia Commons
#4. Colorado Springs, CO Metro Area
- Migration to Colorado Springs in 2014-2018: 342
- Migration from Colorado Springs to San Angelo: 103 (#91 most common destination from Colorado Springs)
- Net migration: 239 to Colorado Springs
- Migration from Colorado Springs to San Angelo: 103 (#91 most common destination from Colorado Springs)
- Net migration: 239 to Colorado Springs

23 / 25
Alan Botting // Wikimedia Commons
#3. Dallas-Fort Worth-Arlington, TX Metro Area
- Migration to Dallas in 2014-2018: 437
- Migration from Dallas to San Angelo: 696 (#56 most common destination from Dallas)
- Net migration: 259 to San Angelo
- Migration from Dallas to San Angelo: 696 (#56 most common destination from Dallas)
- Net migration: 259 to San Angelo

24 / 25
Pixabay
#2. Austin-Round Rock, TX Metro Area
- Migration to Austin in 2014-2018: 691
- Migration from Austin to San Angelo: 555 (#28 most common destination from Austin)
- Net migration: 136 to Austin
- Migration from Austin to San Angelo: 555 (#28 most common destination from Austin)
- Net migration: 136 to Austin

25 / 25
Pixabay
#1. San Antonio-New Braunfels, TX Metro Area
- Migration to San Antonio in 2014-2018: 730
- Migration from San Antonio to San Angelo: 258 (#68 most common destination from San Antonio)
- Net migration: 472 to San Antonio
- Migration from San Antonio to San Angelo: 258 (#68 most common destination from San Antonio)
- Net migration: 472 to San Antonio


