
Where people in Watertown are moving to most
Written by:
February 9, 2021
Public Domain
Where people in Watertown are moving to most
Stacker compiled a list of where people in Watertown are moving to the most using data from the U.S. Census Bureau. Metros are ranked by the estimated number of people who moved to the metro from Watertown between 2014 and 2018. Ties were broken by gross migration.

1 / 25
Home4tnindustry // Wikimedia
#25. Morristown, TN Metro Area
- Migration to Morristown in 2014-2018: 168
- Migration from Morristown to Watertown: 0
- Net migration: 168 to Morristown
- Migration from Morristown to Watertown: 0
- Net migration: 168 to Morristown

2 / 25
Calstanhope // Wikimedia Commons
#24. Elizabethtown-Fort Knox, KY Metro Area
- Migration to Elizabethtown in 2014-2018: 169
- Migration from Elizabethtown to Watertown: 60 (#40 most common destination from Elizabethtown)
- Net migration: 109 to Elizabethtown
- Migration from Elizabethtown to Watertown: 60 (#40 most common destination from Elizabethtown)
- Net migration: 109 to Elizabethtown

3 / 25
WillHuebie // Shutterstock
#23. Lawton, OK Metro Area
- Migration to Lawton in 2014-2018: 170
- Migration from Lawton to Watertown: 80 (#32 most common destination from Lawton)
- Net migration: 90 to Lawton
- Migration from Lawton to Watertown: 80 (#32 most common destination from Lawton)
- Net migration: 90 to Lawton

4 / 25
davidwilson1949 // Flickr
#22. Fayetteville, NC Metro Area
- Migration to Fayetteville in 2014-2018: 171
- Migration from Fayetteville to Watertown: 238 (#35 most common destination from Fayetteville)
- Net migration: 67 to Watertown
- Migration from Fayetteville to Watertown: 238 (#35 most common destination from Fayetteville)
- Net migration: 67 to Watertown

5 / 25
Jmancuso // Wikimedia Commons
#21. Utica-Rome, NY Metro Area
- Migration to Utica in 2014-2018: 174
- Migration from Utica to Watertown: 201 (#6 most common destination from Utica)
- Net migration: 27 to Watertown
- Migration from Utica to Watertown: 201 (#6 most common destination from Utica)
- Net migration: 27 to Watertown

6 / 25
Famartin // Wikicommons
#20. Baltimore-Columbia-Towson, MD Metro Area
- Migration to Baltimore in 2014-2018: 184
- Migration from Baltimore to Watertown: 80 (#139 most common destination from Baltimore)
- Net migration: 104 to Baltimore
- Migration from Baltimore to Watertown: 80 (#139 most common destination from Baltimore)
- Net migration: 104 to Baltimore

7 / 25
Stephen Zimmermann // Wikimedia Commons
#19. Buffalo-Cheektowaga-Niagara Falls, NY Metro Area
- Migration to Buffalo in 2014-2018: 198
- Migration from Buffalo to Watertown: 278 (#21 most common destination from Buffalo)
- Net migration: 80 to Watertown
- Migration from Buffalo to Watertown: 278 (#21 most common destination from Buffalo)
- Net migration: 80 to Watertown

8 / 25
Andrew Bossi // Wikimedia
#18. Washington-Arlington-Alexandria, DC-VA-MD-WV Metro Area
- Migration to Washington in 2014-2018: 206
- Migration from Washington to Watertown: 187 (#164 most common destination from Washington)
- Net migration: 19 to Washington
- Migration from Washington to Watertown: 187 (#164 most common destination from Washington)
- Net migration: 19 to Washington

9 / 25
Alan Botting // Wikimedia Commons
#17. Dallas-Fort Worth-Arlington, TX Metro Area
- Migration to Dallas in 2014-2018: 219
- Migration from Dallas to Watertown: 113 (#169 most common destination from Dallas)
- Net migration: 106 to Dallas
- Migration from Dallas to Watertown: 113 (#169 most common destination from Dallas)
- Net migration: 106 to Dallas

10 / 25
EQRoy // Shutterstock
#16. Fairbanks, AK Metro Area
- Migration to Fairbanks in 2014-2018: 220
- Migration from Fairbanks to Watertown: 124 (#18 most common destination from Fairbanks)
- Net migration: 96 to Fairbanks
- Migration from Fairbanks to Watertown: 124 (#18 most common destination from Fairbanks)
- Net migration: 96 to Fairbanks

11 / 25
Sean Pavone // Shutterstock
#15. Manchester-Nashua, NH Metro Area
- Migration to Manchester in 2014-2018: 221
- Migration from Manchester to Watertown: 0
- Net migration: 221 to Manchester
- Migration from Manchester to Watertown: 0
- Net migration: 221 to Manchester
12 / 25
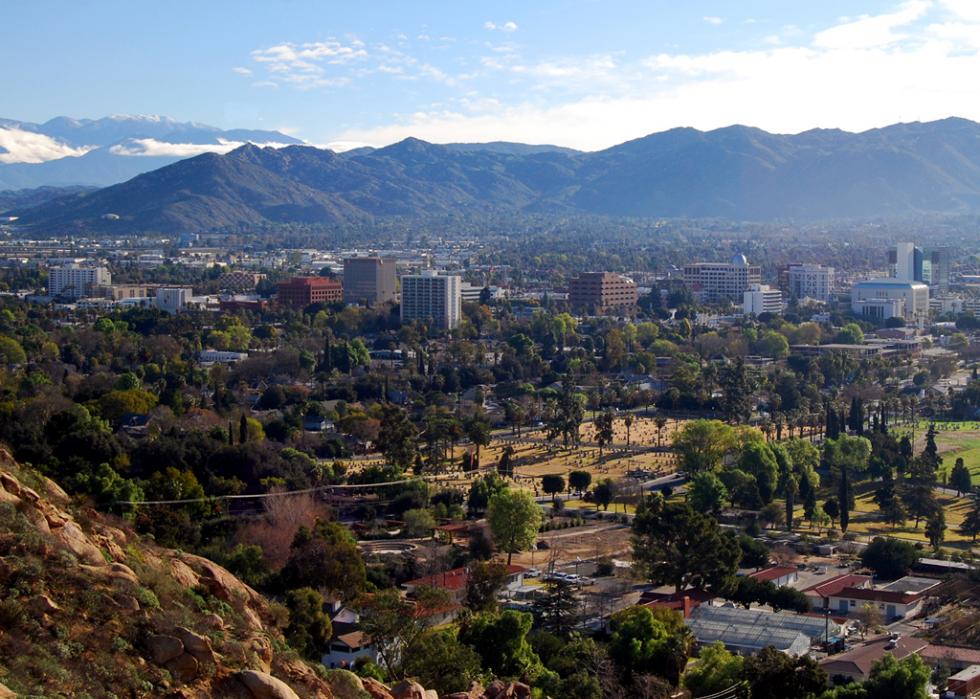
Daniel Orth // Flickr
#14. Riverside-San Bernardino-Ontario, CA Metro Area
- Migration to Riverside in 2014-2018: 251
- Migration from Riverside to Watertown: 112 (#131 most common destination from Riverside)
- Net migration: 139 to Riverside
- Migration from Riverside to Watertown: 112 (#131 most common destination from Riverside)
- Net migration: 139 to Riverside

13 / 25
Wangkun Jia // Shutterstock
#13. Albany-Schenectady-Troy, NY Metro Area
- Migration to Albany in 2014-2018: 253
- Migration from Albany to Watertown: 99 (#65 most common destination from Albany)
- Net migration: 154 to Albany
- Migration from Albany to Watertown: 99 (#65 most common destination from Albany)
- Net migration: 154 to Albany

14 / 25
Wtoc11 // Flickr
#12. Hinesville, GA Metro Area
- Migration to Hinesville in 2014-2018: 272
- Migration from Hinesville to Watertown: 82 (#31 most common destination from Hinesville)
- Net migration: 190 to Hinesville
- Migration from Hinesville to Watertown: 82 (#31 most common destination from Hinesville)
- Net migration: 190 to Hinesville

15 / 25
Sherry V Smith // Shutterstock
#11. Virginia Beach-Norfolk-Newport News, VA-NC Metro Area
- Migration to Virginia Beach in 2014-2018: 336
- Migration from Virginia Beach to Watertown: 40 (#178 most common destination from Virginia Beach)
- Net migration: 296 to Virginia Beach
- Migration from Virginia Beach to Watertown: 40 (#178 most common destination from Virginia Beach)
- Net migration: 296 to Virginia Beach

16 / 25
Pixabay
#10. San Antonio-New Braunfels, TX Metro Area
- Migration to San Antonio in 2014-2018: 363
- Migration from San Antonio to Watertown: 431 (#37 most common destination from San Antonio)
- Net migration: 68 to Watertown
- Migration from San Antonio to Watertown: 431 (#37 most common destination from San Antonio)
- Net migration: 68 to Watertown

17 / 25
Songquan Deng // Shutterstock
#9. Orlando-Kissimmee-Sanford, FL Metro Area
- Migration to Orlando in 2014-2018: 372
- Migration from Orlando to Watertown: 57 (#150 most common destination from Orlando)
- Net migration: 315 to Orlando
- Migration from Orlando to Watertown: 57 (#150 most common destination from Orlando)
- Net migration: 315 to Orlando

18 / 25
Theresa Marconi // Wikimedia Commons
#8. Rochester, NY Metro Area
- Migration to Rochester in 2014-2018: 397
- Migration from Rochester to Watertown: 110 (#49 most common destination from Rochester)
- Net migration: 287 to Rochester
- Migration from Rochester to Watertown: 110 (#49 most common destination from Rochester)
- Net migration: 287 to Rochester

19 / 25
Billy Hathorn // Wikimedia
#7. Killeen-Temple, TX Metro Area
- Migration to Killeen in 2014-2018: 411
- Migration from Killeen to Watertown: 320 (#24 most common destination from Killeen)
- Net migration: 91 to Killeen
- Migration from Killeen to Watertown: 320 (#24 most common destination from Killeen)
- Net migration: 91 to Killeen

20 / 25
Edmund Garman // Flickr
#6. Urban Honolulu, HI Metro Area
- Migration to Urban Honolulu in 2014-2018: 437
- Migration from Urban Honolulu to Watertown: 354 (#34 most common destination from Urban Honolulu)
- Net migration: 83 to Urban Honolulu
- Migration from Urban Honolulu to Watertown: 354 (#34 most common destination from Urban Honolulu)
- Net migration: 83 to Urban Honolulu

21 / 25
f11photo // Shutterstock
#5. Philadelphia-Camden-Wilmington, PA-NJ-DE-MD Metro Area
- Migration to Philadelphia in 2014-2018: 468
- Migration from Philadelphia to Watertown: 44 (#201 most common destination from Philadelphia)
- Net migration: 424 to Philadelphia
- Migration from Philadelphia to Watertown: 44 (#201 most common destination from Philadelphia)
- Net migration: 424 to Philadelphia

22 / 25
Doug Kerr // Wikimedia Commons
#4. Syracuse, NY Metro Area
- Migration to Syracuse in 2014-2018: 499
- Migration from Syracuse to Watertown: 509 (#10 most common destination from Syracuse)
- Net migration: 10 to Watertown
- Migration from Syracuse to Watertown: 509 (#10 most common destination from Syracuse)
- Net migration: 10 to Watertown

23 / 25
Public Domain
#3. Seattle-Tacoma-Bellevue, WA Metro Area
- Migration to Seattle in 2014-2018: 553
- Migration from Seattle to Watertown: 41 (#221 most common destination from Seattle)
- Net migration: 512 to Seattle
- Migration from Seattle to Watertown: 41 (#221 most common destination from Seattle)
- Net migration: 512 to Seattle

24 / 25
Epccedu // Wikimedia Commons
#2. El Paso, TX Metro Area
- Migration to El Paso in 2014-2018: 559
- Migration from El Paso to Watertown: 97 (#77 most common destination from El Paso)
- Net migration: 462 to El Paso
- Migration from El Paso to Watertown: 97 (#77 most common destination from El Paso)
- Net migration: 462 to El Paso

25 / 25
King of Hearts // Wikimedia
#1. New York-Newark-Jersey City, NY-NJ-PA Metro Area
- Migration to New York in 2014-2018: 730
- Migration from New York to Watertown: 949 (#90 most common destination from New York)
- Net migration: 219 to Watertown
- Migration from New York to Watertown: 949 (#90 most common destination from New York)
- Net migration: 219 to Watertown


