
Fastest-growing counties in California
Fastest-growing counties in California
From 2018 to 2019, the U.S. population grew by .48%, its slowest rate in 100 years. Declining births, increasing deaths largely due to the graying Baby Boomer population, and a crackdown on immigration have contributed to many states seeing net population losses in recent years.
But in other pockets of the country, populations are growing. These shifts can be due to job opportunities, high quality of life, easy commutability to job centers, low rents, or any combination of these or other factors. Stacker compiled a list of the fastest-growing counties in California using data from the U.S. Census Bureau. Counties are ranked by the highest population growth from 2010 to 2019, based on 5-year estimates.
A county typically sees population growth as a “bedroom community” (a municipality with an atypically large commuting population) to a large city. These communities are typically quieter than their feeder cities, offer lower rents and a higher quality of living, and are remote enough to be immune to the feeder city’s crime, traffic, and crowds. Keep reading to see if your home county made the list.
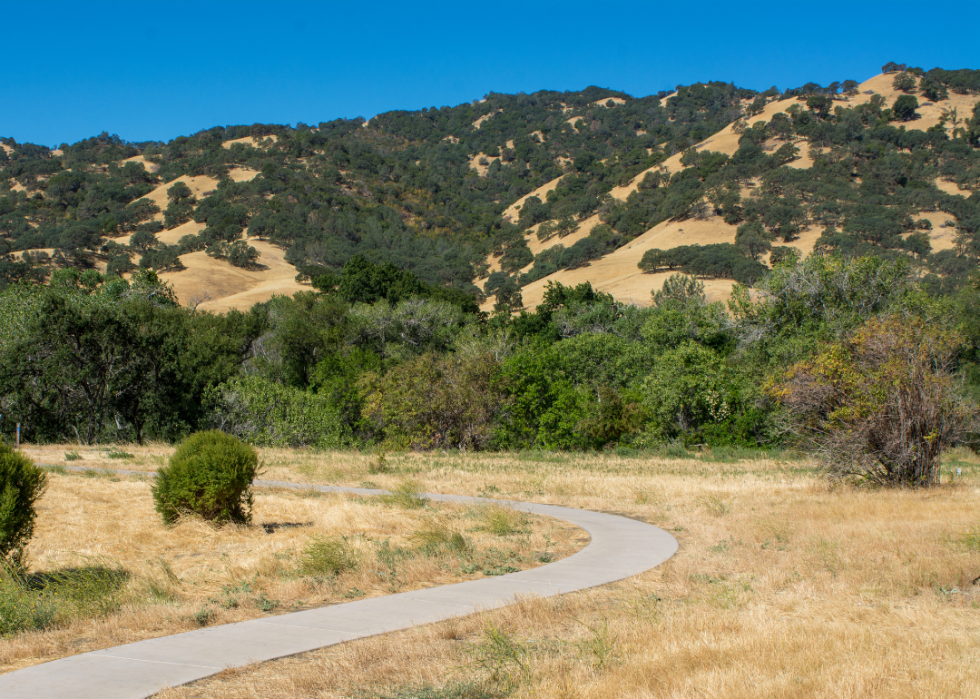
#30. Madera County
--- #447 among all counties nationwide
- 2010 to 2019 percent population change: +5.2%
--- #29 among counties in California, #780 among all counties nationwide
- 2019 population: 155,433
--- #32 largest county in California, #422 largest county nationwide

#29. El Dorado County
--- #404 among all counties nationwide
- 2010 to 2019 percent population change: +5.3%
--- #28 among counties in California, #768 among all counties nationwide
- 2019 population: 188,563
--- #29 largest county in California, #348 largest county nationwide
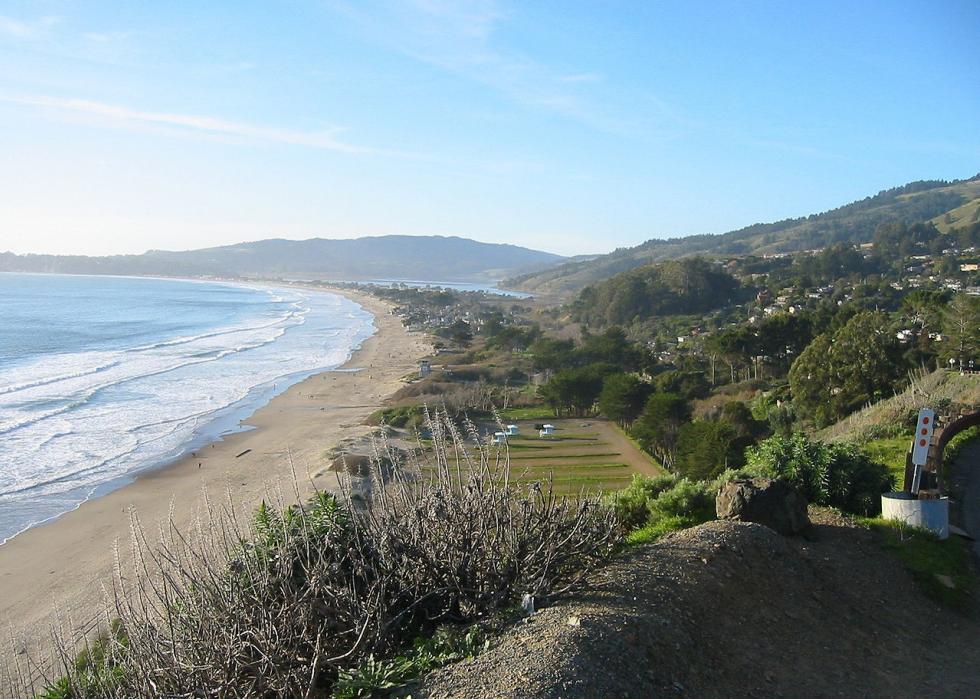
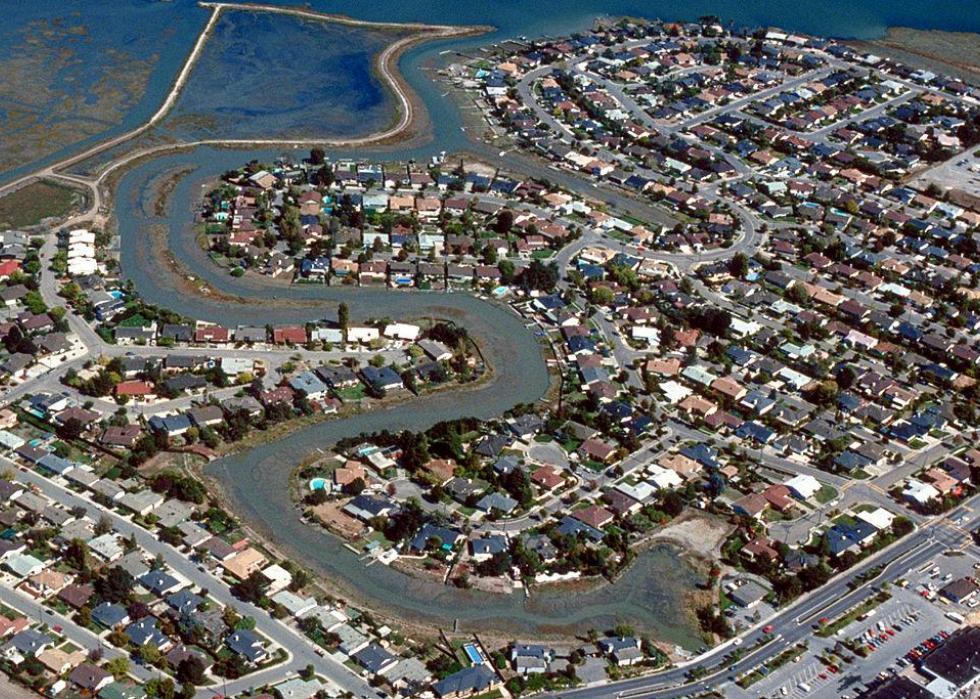
#28. Marin County
--- #363 among all counties nationwide
- 2010 to 2019 percent population change: +4.6%
--- #31 among counties in California, #847 among all counties nationwide
- 2019 population: 259,943
--- #26 largest county in California, #263 largest county nationwide
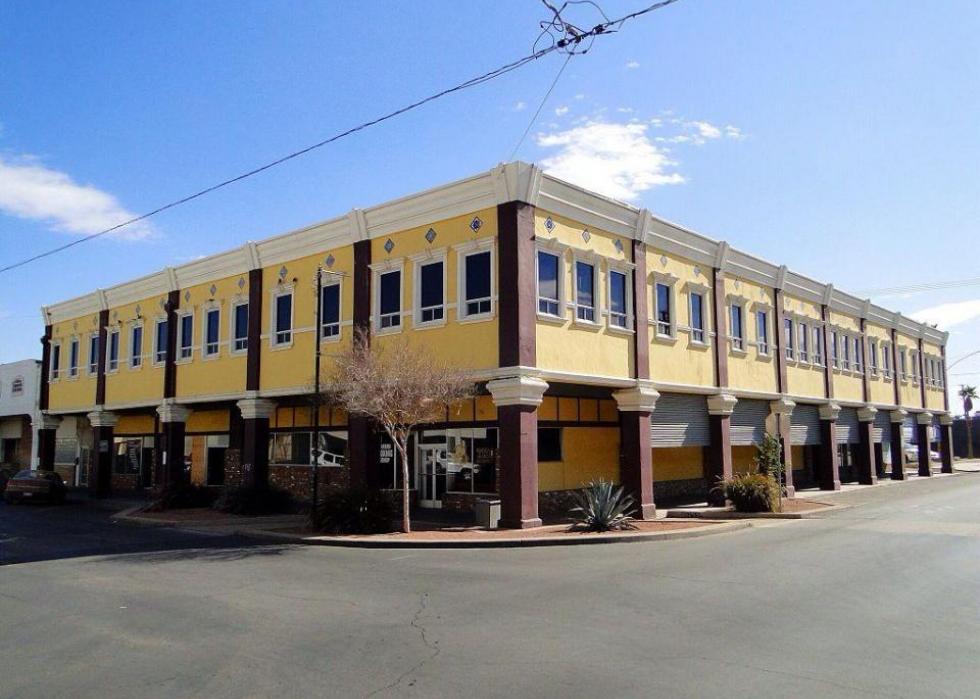
#27. Imperial County
--- #344 among all counties nationwide
- 2010 to 2019 percent population change: +7.5%
--- #18 among counties in California, #569 among all counties nationwide
- 2019 population: 180,701
--- #30 largest county in California, #362 largest county nationwide
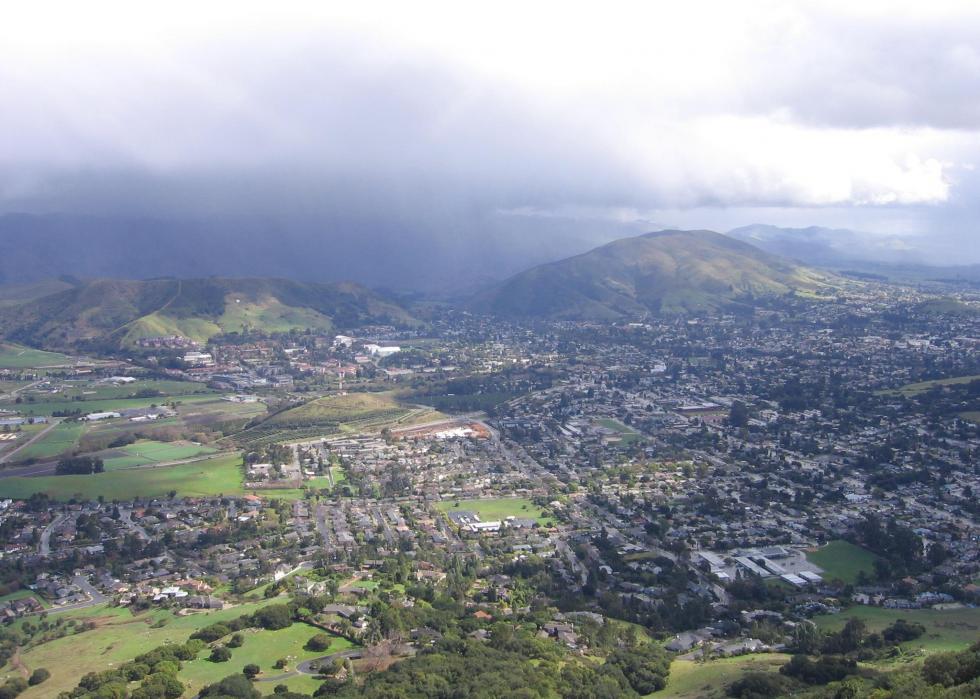
#26. San Luis Obispo County
--- #296 among all counties nationwide
- 2010 to 2019 percent population change: +6.2%
--- #26 among counties in California, #671 among all counties nationwide
- 2019 population: 282,165
--- #23 largest county in California, #244 largest county nationwide
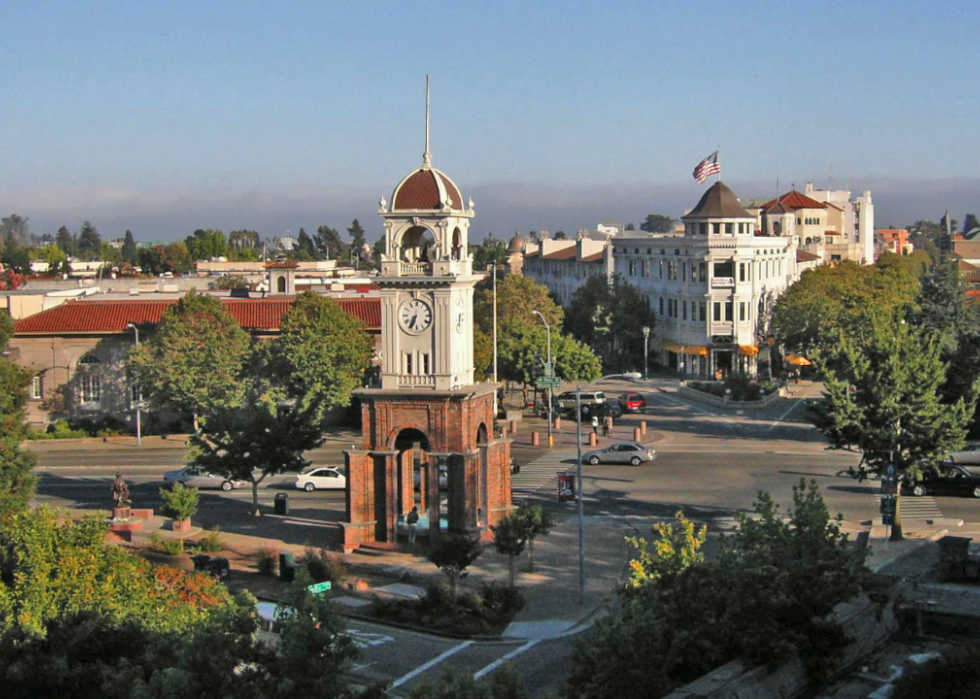
#25. Santa Cruz County
--- #291 among all counties nationwide
- 2010 to 2019 percent population change: +6.6%
--- #23 among counties in California, #640 among all counties nationwide
- 2019 population: 273,962
--- #24 largest county in California, #248 largest county nationwide
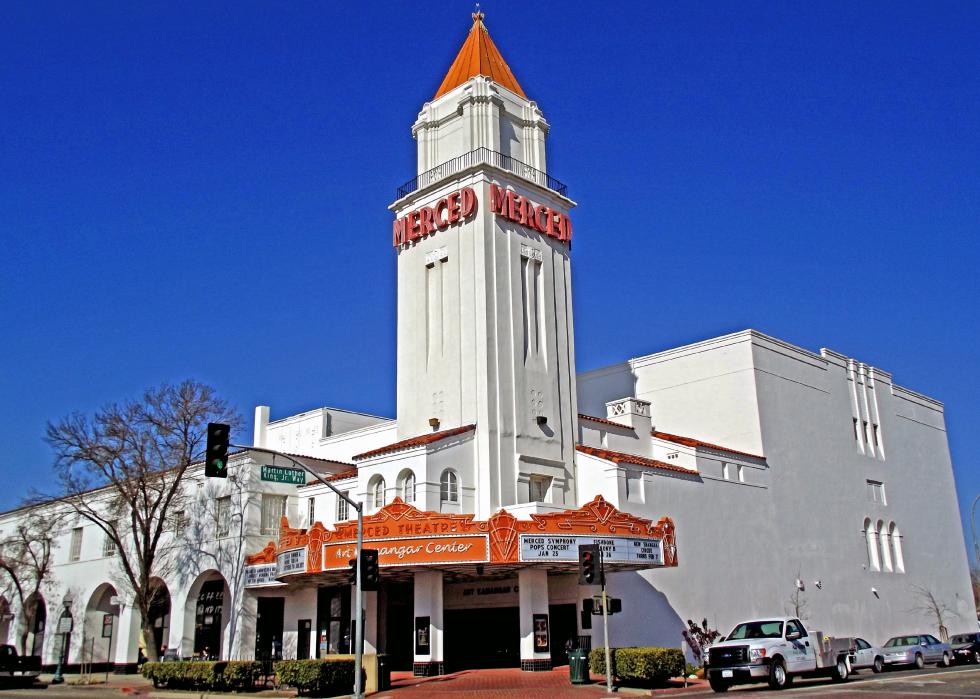
#24. Merced County
--- #260 among all counties nationwide
- 2010 to 2019 percent population change: +8.3%
--- #15 among counties in California, #515 among all counties nationwide
- 2019 population: 271,382
--- #25 largest county in California, #251 largest county nationwide

#23. Yolo County
--- #257 among all counties nationwide
- 2010 to 2019 percent population change: +10.7%
--- #8 among counties in California, #362 among all counties nationwide
- 2019 population: 217,352
--- #28 largest county in California, #306 largest county nationwide

#22. Sonoma County
--- #214 among all counties nationwide
- 2010 to 2019 percent population change: +5.4%
--- #27 among counties in California, #749 among all counties nationwide
- 2019 population: 499,772
--- #17 largest county in California, #141 largest county nationwide
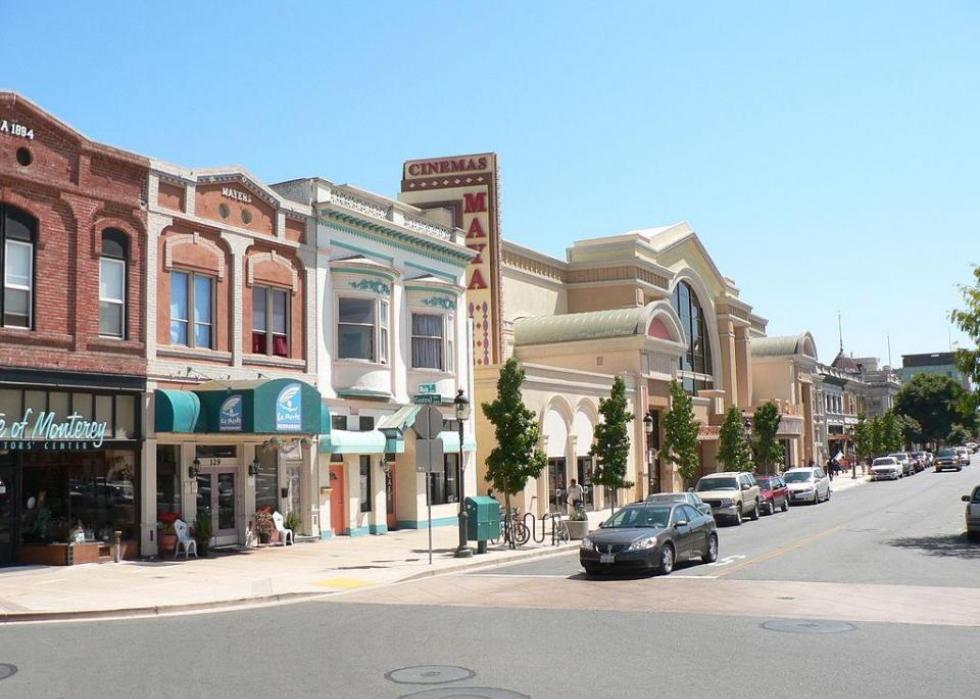
#21. Monterey County
--- #212 among all counties nationwide
- 2010 to 2019 percent population change: +6.4%
--- #25 among counties in California, #660 among all counties nationwide
- 2019 population: 433,410
--- #21 largest county in California, #162 largest county nationwide
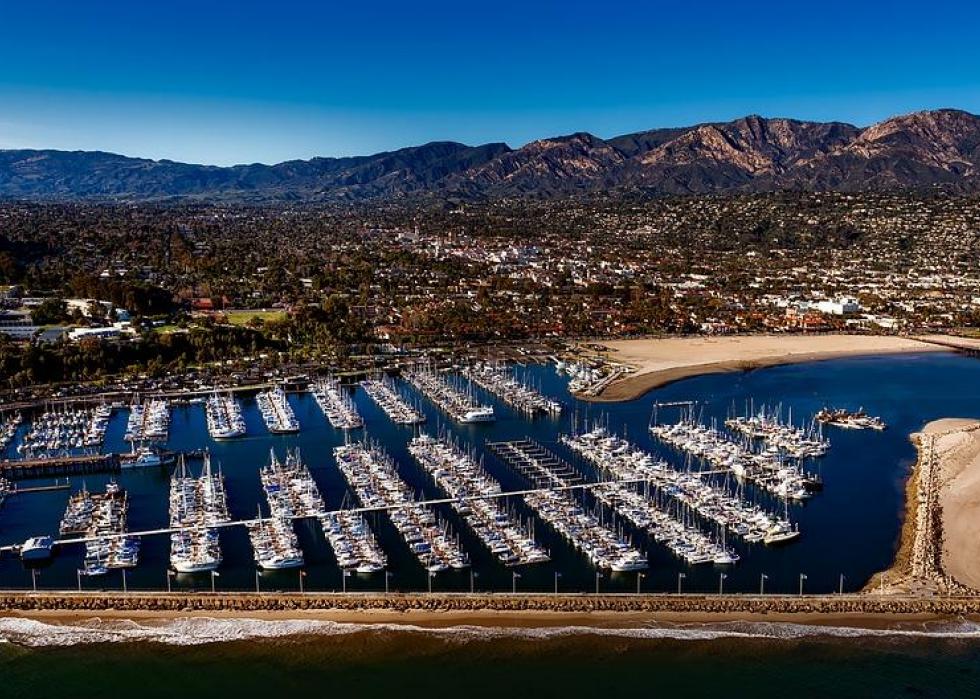
#20. Santa Barbara County
--- #190 among all counties nationwide
- 2010 to 2019 percent population change: +6.9%
--- #21 among counties in California, #618 among all counties nationwide
- 2019 population: 444,829
--- #19 largest county in California, #158 largest county nationwide
#19. Solano County
--- #171 among all counties nationwide
- 2010 to 2019 percent population change: +7.8%
--- #16 among counties in California, #549 among all counties nationwide
- 2019 population: 441,829
--- #20 largest county in California, #160 largest county nationwide
#18. Tulare County
--- #165 among all counties nationwide
- 2010 to 2019 percent population change: +7.6%
--- #17 among counties in California, #566 among all counties nationwide
- 2019 population: 461,898
--- #18 largest county in California, #149 largest county nationwide
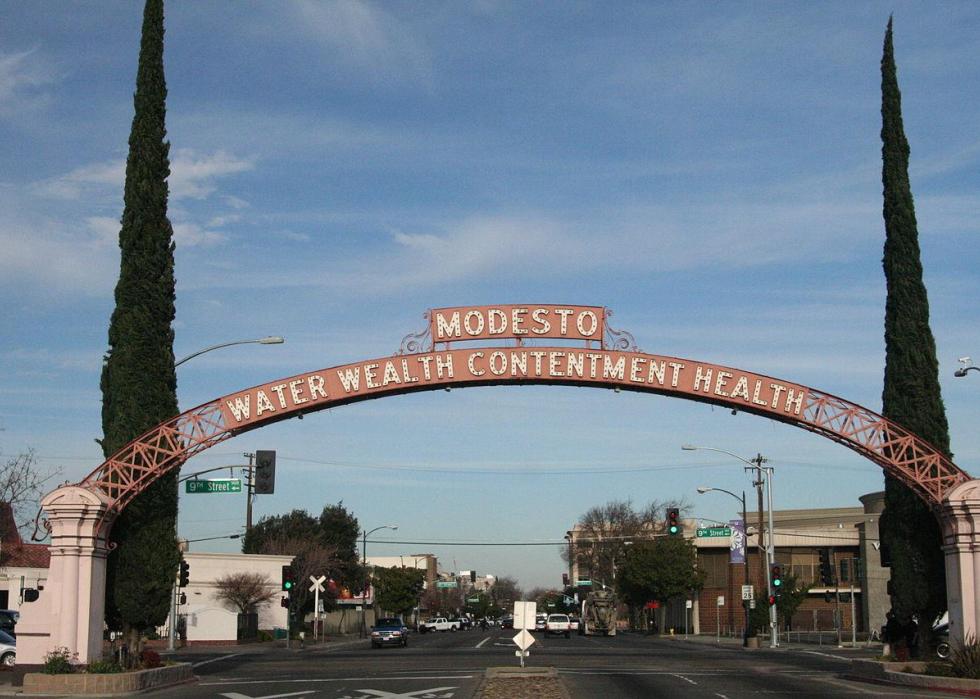
#17. Stanislaus County
--- #157 among all counties nationwide
- 2010 to 2019 percent population change: +6.6%
--- #24 among counties in California, #645 among all counties nationwide
- 2019 population: 543,194
--- #16 largest county in California, #124 largest county nationwide
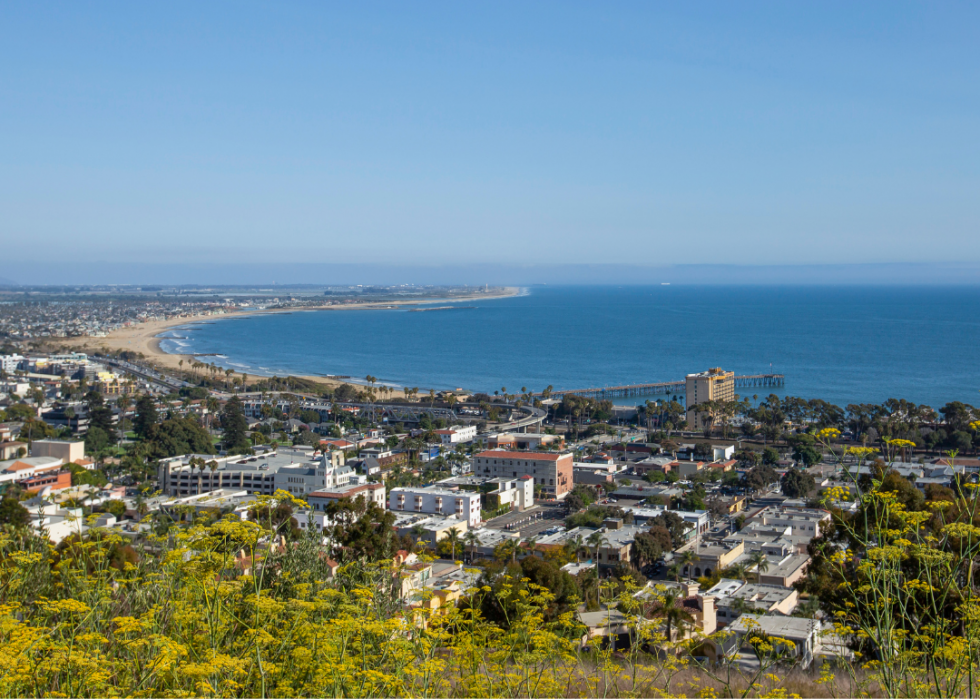
#16. Ventura County
--- #136 among all counties nationwide
- 2010 to 2019 percent population change: +4.7%
--- #30 among counties in California, #828 among all counties nationwide
- 2019 population: 847,263
--- #13 largest county in California, #68 largest county nationwide

#15. Placer County
--- #106 among all counties nationwide
- 2010 to 2019 percent population change: +14.6%
--- #1 among counties in California, #208 among all counties nationwide
- 2019 population: 385,512
--- #22 largest county in California, #180 largest county nationwide
#14. San Mateo County
--- #80 among all counties nationwide
- 2010 to 2019 percent population change: +9.0%
--- #12 among counties in California, #471 among all counties nationwide
- 2019 population: 767,423
--- #14 largest county in California, #82 largest county nationwide
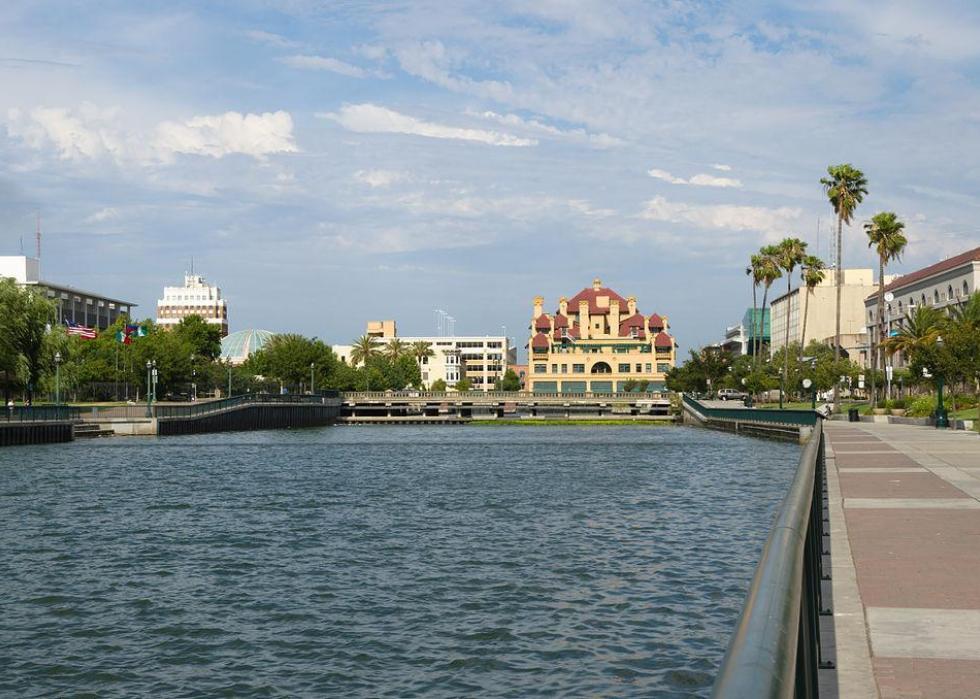
#13. San Joaquin County
--- #71 among all counties nationwide
- 2010 to 2019 percent population change: +10.2%
--- #9 among counties in California, #387 among all counties nationwide
- 2019 population: 742,603
--- #15 largest county in California, #88 largest county nationwide

#12. Kern County
--- #68 among all counties nationwide
- 2010 to 2019 percent population change: +8.8%
--- #13 among counties in California, #478 among all counties nationwide
- 2019 population: 887,641
--- #11 largest county in California, #62 largest county nationwide

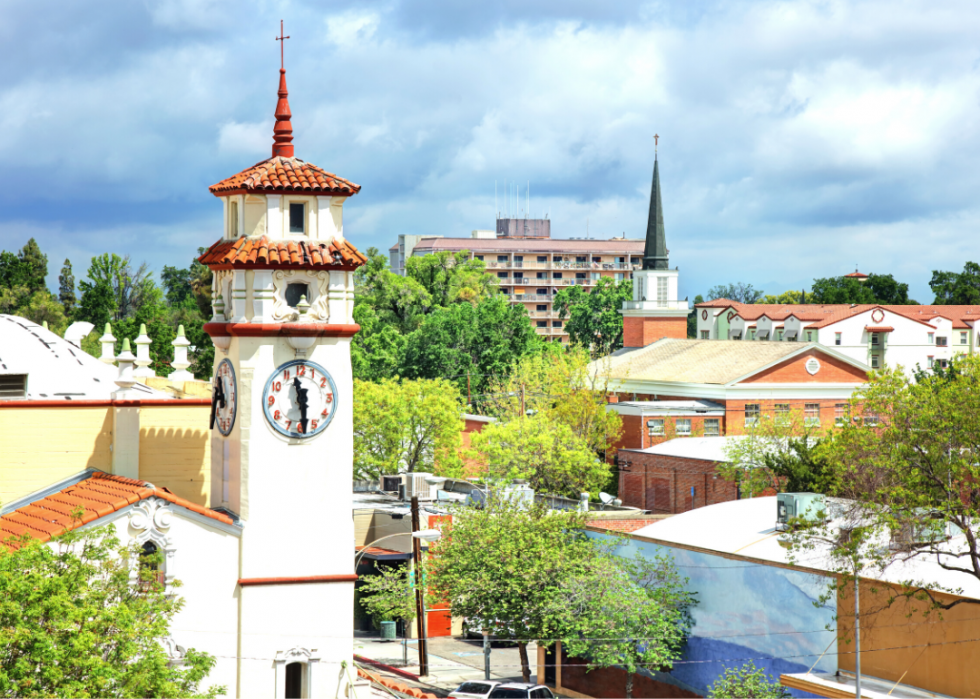
#11. Fresno County
--- #62 among all counties nationwide
- 2010 to 2019 percent population change: +8.3%
--- #14 among counties in California, #507 among all counties nationwide
- 2019 population: 984,521
--- #10 largest county in California, #47 largest county nationwide

#10. San Francisco County
--- #56 among all counties nationwide
- 2010 to 2019 percent population change: +10.9%
--- #5 among counties in California, #350 among all counties nationwide
- 2019 population: 874,961
--- #12 largest county in California, #64 largest county nationwide
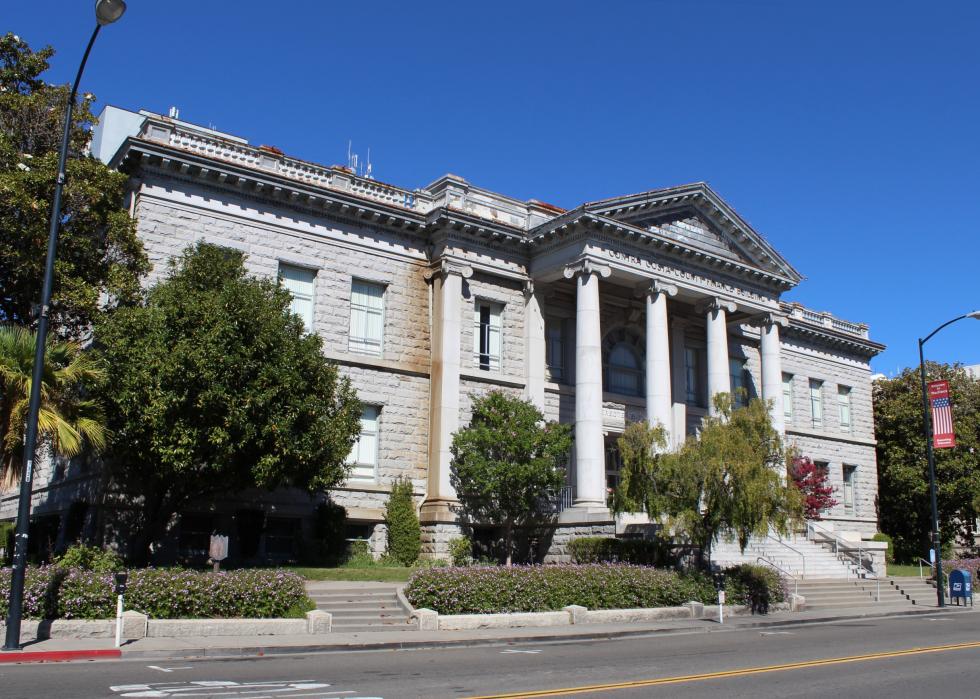
#9. Contra Costa County
--- #39 among all counties nationwide
- 2010 to 2019 percent population change: +11.5%
--- #4 among counties in California, #321 among all counties nationwide
- 2019 population: 1,142,251
--- #9 largest county in California, #38 largest county nationwide

#8. Sacramento County
--- #33 among all counties nationwide
- 2010 to 2019 percent population change: +9.3%
--- #11 among counties in California, #451 among all counties nationwide
- 2019 population: 1,524,553
--- #8 largest county in California, #24 largest county nationwide
#7. San Bernardino County
--- #29 among all counties nationwide
- 2010 to 2019 percent population change: +7.2%
--- #20 among counties in California, #595 among all counties nationwide
- 2019 population: 2,149,031
--- #5 largest county in California, #14 largest county nationwide
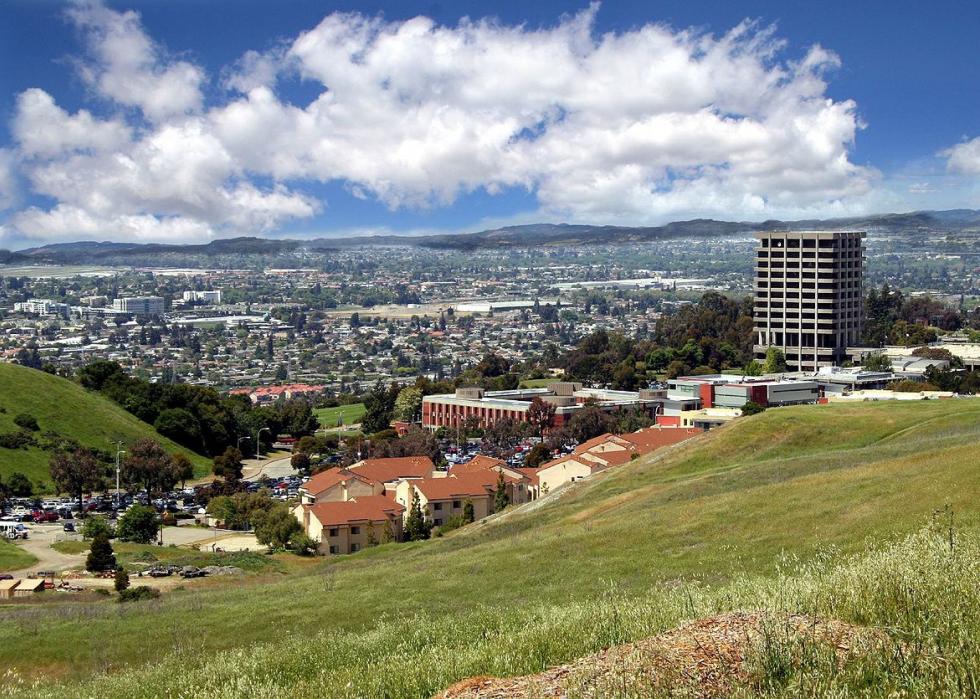
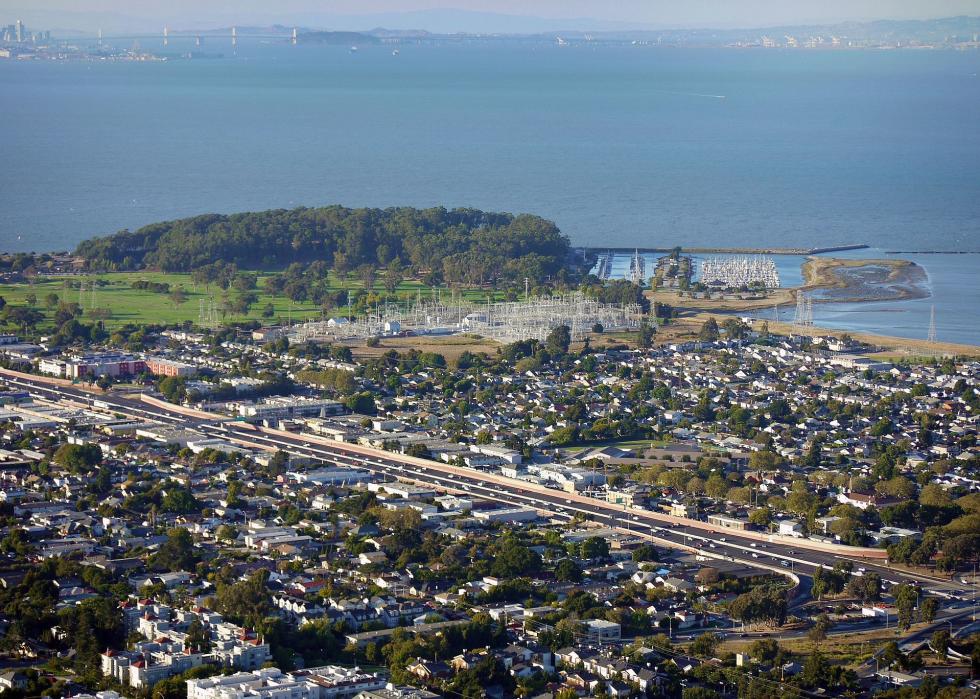
#6. Alameda County
--- #23 among all counties nationwide
- 2010 to 2019 percent population change: +12.1%
--- #3 among counties in California, #294 among all counties nationwide
- 2019 population: 1,656,754
--- #7 largest county in California, #20 largest county nationwide
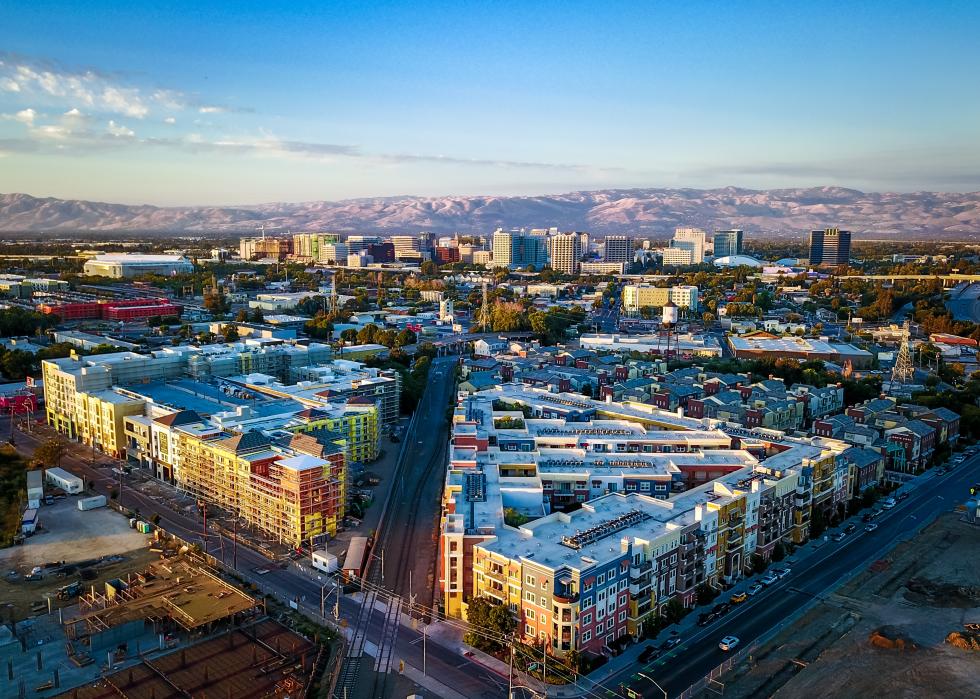
#5. Santa Clara County
--- #22 among all counties nationwide
- 2010 to 2019 percent population change: +10.8%
--- #6 among counties in California, #353 among all counties nationwide
- 2019 population: 1,927,470
--- #6 largest county in California, #17 largest county nationwide

#4. Orange County
--- #19 among all counties nationwide
- 2010 to 2019 percent population change: +6.8%
--- #22 among counties in California, #624 among all counties nationwide
- 2019 population: 3,168,044
--- #3 largest county in California, #6 largest county nationwide

#3. San Diego County
--- #8 among all counties nationwide
- 2010 to 2019 percent population change: +9.7%
--- #10 among counties in California, #416 among all counties nationwide
- 2019 population: 3,316,073
--- #2 largest county in California, #5 largest county nationwide
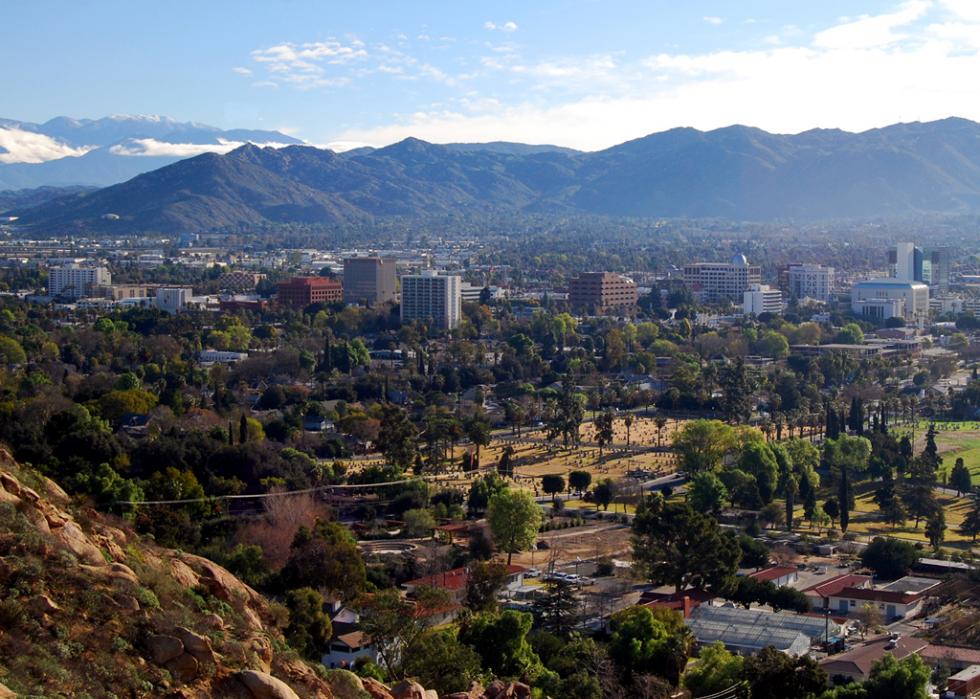
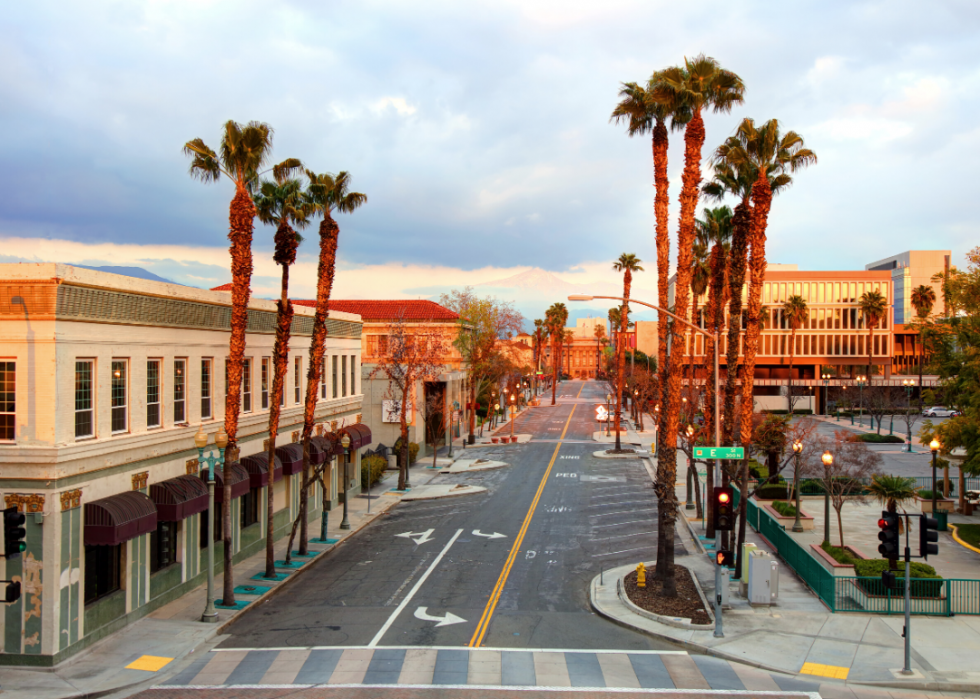
#2. Riverside County
--- #7 among all counties nationwide
- 2010 to 2019 percent population change: +14.3%
--- #2 among counties in California, #211 among all counties nationwide
- 2019 population: 2,411,439
--- #4 largest county in California, #10 largest county nationwide
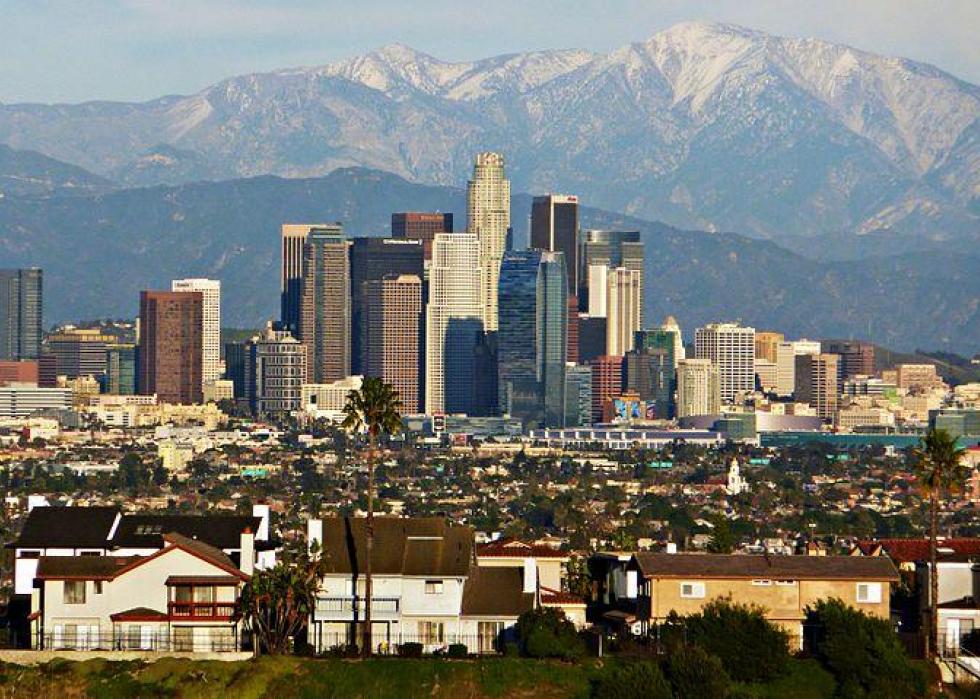
#1. Los Angeles County
--- #3 among all counties nationwide
- 2010 to 2019 percent population change: +3.3%
--- #33 among counties in California, #1,001 among all counties nationwide
- 2019 population: 10,081,570
--- #1 largest county in California, #1 largest county nationwide


