
Fastest-growing counties in Michigan
Fastest-growing counties in Michigan
From 2018 to 2019, the U.S. population grew by .48%, its slowest rate in 100 years. Declining births, increasing deaths largely due to the graying Baby Boomer population, and a crackdown on immigration have contributed to many states seeing net population losses in recent years.
But in other pockets of the country, populations are growing. These shifts can be due to job opportunities, high quality of life, easy commutability to job centers, low rents, or any combination of these or other factors. Stacker compiled a list of the fastest-growing counties in Michigan using data from the U.S. Census Bureau. Counties are ranked by the highest population growth from 2010 to 2019, based on 5-year estimates.
A county typically sees population growth as a “bedroom community” (a municipality with an atypically large commuting population) to a large city. These communities are typically quieter than their feeder cities, offer lower rents and a higher quality of living, and are remote enough to be immune to the feeder city’s crime, traffic, and crowds. Keep reading to see if your home county made the list.

#30. Montcalm County
--- #1,774 among all counties nationwide
- 2010 to 2019 percent population change: -0.2%
--- #26 among counties in Michigan, #1,600 among all counties nationwide
- 2019 population: 63,413
--- #31 largest county in Michigan, #838 largest county nationwide

#29. Houghton County
--- #1,742 among all counties nationwide
- 2010 to 2019 percent population change: -0.3%
--- #28 among counties in Michigan, #1,628 among all counties nationwide
- 2019 population: 36,070
--- #43 largest county in Michigan, #1,271 largest county nationwide

#28. Leelanau County
--- #1,712 among all counties nationwide
- 2010 to 2019 percent population change: -0.5%
--- #29 among counties in Michigan, #1,657 among all counties nationwide
- 2019 population: 21,652
--- #63 largest county in Michigan, #1,744 largest county nationwide

#27. Benzie County
--- #1,686 among all counties nationwide
- 2010 to 2019 percent population change: -0.5%
--- #30 among counties in Michigan, #1,664 among all counties nationwide
- 2019 population: 17,615
--- #65 largest county in Michigan, #1,942 largest county nationwide

#26. Charlevoix County
--- #1,615 among all counties nationwide
- 2010 to 2019 percent population change: -0.2%
--- #25 among counties in Michigan, #1,586 among all counties nationwide
- 2019 population: 26,188
--- #52 largest county in Michigan, #1,558 largest county nationwide

#25. Keweenaw County
--- #1,573 among all counties nationwide
- 2010 to 2019 percent population change: -0.5%
--- #31 among counties in Michigan, #1,668 among all counties nationwide
- 2019 population: 2,111
--- #83 largest county in Michigan, #3,040 largest county nationwide

#24. Otsego County
--- #1,495 among all counties nationwide
- 2010 to 2019 percent population change: +0.2%
--- #23 among counties in Michigan, #1,526 among all counties nationwide
- 2019 population: 24,490
--- #57 largest county in Michigan, #1,626 largest county nationwide

#23. Missaukee County
--- #1,471 among all counties nationwide
- 2010 to 2019 percent population change: +0.4%
--- #21 among counties in Michigan, #1,470 among all counties nationwide
- 2019 population: 15,028
--- #69 largest county in Michigan, #2,095 largest county nationwide

#22. Muskegon County
--- #1,462 among all counties nationwide
- 2010 to 2019 percent population change: +0.0%
--- #24 among counties in Michigan, #1,554 among all counties nationwide
- 2019 population: 173,297
--- #12 largest county in Michigan, #377 largest county nationwide

#21. Marquette County
--- #1,365 among all counties nationwide
- 2010 to 2019 percent population change: +0.3%
--- #22 among counties in Michigan, #1,506 among all counties nationwide
- 2019 population: 66,686
--- #29 largest county in Michigan, #798 largest county nationwide

#20. Kalkaska County
--- #1,350 among all counties nationwide
- 2010 to 2019 percent population change: +1.1%
--- #18 among counties in Michigan, #1,359 among all counties nationwide
- 2019 population: 17,585
--- #66 largest county in Michigan, #1,944 largest county nationwide

#19. Lake County
--- #1,322 among all counties nationwide
- 2010 to 2019 percent population change: +2.0%
--- #12 among counties in Michigan, #1,214 among all counties nationwide
- 2019 population: 11,852
--- #72 largest county in Michigan, #2,300 largest county nationwide

#18. Mason County
--- #1,307 among all counties nationwide
- 2010 to 2019 percent population change: +0.8%
--- #20 among counties in Michigan, #1,403 among all counties nationwide
- 2019 population: 28,954
--- #49 largest county in Michigan, #1,457 largest county nationwide

#17. Emmet County
--- #1,258 among all counties nationwide
- 2010 to 2019 percent population change: +0.9%
--- #19 among counties in Michigan, #1,390 among all counties nationwide
- 2019 population: 33,104
--- #46 largest county in Michigan, #1,354 largest county nationwide

#16. Mecosta County
--- #1,148 among all counties nationwide
- 2010 to 2019 percent population change: +1.2%
--- #17 among counties in Michigan, #1,337 among all counties nationwide
- 2019 population: 43,251
--- #39 largest county in Michigan, #1,108 largest county nationwide

#15. Wexford County
--- #1,120 among all counties nationwide
- 2010 to 2019 percent population change: +1.8%
--- #13 among counties in Michigan, #1,230 among all counties nationwide
- 2019 population: 33,256
--- #45 largest county in Michigan, #1,347 largest county nationwide

#14. Barry County
--- #989 among all counties nationwide
- 2010 to 2019 percent population change: +1.6%
--- #15 among counties in Michigan, #1,267 among all counties nationwide
- 2019 population: 60,540
--- #33 largest county in Michigan, #860 largest county nationwide

#13. Isabella County
--- #923 among all counties nationwide
- 2010 to 2019 percent population change: +1.8%
--- #14 among counties in Michigan, #1,240 among all counties nationwide
- 2019 population: 70,688
--- #27 largest county in Michigan, #761 largest county nationwide

#12. Eaton County
--- #871 among all counties nationwide
- 2010 to 2019 percent population change: +1.3%
--- #16 among counties in Michigan, #1,312 among all counties nationwide
- 2019 population: 109,456
--- #19 largest county in Michigan, #552 largest county nationwide

#11. Clinton County
--- #584 among all counties nationwide
- 2010 to 2019 percent population change: +5.6%
--- #6 among counties in Michigan, #737 among all counties nationwide
- 2019 population: 78,389
--- #25 largest county in Michigan, #710 largest county nationwide

#10. Allegan County
--- #553 among all counties nationwide
- 2010 to 2019 percent population change: +4.3%
--- #9 among counties in Michigan, #878 among all counties nationwide
- 2019 population: 116,143
--- #18 largest county in Michigan, #531 largest county nationwide

#9. Grand Traverse County
--- #496 among all counties nationwide
- 2010 to 2019 percent population change: +7.1%
--- #3 among counties in Michigan, #607 among all counties nationwide
- 2019 population: 92,181
--- #22 largest county in Michigan, #636 largest county nationwide

#8. Livingston County
--- #428 among all counties nationwide
- 2010 to 2019 percent population change: +4.6%
--- #7 among counties in Michigan, #840 among all counties nationwide
- 2019 population: 189,754
--- #11 largest county in Michigan, #346 largest county nationwide

#7. Ingham County
--- #414 among all counties nationwide
- 2010 to 2019 percent population change: +3.3%
--- #11 among counties in Michigan, #1,009 among all counties nationwide
- 2019 population: 290,587
--- #7 largest county in Michigan, #236 largest county nationwide

#6. Kalamazoo County
--- #311 among all counties nationwide
- 2010 to 2019 percent population change: +6.3%
--- #5 among counties in Michigan, #668 among all counties nationwide
- 2019 population: 262,745
--- #9 largest county in Michigan, #260 largest county nationwide
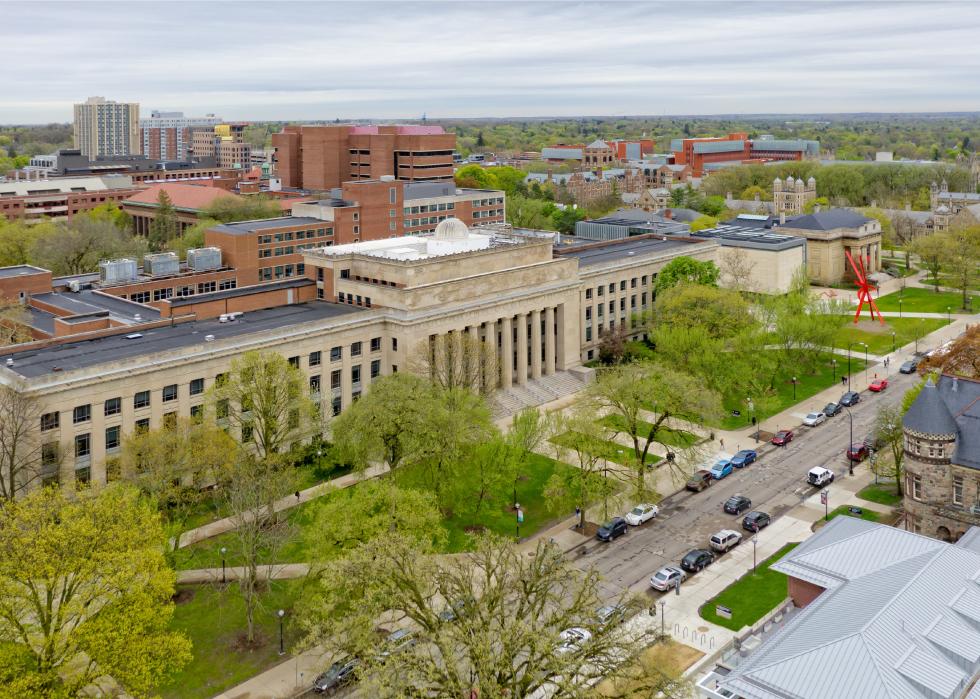
#5. Washtenaw County
--- #236 among all counties nationwide
- 2010 to 2019 percent population change: +6.7%
--- #4 among counties in Michigan, #634 among all counties nationwide
- 2019 population: 367,000
--- #6 largest county in Michigan, #190 largest county nationwide

#4. Ottawa County
--- #220 among all counties nationwide
- 2010 to 2019 percent population change: +9.6%
--- #1 among counties in Michigan, #422 among all counties nationwide
- 2019 population: 286,558
--- #8 largest county in Michigan, #241 largest county nationwide

#3. Macomb County
--- #162 among all counties nationwide
- 2010 to 2019 percent population change: +3.9%
--- #10 among counties in Michigan, #924 among all counties nationwide
- 2019 population: 870,325
--- #3 largest county in Michigan, #65 largest county nationwide

#2. Kent County
--- #107 among all counties nationwide
- 2010 to 2019 percent population change: +8.1%
--- #2 among counties in Michigan, #531 among all counties nationwide
- 2019 population: 648,121
--- #4 largest county in Michigan, #102 largest county nationwide

#1. Oakland County
--- #102 among all counties nationwide
- 2010 to 2019 percent population change: +4.3%
--- #8 among counties in Michigan, #871 among all counties nationwide
- 2019 population: 1,253,185
--- #2 largest county in Michigan, #32 largest county nationwide


