
Fastest-growing counties in Texas
Fastest-growing counties in Texas
From 2018 to 2019, the U.S. population grew by .48%, its slowest rate in 100 years. Declining births, increasing deaths largely due to the graying Baby Boomer population, and a crackdown on immigration have contributed to many states seeing net population losses in recent years.
But in other pockets of the country, populations are growing. These shifts can be due to job opportunities, high quality of life, easy commutability to job centers, low rents, or any combination of these or other factors. Stacker compiled a list of the fastest-growing counties in Texas using data from the U.S. Census Bureau. Counties are ranked by the highest population growth from 2010 to 2019, based on 5-year estimates.
A county typically sees population growth as a “bedroom community” (a municipality with an atypically large commuting population) to a large city. These communities are typically quieter than their feeder cities, offer lower rents and a higher quality of living, and are remote enough to be immune to the feeder city’s crime, traffic, and crowds. Keep reading to see if your home county made the list.

#30. Parker County
--- #248 among all counties nationwide
- 2010 to 2019 percent population change: +19.3%
--- #26 among counties in Texas, #113 among all counties nationwide
- 2019 population: 133,811
--- #33 largest county in Texas, #475 largest county nationwide

#29. Rockwall County
--- #229 among all counties nationwide
- 2010 to 2019 percent population change: +32.6%
--- #10 among counties in Texas, #27 among all counties nationwide
- 2019 population: 97,175
--- #40 largest county in Texas, #612 largest county nationwide

#28. Smith County
--- #227 among all counties nationwide
- 2010 to 2019 percent population change: +11.8%
--- #55 among counties in Texas, #305 among all counties nationwide
- 2019 population: 227,449
--- #22 largest county in Texas, #293 largest county nationwide

#27. Kaufman County
--- #217 among all counties nationwide
- 2010 to 2019 percent population change: +25.8%
--- #18 among counties in Texas, #55 among all counties nationwide
- 2019 population: 123,804
--- #36 largest county in Texas, #510 largest county nationwide

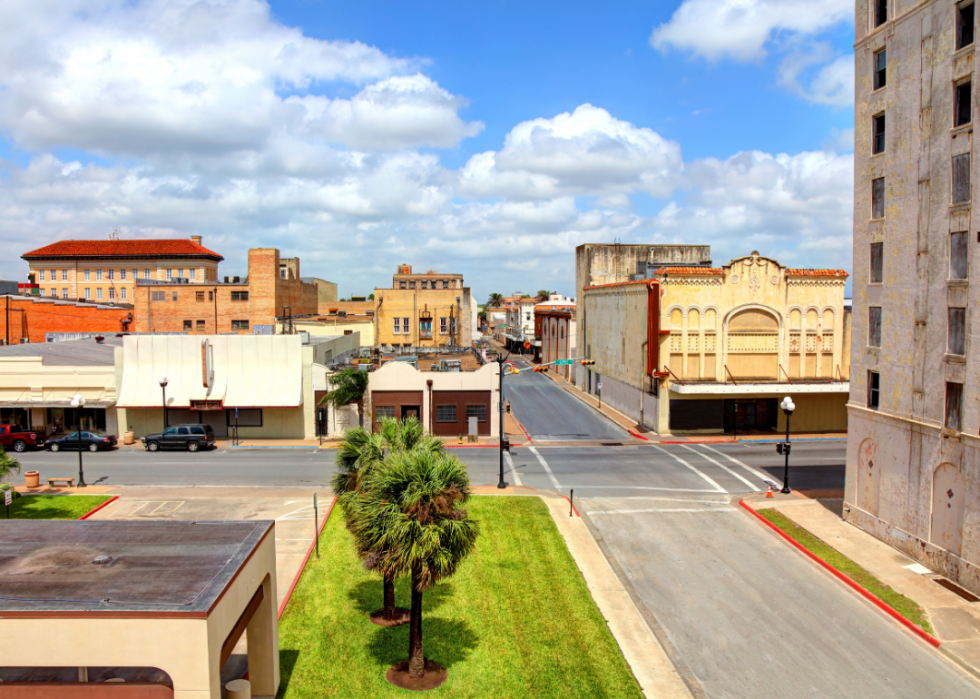
#26. Nueces County
--- #202 among all counties nationwide
- 2010 to 2019 percent population change: +8.1%
--- #76 among counties in Texas, #530 among all counties nationwide
- 2019 population: 361,540
--- #14 largest county in Texas, #193 largest county nationwide

#25. Ector County
--- #197 among all counties nationwide
- 2010 to 2019 percent population change: +20.7%
--- #23 among counties in Texas, #94 among all counties nationwide
- 2019 population: 160,579
--- #28 largest county in Texas, #406 largest county nationwide
#24. Cameron County
--- #194 among all counties nationwide
- 2010 to 2019 percent population change: +7.1%
--- #81 among counties in Texas, #601 among all counties nationwide
- 2019 population: 421,666
--- #13 largest county in Texas, #165 largest county nationwide

#23. Ellis County
--- #180 among all counties nationwide
- 2010 to 2019 percent population change: +21.1%
--- #22 among counties in Texas, #89 among all counties nationwide
- 2019 population: 173,772
--- #25 largest county in Texas, #375 largest county nationwide

#22. Webb County
--- #159 among all counties nationwide
- 2010 to 2019 percent population change: +13.8%
--- #44 among counties in Texas, #226 among all counties nationwide
- 2019 population: 273,526
--- #19 largest county in Texas, #250 largest county nationwide

#21. Lubbock County
--- #153 among all counties nationwide
- 2010 to 2019 percent population change: +12.9%
--- #47 among counties in Texas, #255 among all counties nationwide
- 2019 population: 304,808
--- #18 largest county in Texas, #230 largest county nationwide

#20. Midland County
--- #147 among all counties nationwide
- 2010 to 2019 percent population change: +27.3%
--- #16 among counties in Texas, #49 among all counties nationwide
- 2019 population: 168,167
--- #26 largest county in Texas, #384 largest county nationwide

#19. Guadalupe County
--- #144 among all counties nationwide
- 2010 to 2019 percent population change: +29.5%
--- #12 among counties in Texas, #33 among all counties nationwide
- 2019 population: 158,966
--- #29 largest county in Texas, #413 largest county nationwide

#18. Brazos County
--- #139 among all counties nationwide
- 2010 to 2019 percent population change: +20.3%
--- #24 among counties in Texas, #100 among all counties nationwide
- 2019 population: 222,981
--- #23 largest county in Texas, #302 largest county nationwide

#17. Comal County
--- #132 among all counties nationwide
- 2010 to 2019 percent population change: +37.7%
--- #7 among counties in Texas, #19 among all counties nationwide
- 2019 population: 141,642
--- #30 largest county in Texas, #456 largest county nationwide

#16. Galveston County
--- #112 among all counties nationwide
- 2010 to 2019 percent population change: +16.3%
--- #36 among counties in Texas, #170 among all counties nationwide
- 2019 population: 332,885
--- #17 largest county in Texas, #207 largest county nationwide

#15. Bell County
--- #98 among all counties nationwide
- 2010 to 2019 percent population change: +18.3%
--- #29 among counties in Texas, #126 among all counties nationwide
- 2019 population: 348,574
--- #16 largest county in Texas, #200 largest county nationwide

#14. Brazoria County
--- #88 among all counties nationwide
- 2010 to 2019 percent population change: +20.0%
--- #25 among counties in Texas, #103 among all counties nationwide
- 2019 population: 360,677
--- #15 largest county in Texas, #195 largest county nationwide

#13. El Paso County
--- #79 among all counties nationwide
- 2010 to 2019 percent population change: +8.3%
--- #74 among counties in Texas, #513 among all counties nationwide
- 2019 population: 836,062
--- #8 largest county in Texas, #69 largest county nationwide

#12. Hays County
--- #73 among all counties nationwide
- 2010 to 2019 percent population change: +45.7%
--- #3 among counties in Texas, #9 among all counties nationwide
- 2019 population: 213,366
--- #24 largest county in Texas, #312 largest county nationwide

#11. Hidalgo County
--- #38 among all counties nationwide
- 2010 to 2019 percent population change: +16.0%
--- #37 among counties in Texas, #174 among all counties nationwide
- 2019 population: 855,176
--- #7 largest county in Texas, #67 largest county nationwide

#10. Montgomery County
--- #28 among all counties nationwide
- 2010 to 2019 percent population change: +33.7%
--- #8 among counties in Texas, #25 among all counties nationwide
- 2019 population: 571,949
--- #11 largest county in Texas, #115 largest county nationwide

#9. Williamson County
--- #25 among all counties nationwide
- 2010 to 2019 percent population change: +39.8%
--- #5 among counties in Texas, #16 among all counties nationwide
- 2019 population: 547,604
--- #12 largest county in Texas, #122 largest county nationwide

#8. Denton County
--- #18 among all counties nationwide
- 2010 to 2019 percent population change: +32.8%
--- #9 among counties in Texas, #26 among all counties nationwide
- 2019 population: 833,822
--- #9 largest county in Texas, #70 largest county nationwide

#7. Fort Bend County
--- #15 among all counties nationwide
- 2010 to 2019 percent population change: +41.2%
--- #4 among counties in Texas, #14 among all counties nationwide
- 2019 population: 765,394
--- #10 largest county in Texas, #84 largest county nationwide

#6. Collin County
--- #13 among all counties nationwide
- 2010 to 2019 percent population change: +31.8%
--- #11 among counties in Texas, #31 among all counties nationwide
- 2019 population: 973,977
--- #6 largest county in Texas, #48 largest county nationwide

#5. Travis County
--- #12 among all counties nationwide
- 2010 to 2019 percent population change: +25.2%
--- #19 among counties in Texas, #58 among all counties nationwide
- 2019 population: 1,226,805
--- #5 largest county in Texas, #35 largest county nationwide

#4. Dallas County
--- #10 among all counties nationwide
- 2010 to 2019 percent population change: +12.3%
--- #53 among counties in Texas, #281 among all counties nationwide
- 2019 population: 2,606,868
--- #2 largest county in Texas, #8 largest county nationwide
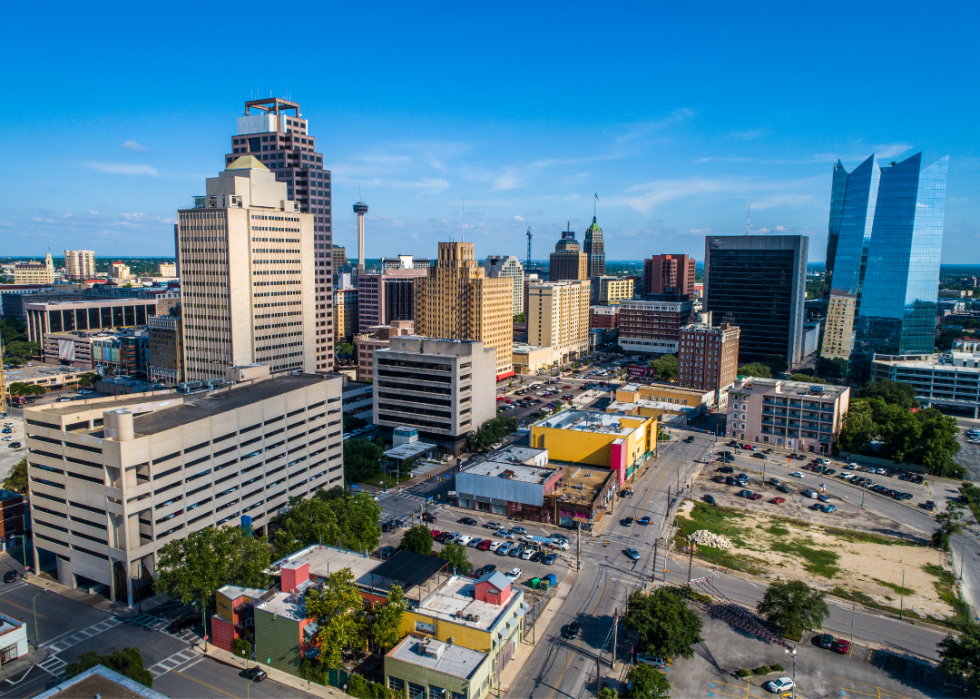
#3. Bexar County
--- #6 among all counties nationwide
- 2010 to 2019 percent population change: +18.4%
--- #28 among counties in Texas, #125 among all counties nationwide
- 2019 population: 1,952,843
--- #4 largest county in Texas, #16 largest county nationwide

#2. Tarrant County
--- #5 among all counties nationwide
- 2010 to 2019 percent population change: +17.6%
--- #31 among counties in Texas, #139 among all counties nationwide
- 2019 population: 2,049,770
--- #3 largest county in Texas, #15 largest county nationwide

#1. Harris County
--- #1 among all counties nationwide
- 2010 to 2019 percent population change: +17.6%
--- #30 among counties in Texas, #138 among all counties nationwide
- 2019 population: 4,646,630
--- #1 largest county in Texas, #3 largest county nationwide


