
Cities with the most expensive homes in Connecticut
Cities with the most expensive homes in Connecticut
Buying a home is an investment—and an increasingly expensive one. The median value of a home in the United States today is more than a quarter of a million dollars with a mortgage, and $167,000 without one. Meanwhile, the median monthly housing cost for a home with a mortgage is $1,558 and $490 without a mortgage.
Stacker compiled a list of cities with the most expensive homes in Connecticut using data from Zillow. Cities are ranked by the Zillow Home Values Index for all homes as of January 2021. Listings and images are from realtor.com.
Home buyers have a lot to consider when house-hunting or looking to invest in rental properties, from the state of the housing market itself to taxes and potential resale value. The housing market grew robust and pricey in the decade following the 2008 recession, and more recently saw a boom during the coronavirus pandemic. Another consideration is the house itself, including what kind of upkeep it requires and those associated costs. Depreciation affects all homes at an average rate of 3.636% each year, which can be a help come tax season if you use your home for business or rentals but may cost you later in capital gains taxes when you sell. Meanwhile, land value tends to increase over time depending on several factors including where the house is located and what amenities and homes are nearby. More desirable neighborhoods allow sellers to charge more; the mantra "location, location, location" has never been more relevant.
Do you live in the area with the most expensive real estate market in your state? Keep reading to find out.
#30. Guilford
- 1 year home value change: +11.4%
- 10 year home value change: +9.8%
- #2,742 most expensive city nationwide
- Pictured: 83 Old Quarry Rd, Guilford ($5.4 million, 5 bedrooms)
#29. Orange
- 1 year home value change: +11.3%
- 10 year home value change: +9.2%
- #2,651 most expensive city nationwide
- Pictured: 899 Rainbow Trl, Orange ($1.1 million, 4 bedrooms)

#28. Old Lyme
- 1 year home value change: +9.2%
- 10 year home value change: +data not available
- #2,589 most expensive city nationwide
- Pictured: 3-4 Bill Hill Rd, Old Lyme ($4.9 million, 4 bedrooms)

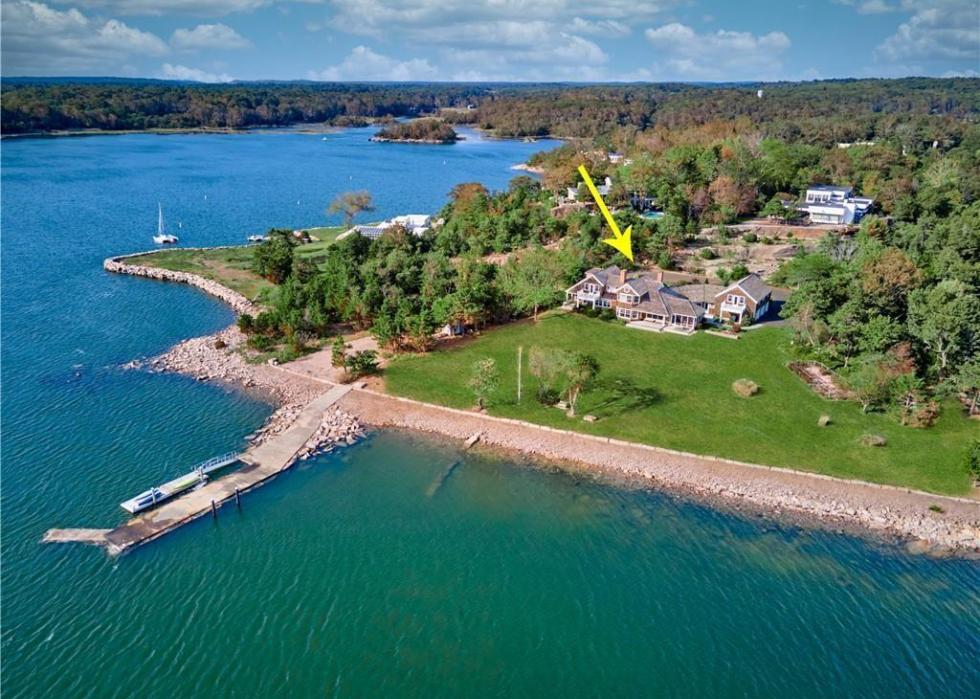
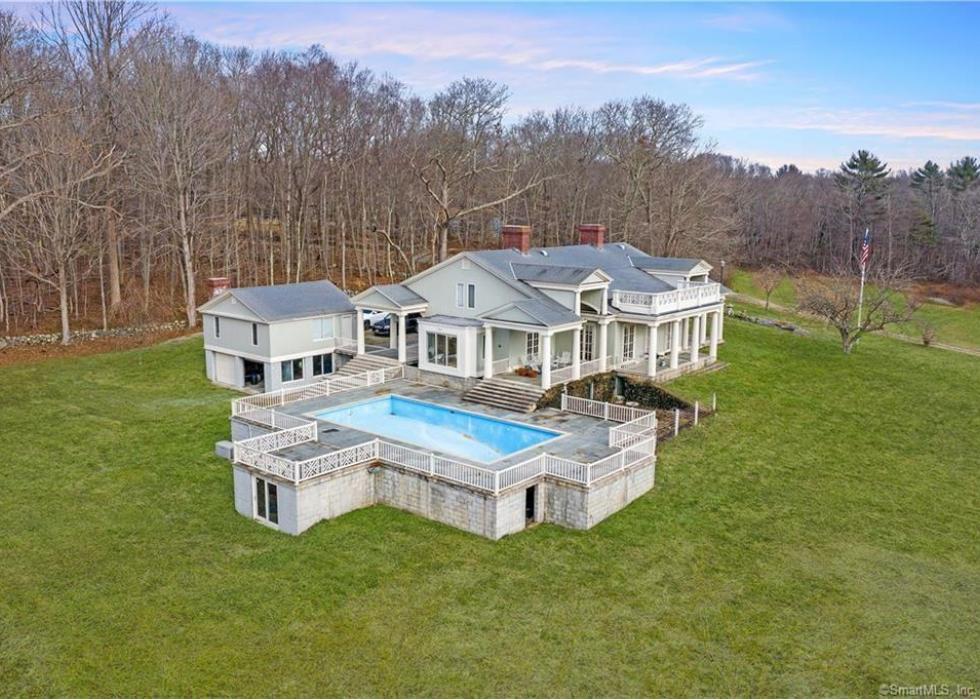
#27. Old Saybrook
- 1 year home value change: +10.6%
- 10 year home value change: +7.2%
- #2,563 most expensive city nationwide
- Pictured: 6 Mohegan Ave, Old Saybrook ($6.0 million, 3 bedrooms)

#26. Cornwall
- 1 year home value change: +17.7%
- 10 year home value change: +16.6%
- #2,516 most expensive city nationwide
- Pictured: 400 5 1/2 Mile Rd, Cornwall ($16.5 million, 10 bedrooms)
#25. Warren
- 1 year home value change: +18.0%
- 10 year home value change: +8.5%
- #2,457 most expensive city nationwide
- Pictured: 293 Lake Rd, Warren ($2.9 million, 5 bedrooms)
#24. Sharon
- 1 year home value change: +14.6%
- 10 year home value change: +11.8%
- #2,447 most expensive city nationwide
- Pictured: 201 Millerton Rd, Sharon ($7.8 million, 5 bedrooms)

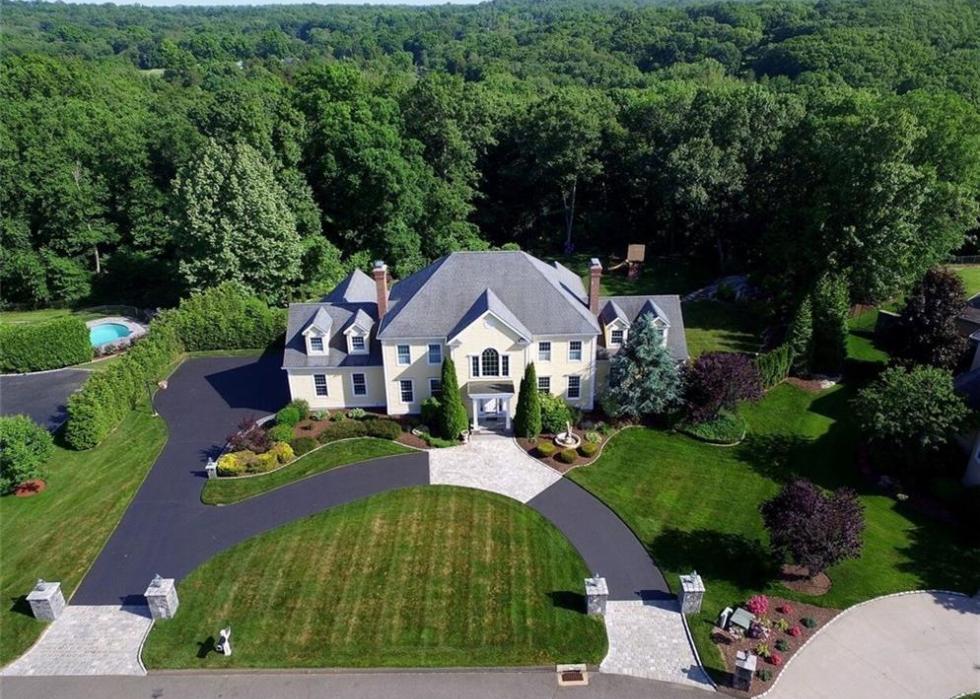
#23. Woodbridge
- 1 year home value change: +10.7%
- 10 year home value change: +6.4%
- #2,441 most expensive city nationwide
- Pictured: 22 Penrhyn Rd, Woodbridge ($1.5 million, 6 bedrooms)
#22. Trumbull
- 1 year home value change: +13.4%
- 10 year home value change: +13.1%
- #2,437 most expensive city nationwide
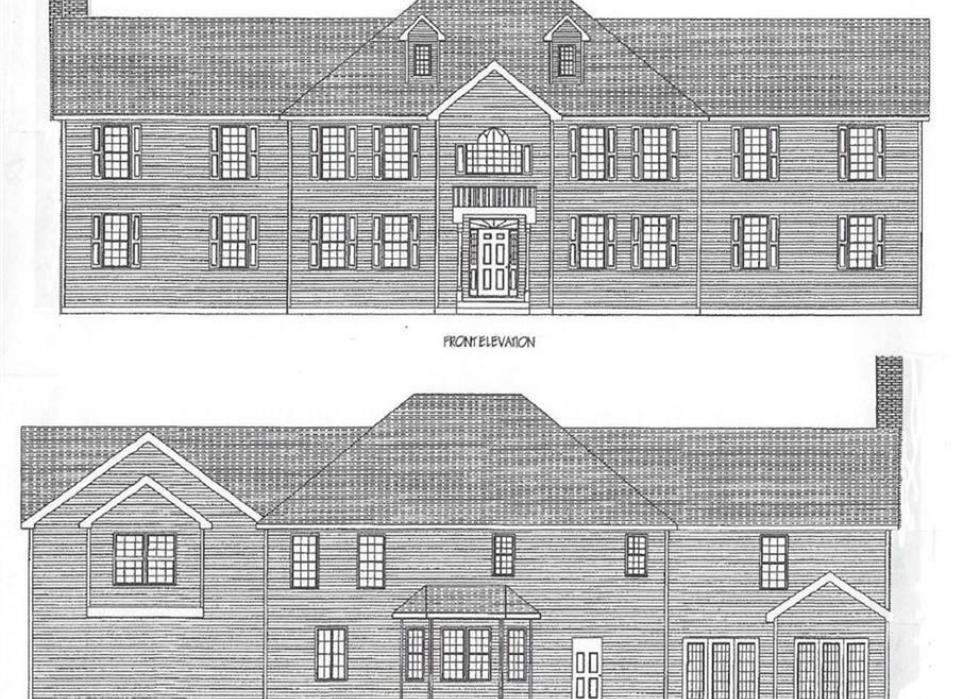
- Pictured: Old Tree Farm Ln Lot 12, Trumbull ($1.3 million, 5 bedrooms)
#21. Newtown
- 1 year home value change: +12.7%
- 10 year home value change: +48.7%
- #2,292 most expensive city nationwide
- Pictured: 206 Hattertown Rd, Newtown ($2.0 million, 8 bedrooms)
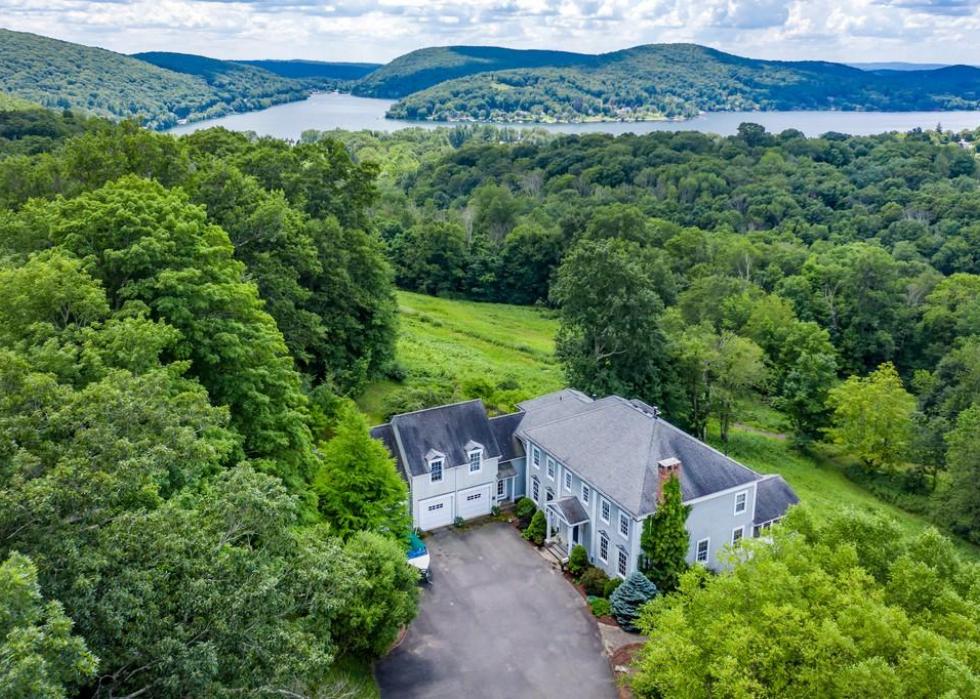
#20. New Preston
- 1 year home value change: +15.1%
- 10 year home value change: +6.2%
- #2,137 most expensive city nationwide
- Pictured: 46 June Rd, Washington ($6.8 million, 5 bedrooms)
#19. Madison
- 1 year home value change: +13.3%
- 10 year home value change: +4.6%
- #2,128 most expensive city nationwide
- Pictured: 36A Liberty St, Madison ($2.7 million, 5 bedrooms)
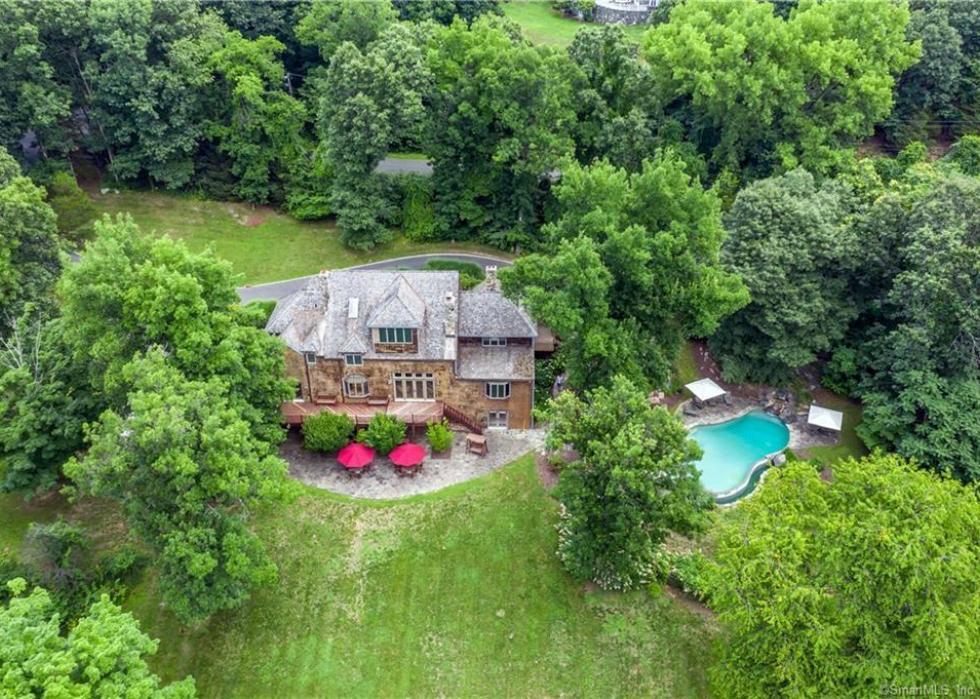
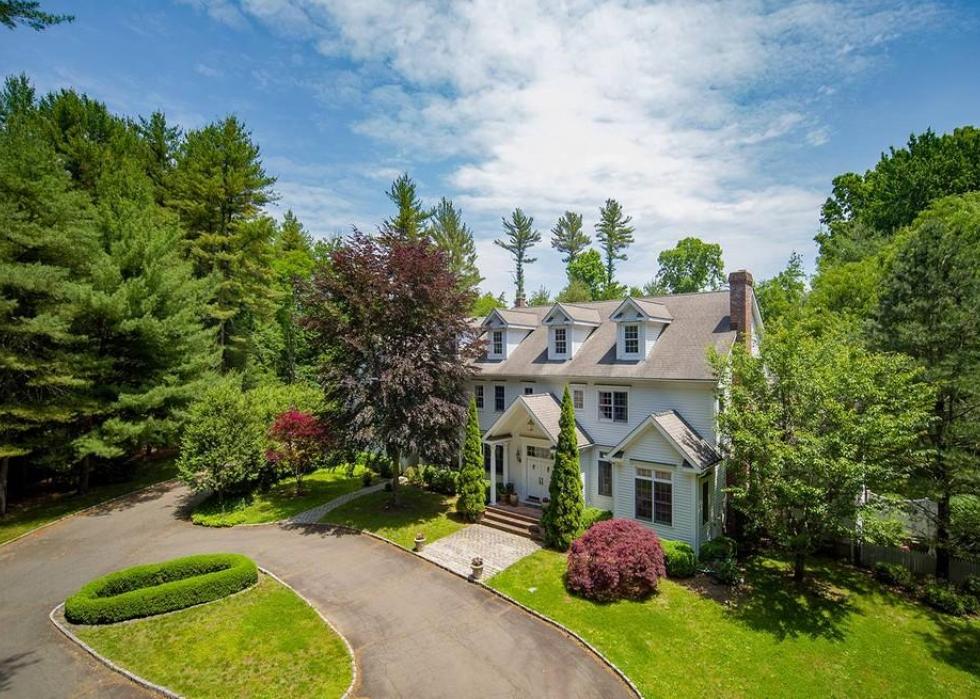
#18. Lyme
- 1 year home value change: +11.7%
- 10 year home value change: +6.4%
- #2,005 most expensive city nationwide
- Pictured: 3-4 Bill Hill Rd, Old Lyme ($4.9 million, 4 bedrooms)
#17. Sherman
- 1 year home value change: +13.7%
- 10 year home value change: +3.8%
- #1,835 most expensive city nationwide
- Pictured: 1 Glen Brook Farm Rd, Sherman ($5.5 million, 6 bedrooms)
#16. Bridgewater
- 1 year home value change: +16.0%
- 10 year home value change: +7.7%
- #1,748 most expensive city nationwide
- Pictured: 70 Lake Lillinonah Rd S, Bridgewater ($2.9 million, 5 bedrooms)
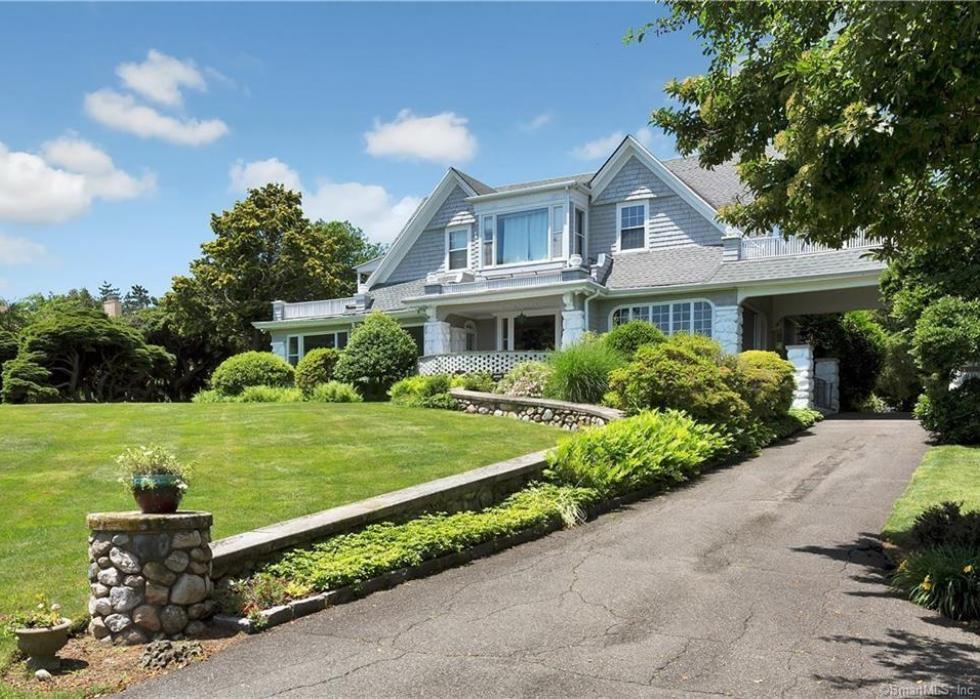
#15. Stamford
- 1 year home value change: +8.1%
- 10 year home value change: +data not available
- #1,569 most expensive city nationwide
- Pictured: 18 Wallacks Dr, Stamford ($9.8 million, 19 bedrooms)

#14. Redding
- 1 year home value change: +10.5%
- 10 year home value change: +8.2%
- #1,173 most expensive city nationwide
- Pictured: 187 Umpawaug Rd, Redding ($16.0 million, 7 bedrooms)
#13. Fairfield
- 1 year home value change: +10.9%
- 10 year home value change: +8.4%
- #1,139 most expensive city nationwide
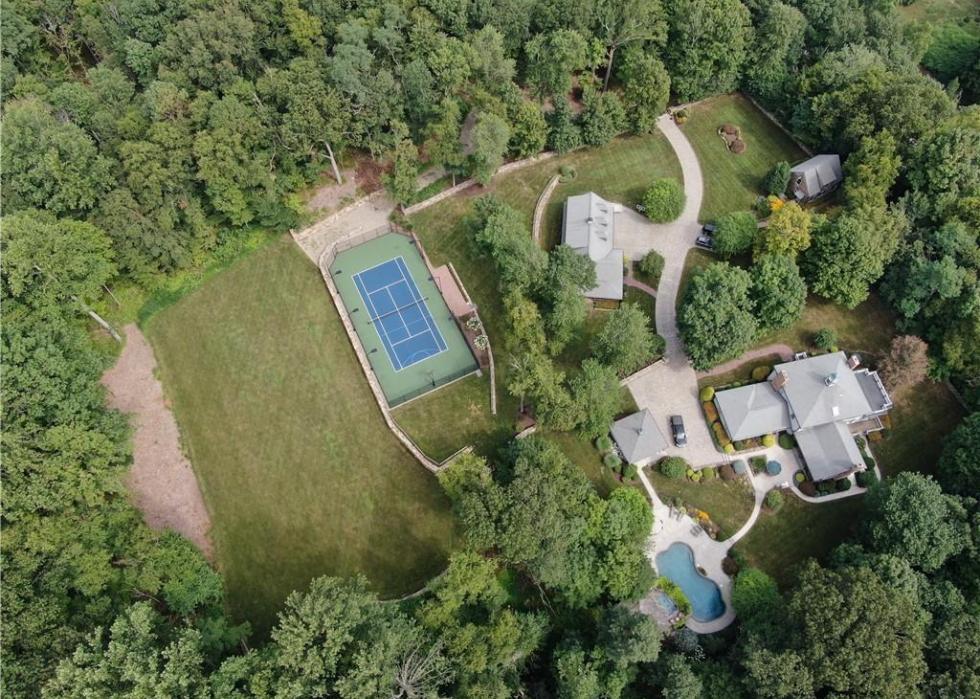
- Pictured: 640 Sasco Hill Rd, Fairfield ($20.0 million, 10 bedrooms)

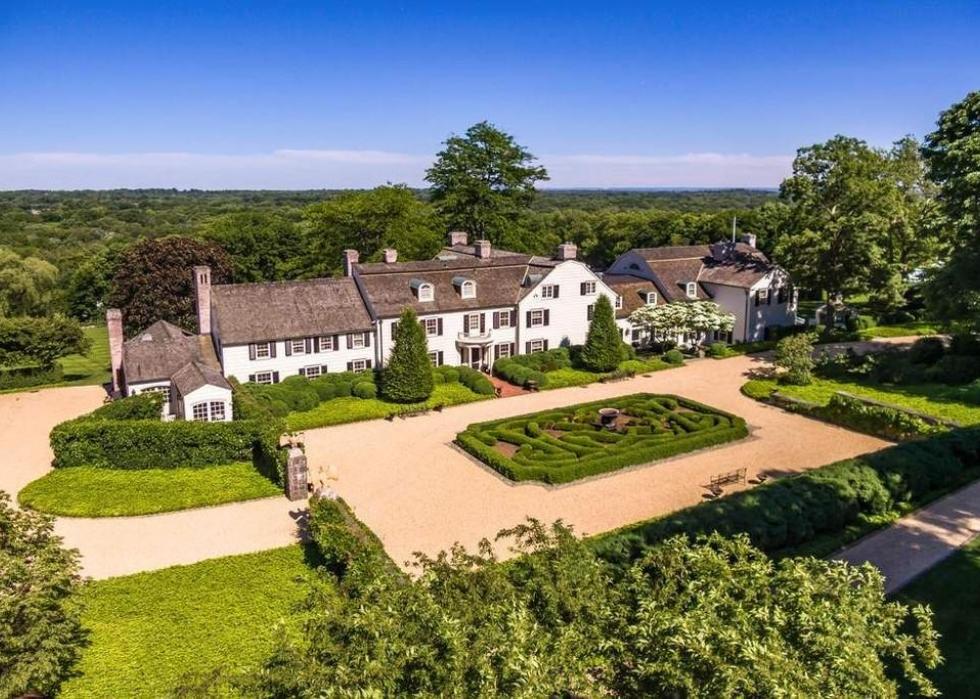
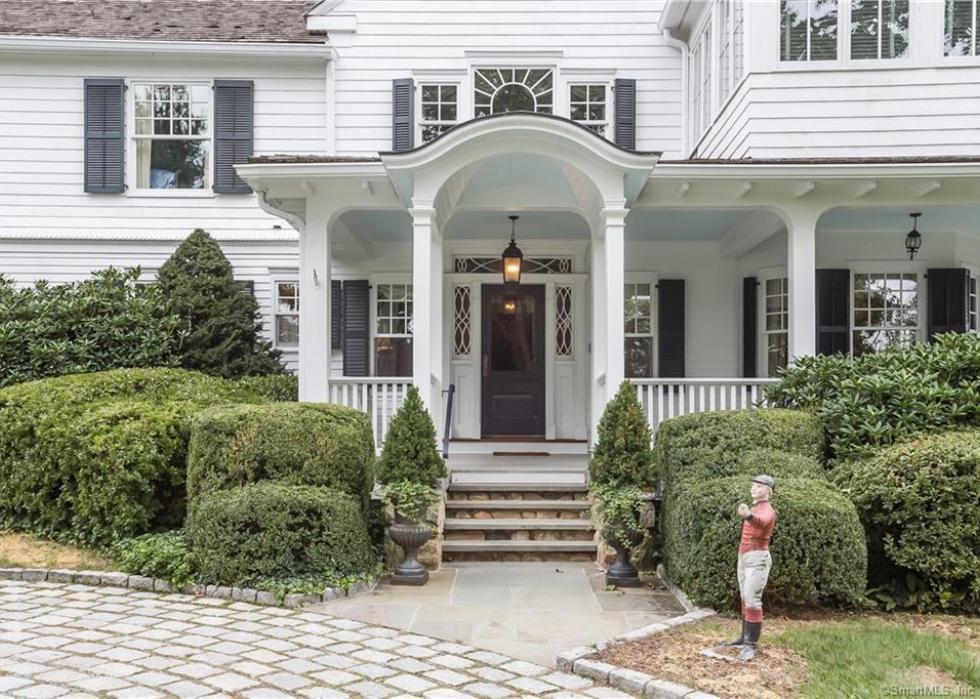
#12. Salisbury
- 1 year home value change: +16.9%
- 10 year home value change: +11.3%
- #1,104 most expensive city nationwide
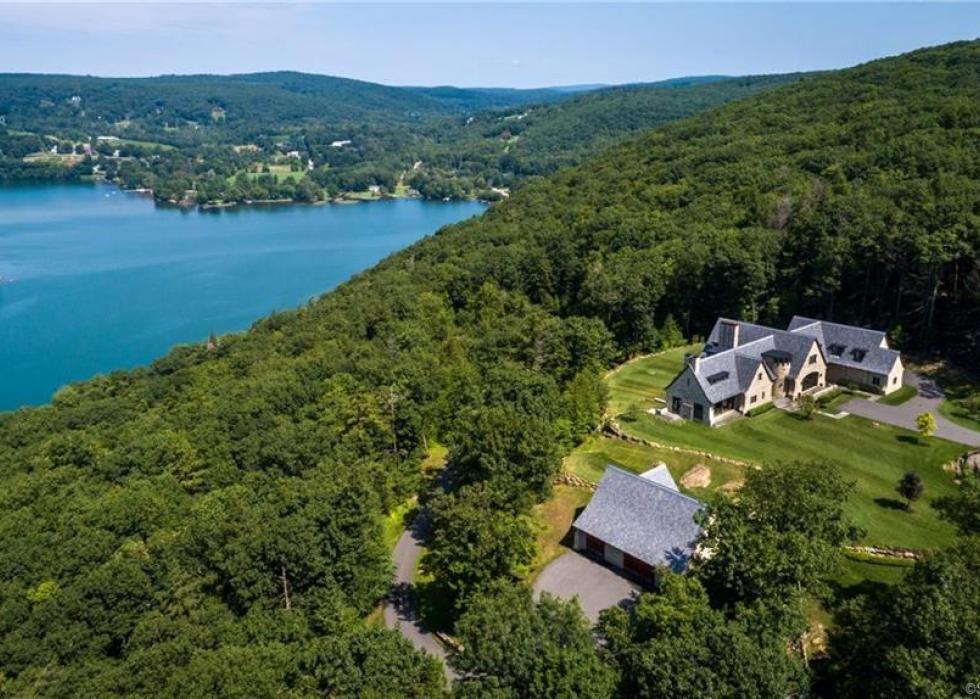
- Pictured: 57 MT Tom Rd, Salisbury ($18.0 million, 9 bedrooms)
#11. Easton
- 1 year home value change: +12.6%
- 10 year home value change: +12.8%
- #989 most expensive city nationwide
- Pictured: 25 Mile Common Rd, Easton ($2.5 million, 7 bedrooms)
#10. Ridgefield
- 1 year home value change: +11.1%
- 10 year home value change: +2.6%
- #923 most expensive city nationwide
- Pictured: 7-11 Old Stagecoach Rd, Ridgefield ($28.5 million, 5 bedrooms)
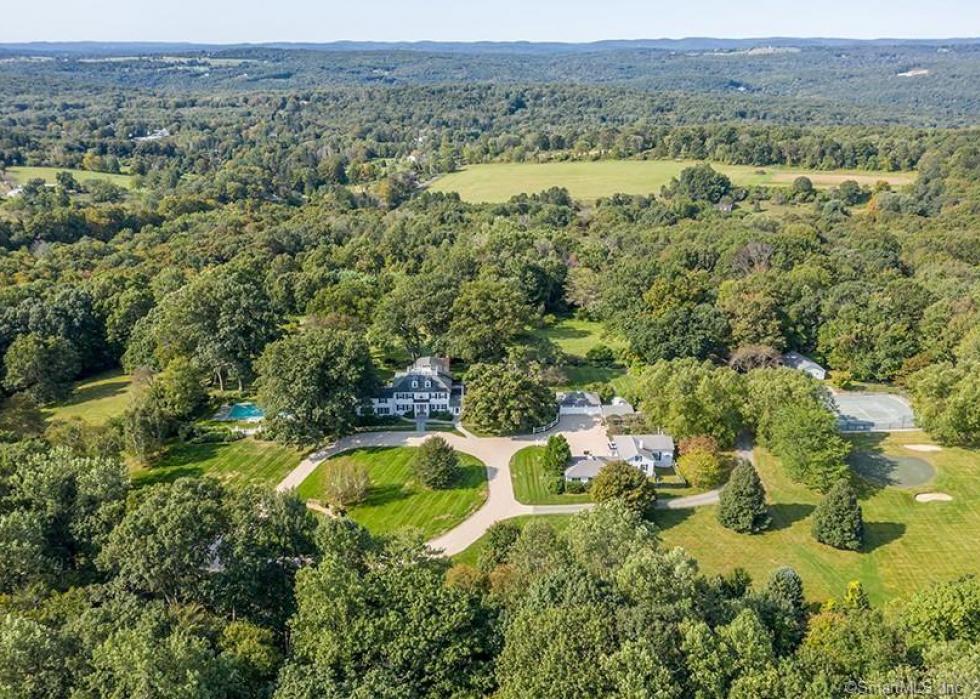
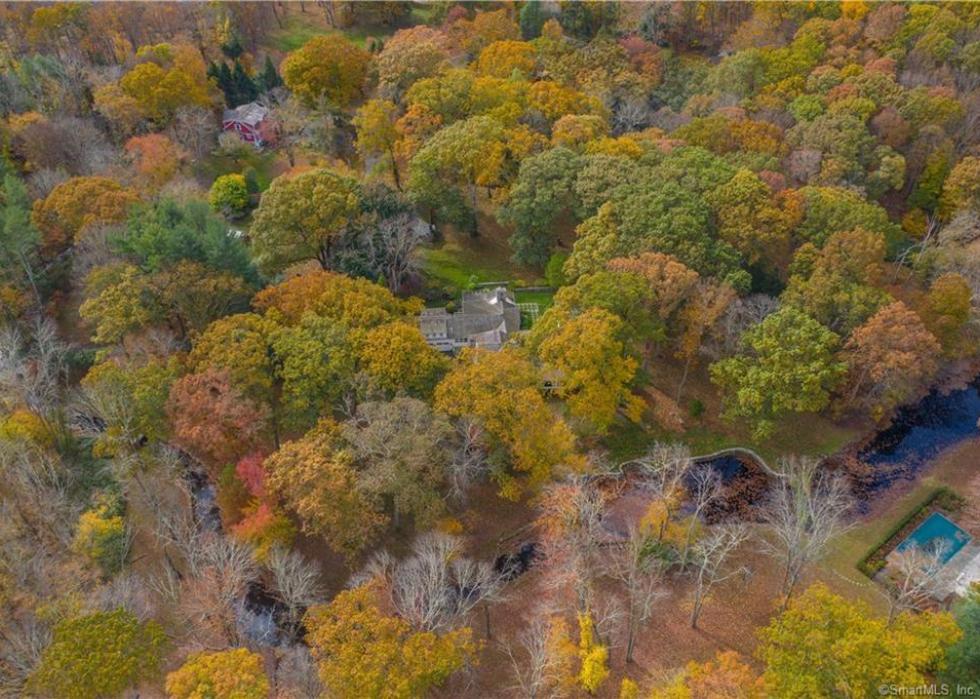
#9. Roxbury
- 1 year home value change: +18.8%
- 10 year home value change: -3.3%
- #859 most expensive city nationwide
- Pictured: 88 Good Hill Rd, Roxbury ($7.5 million, 4 bedrooms)
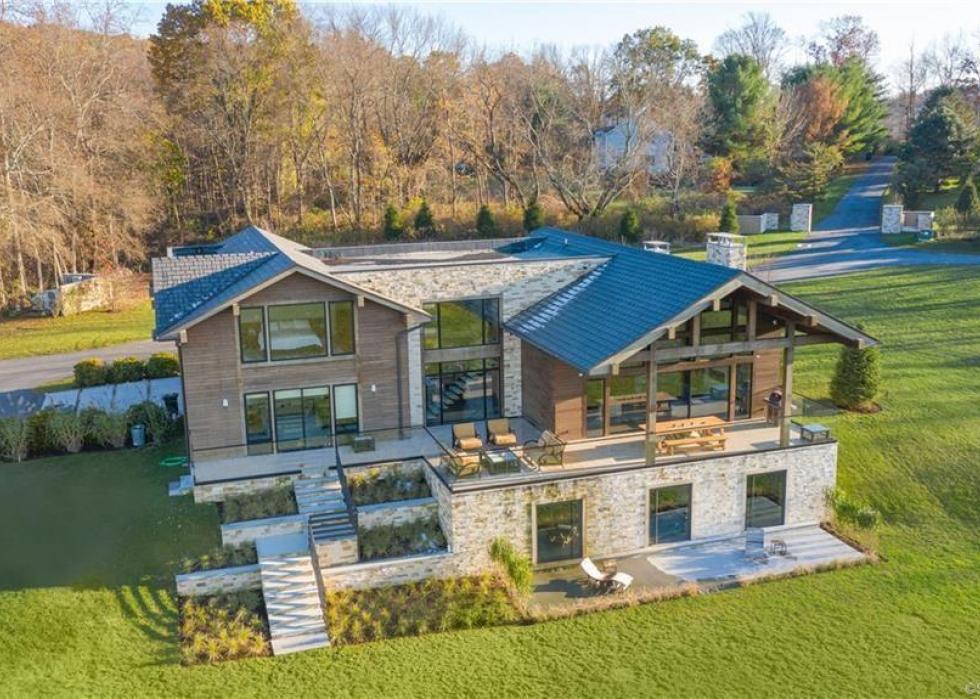
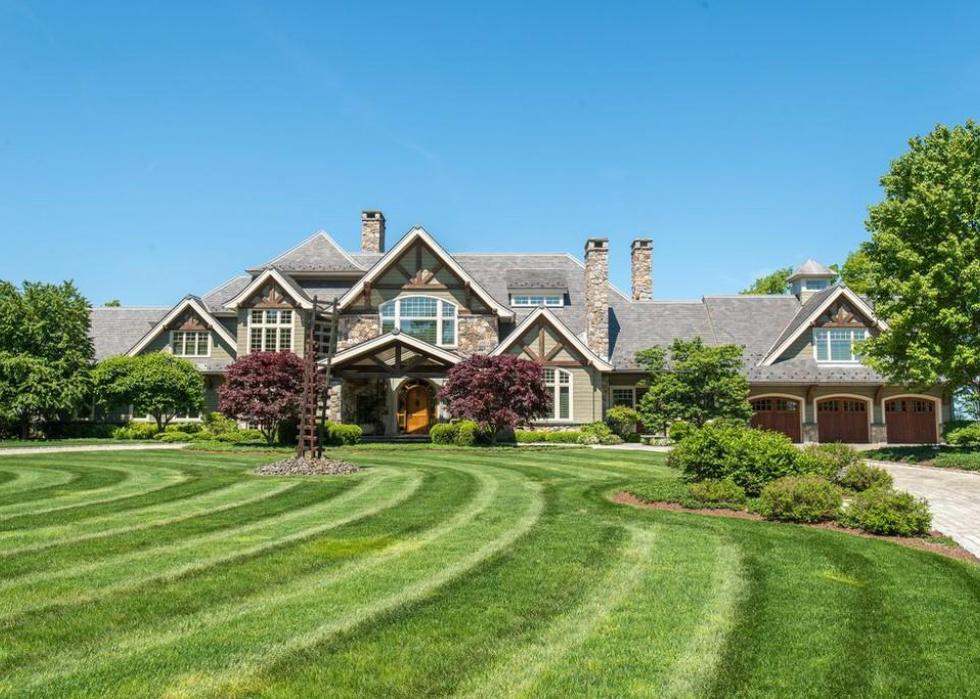
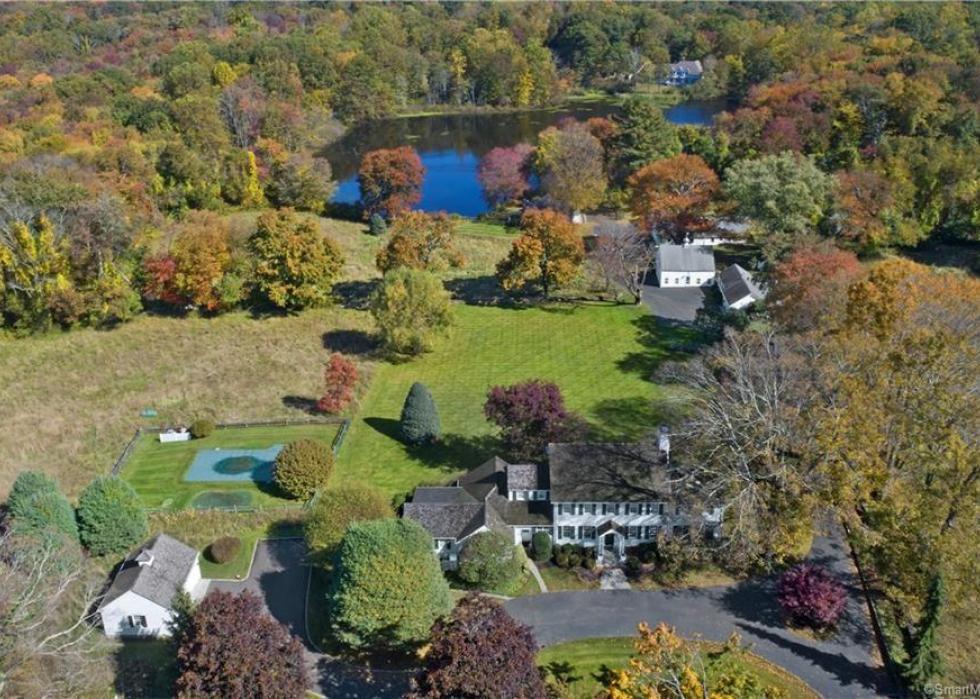
#8. Washington
- 1 year home value change: +17.1%
- 10 year home value change: +2.0%
- #812 most expensive city nationwide
- Pictured: 46 Senff Rd, Washington ($8.8 million, 5 bedrooms)
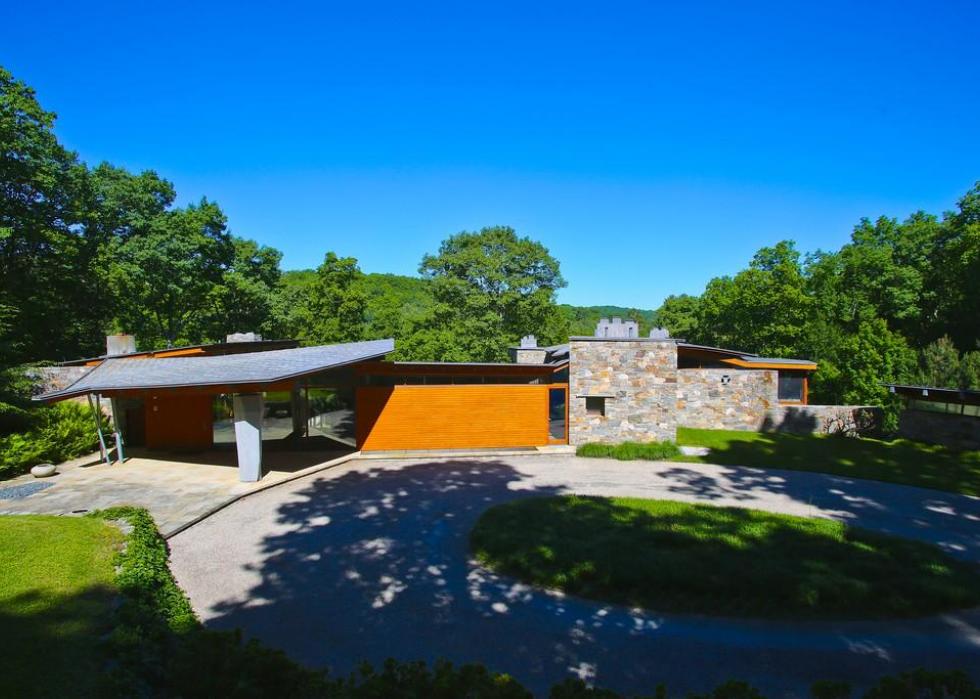
#7. Wilton
- 1 year home value change: +11.5%
- 10 year home value change: -3.0%
- #616 most expensive city nationwide
- Pictured: 90 Hurlbutt St, Wilton ($3.5 million, 4 bedrooms)
#6. Weston
- 1 year home value change: +13.5%
- 10 year home value change: -4.0%
- #535 most expensive city nationwide
- Pictured: 232 Newtown Tpke, Weston ($5.2 million, 6 bedrooms)
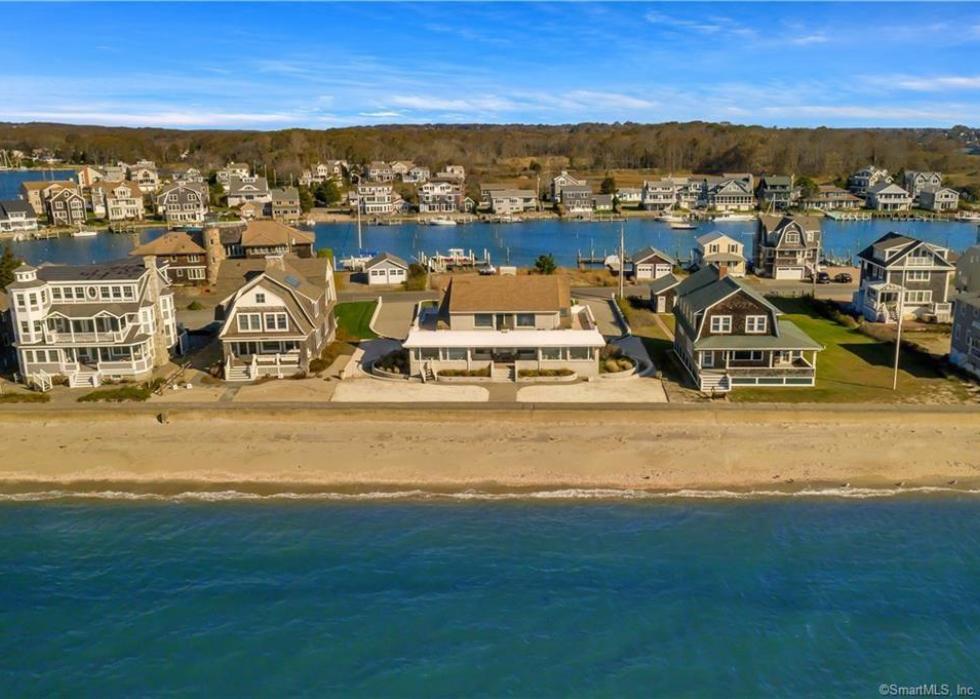
#5. Groton Long Point
- 1 year home value change: +14.1%
- 10 year home value change: +11.3%
- #465 most expensive city nationwide
- Pictured: 88 Boardwalk, Groton ($2.7 million, 2 bedrooms)

#4. Westport
- 1 year home value change: +13.2%
- 10 year home value change: +data not available
- #217 most expensive city nationwide
- Pictured: 5 Hedley Farms Rd, Westport ($12.6 million, 8 bedrooms)

#3. New Canaan
- 1 year home value change: +10.1%
- 10 year home value change: +0.3%
- #177 most expensive city nationwide
- Pictured: 266 Michigan Rd, New Canaan ($15.0 million, 7 bedrooms)
#2. Greenwich
- 1 year home value change: +9.8%
- 10 year home value change: +24.5%
- #156 most expensive city nationwide
- Pictured: 591 Riversville Rd, Greenwich ($40.0 million, 7 bedrooms)
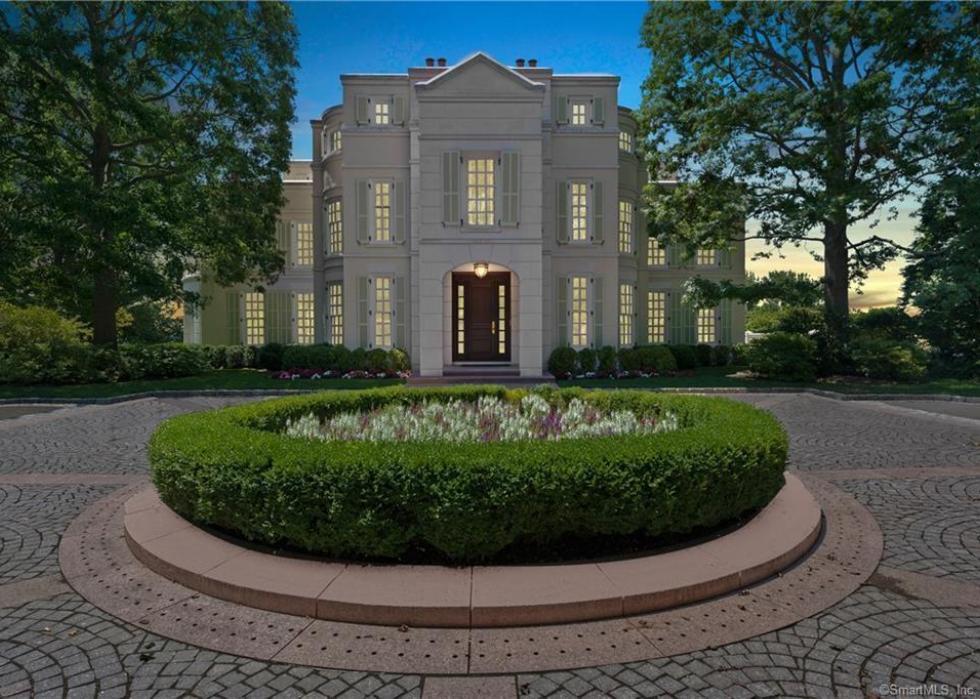
#1. Darien
- 1 year home value change: +9.0%
- 10 year home value change: +6.3%
- #154 most expensive city nationwide
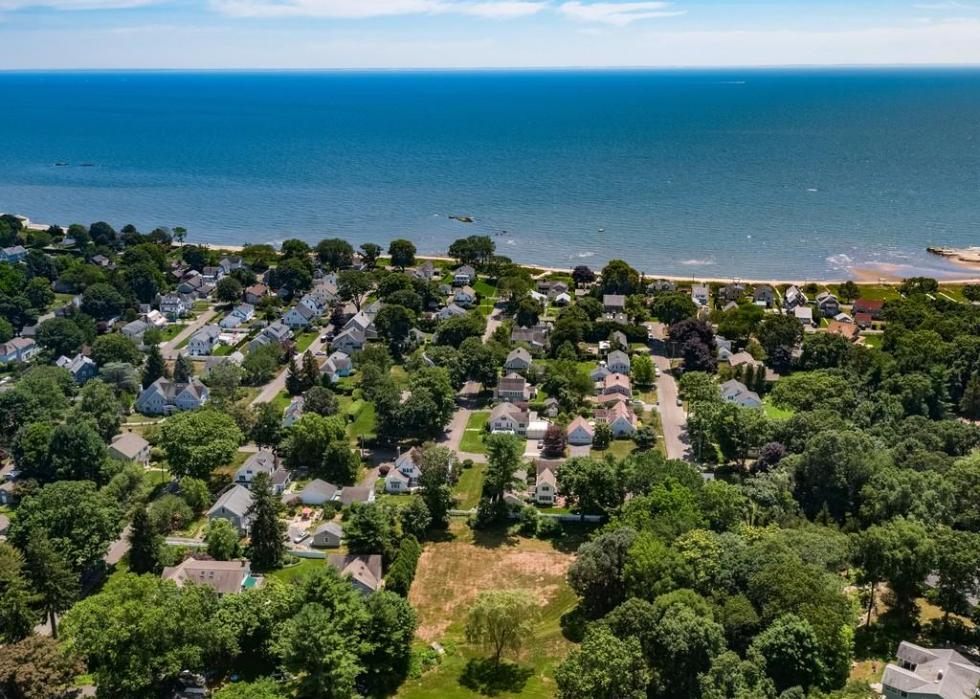
- Pictured: 155 Long Neck Point Rd, Darien ($8.5 million, 8 bedrooms)


