Cities with the most expensive homes in Illinois
Cities with the most expensive homes in Illinois
Buying a home is an investment—and an increasingly expensive one. The median value of a home in the United States today is more than a quarter of a million dollars with a mortgage, and $167,000 without one. Meanwhile, the median monthly housing cost for a home with a mortgage is $1,558 and $490 without a mortgage.
Stacker compiled a list of cities with the most expensive homes in Illinois using data from Zillow. Cities are ranked by the Zillow Home Values Index for all homes as of January 2021. Listings and images are from realtor.com.
Home buyers have a lot to consider when house-hunting or looking to invest in rental properties, from the state of the housing market itself to taxes and potential resale value. The housing market grew robust and pricey in the decade following the 2008 recession, and more recently saw a boom during the coronavirus pandemic. Another consideration is the house itself, including what kind of upkeep it requires and those associated costs. Depreciation affects all homes at an average rate of 3.636% each year, which can be a help come tax season if you use your home for business or rentals but may cost you later in capital gains taxes when you sell. Meanwhile, land value tends to increase over time depending on several factors including where the house is located and what amenities and homes are nearby. More desirable neighborhoods allow sellers to charge more; the mantra "location, location, location" has never been more relevant.
Do you live in the area with the most expensive real estate market in your state? Keep reading to find out.
#30. Hawthorn Woods
- 1 year home value change: +1.9%
- 10 year home value change: -0.4%
- #1,931 most expensive city nationwide
- Pictured: 25147 N Gilmer Rd, Hawthorn Woods ($2.2 million, 5 bedrooms)

#29. Lincolnshire
- 1 year home value change: +4.8%
- 10 year home value change: +10.2%
- #1,784 most expensive city nationwide
- Pictured: 306 Briarwood Ln, Lincolnshire ($1.7 million, 5 bedrooms)

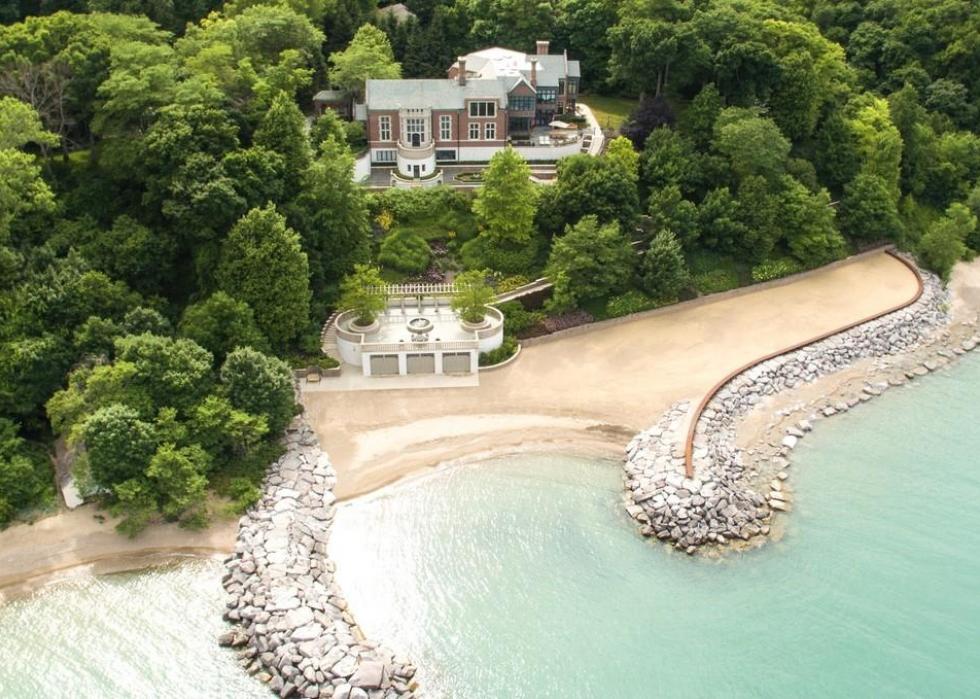
#28. Highland Park
- 1 year home value change: +6.7%
- 10 year home value change: +12.6%
- #1,715 most expensive city nationwide
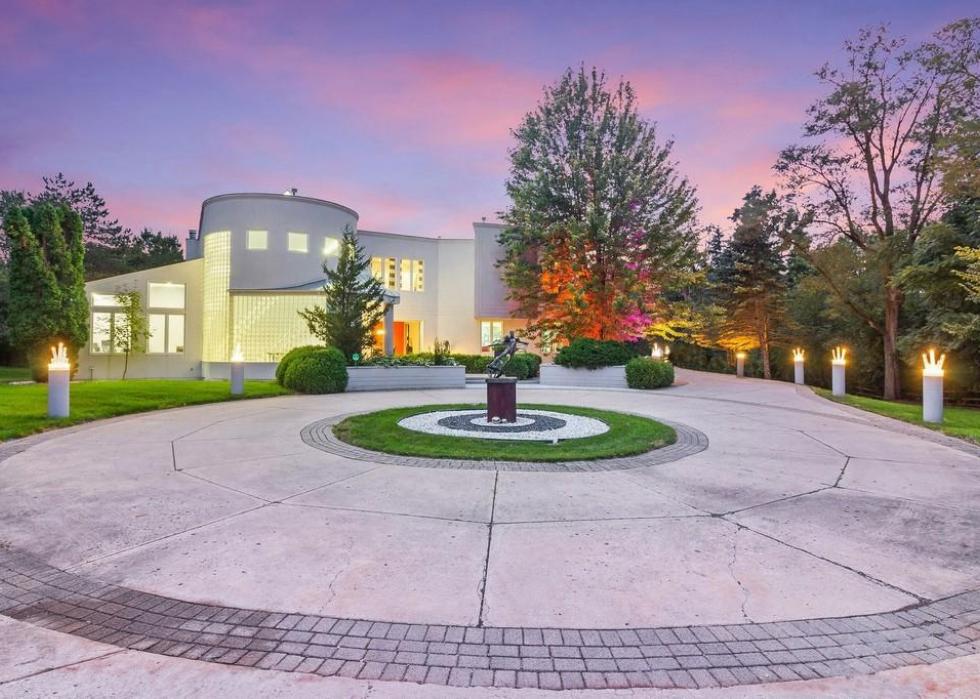
- Pictured: 2700 Point Ln, Highland Park ($14.9 million, 9 bedrooms)
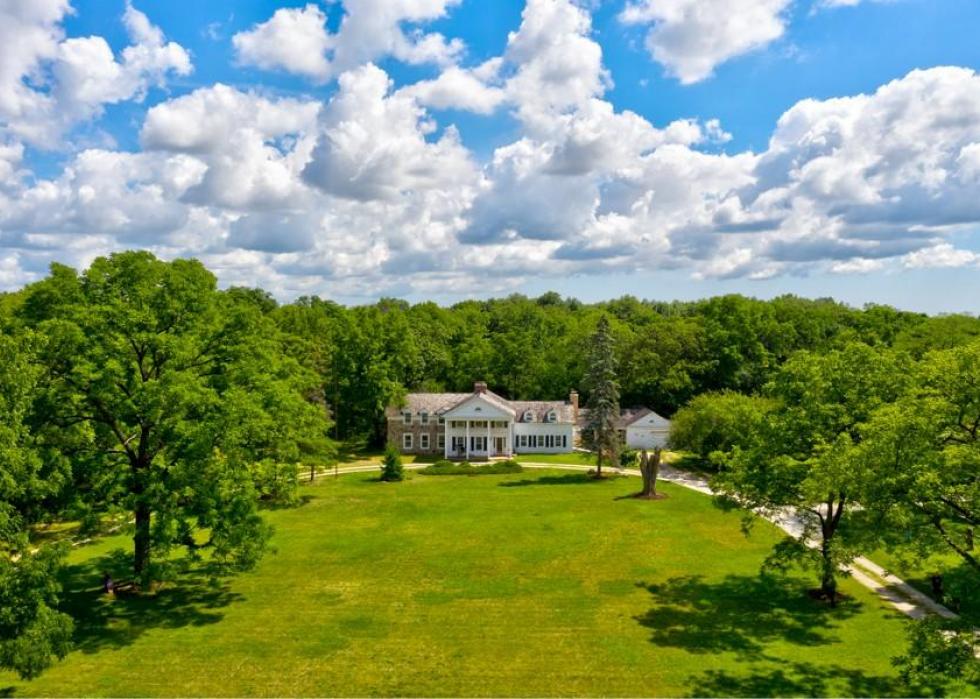
#27. Wayne
- 1 year home value change: +5.9%
- 10 year home value change: +1.0%
- #1,694 most expensive city nationwide
- Pictured: 34W033 White Thorne Rd, Wayne ($2.6 million, 5 bedrooms)
#26. La Grange
- 1 year home value change: +2.8%
- 10 year home value change: +26.0%
- #1,692 most expensive city nationwide
- Pictured: 1040 S Edgewood Ln, La Grange ($2.0 million, 6 bedrooms)

#25. Clarendon Hills
- 1 year home value change: +1.8%
- 10 year home value change: +16.8%
- #1,686 most expensive city nationwide
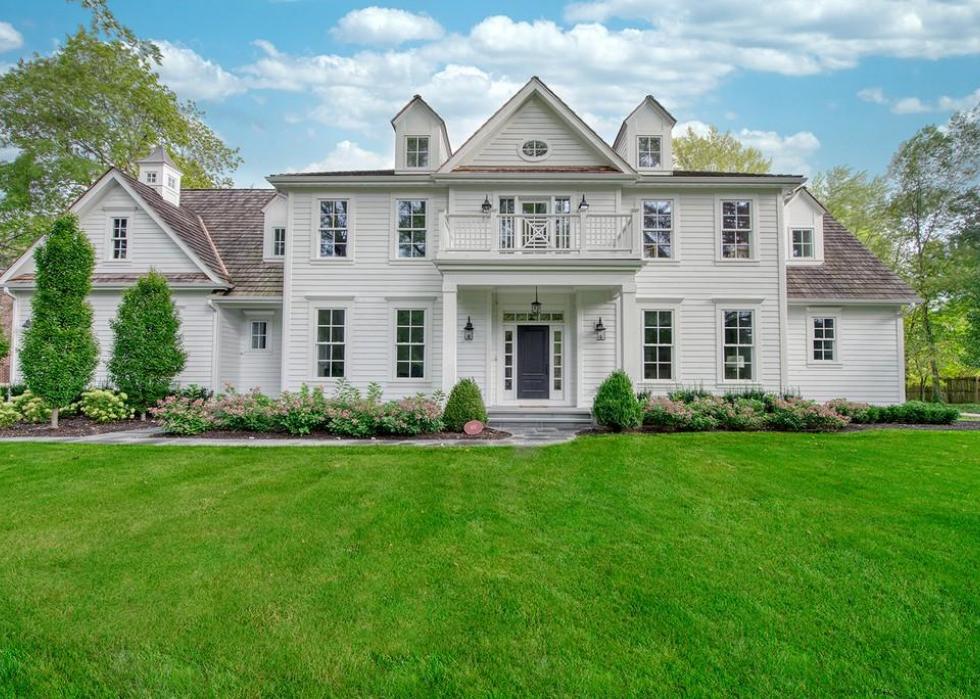
- Pictured: 234 S Prospect Ave, Clarendon Hills ($1.7 million, 6 bedrooms)
#24. Deer Park
- 1 year home value change: +4.4%
- 10 year home value change: +10.3%
- #1,590 most expensive city nationwide
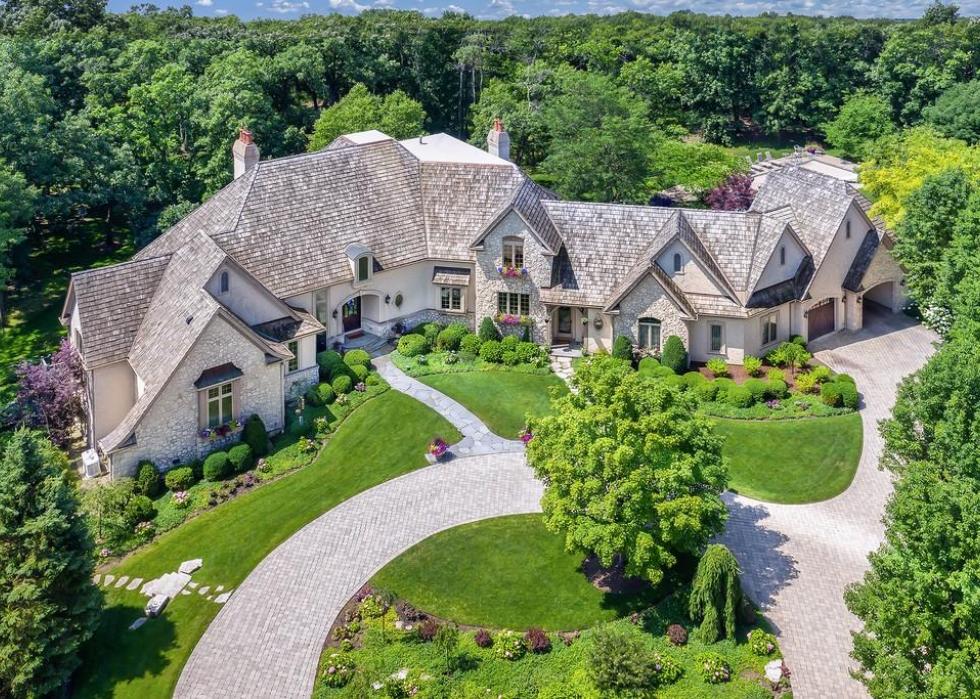
- Pictured: 21660 N Rainbow Rd, Deer Park ($1.6 million, 5 bedrooms)
#23. Glenview
- 1 year home value change: +1.2%
- 10 year home value change: +11.5%
- #1,527 most expensive city nationwide
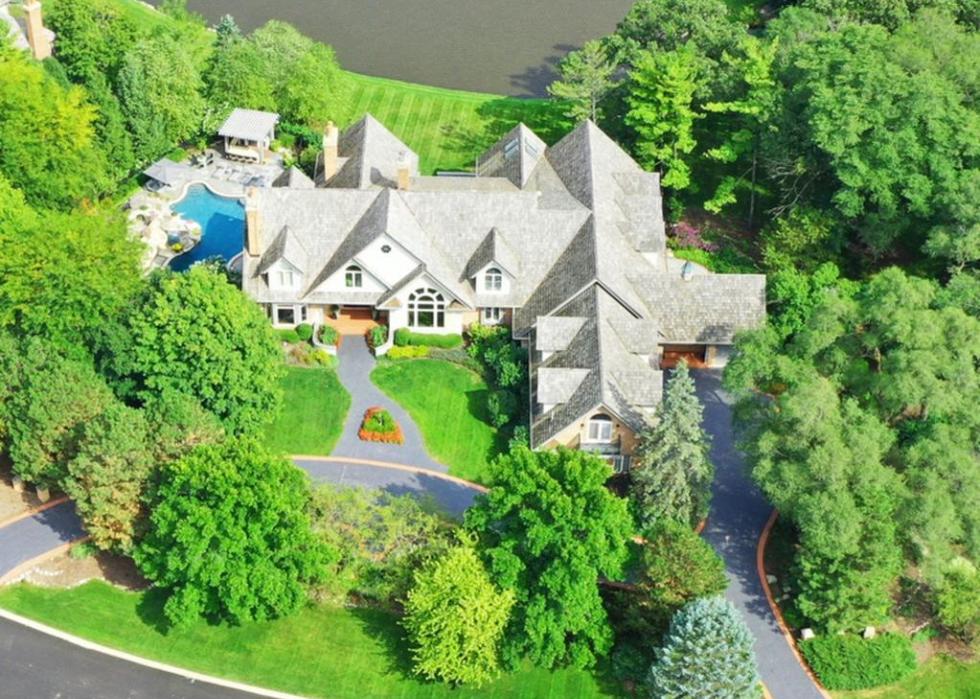
- Pictured: 601 Chatham Rd, Glenview ($2.8 million, 6 bedrooms)

#22. Northbrook
- 1 year home value change: +0.7%
- 10 year home value change: +17.2%
- #1,479 most expensive city nationwide
- Pictured: 1602-16 Braeside Ln, Northbrook ($6.5 million, 6 bedrooms)

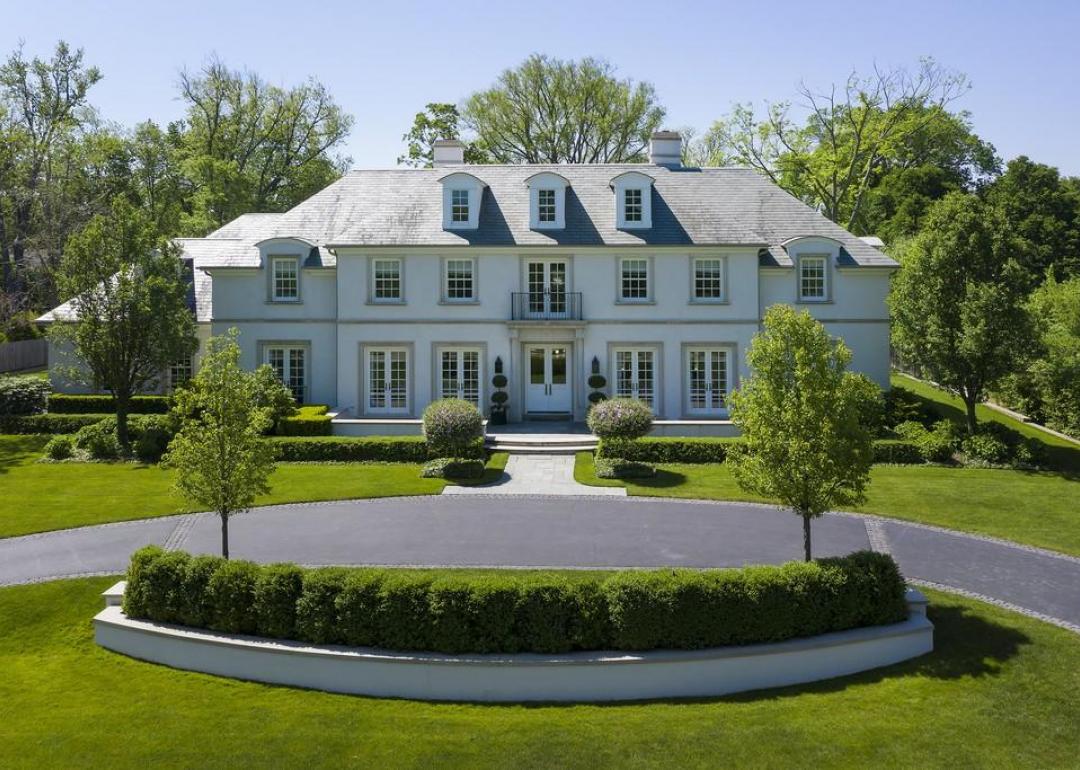
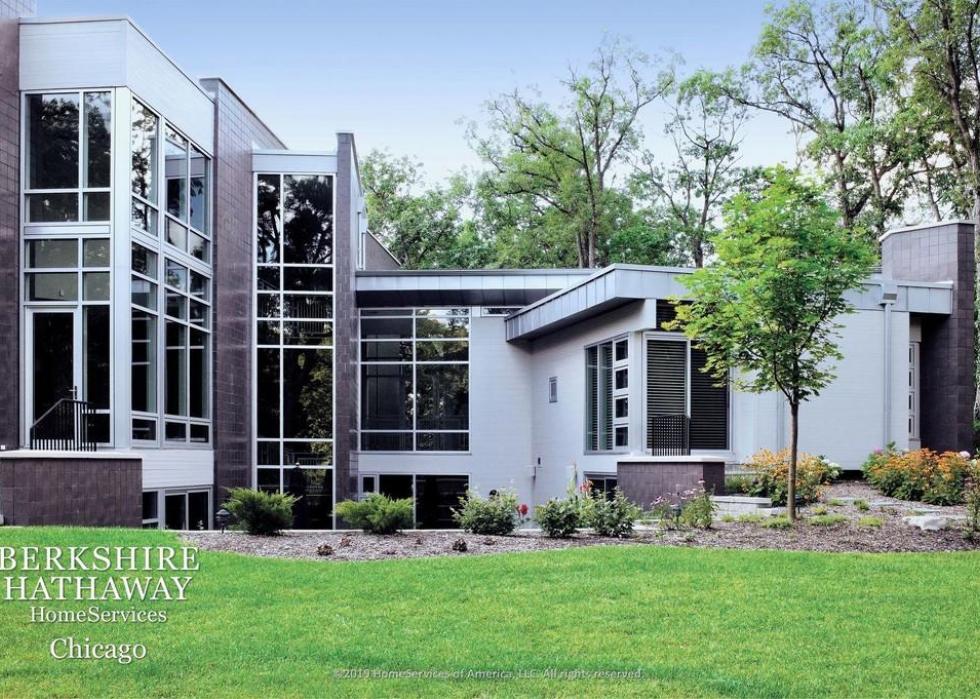
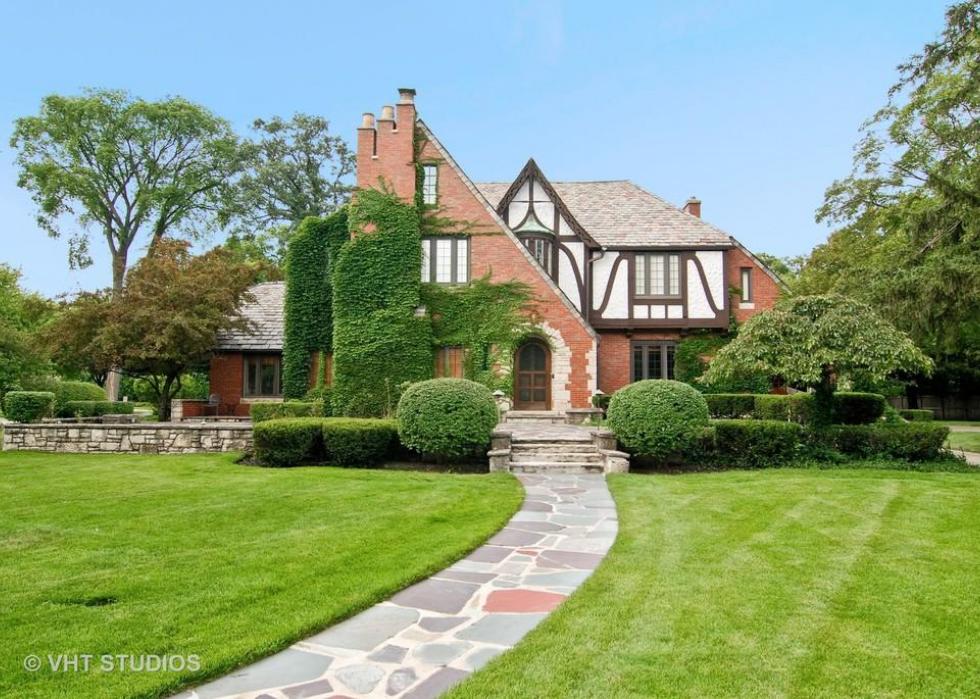
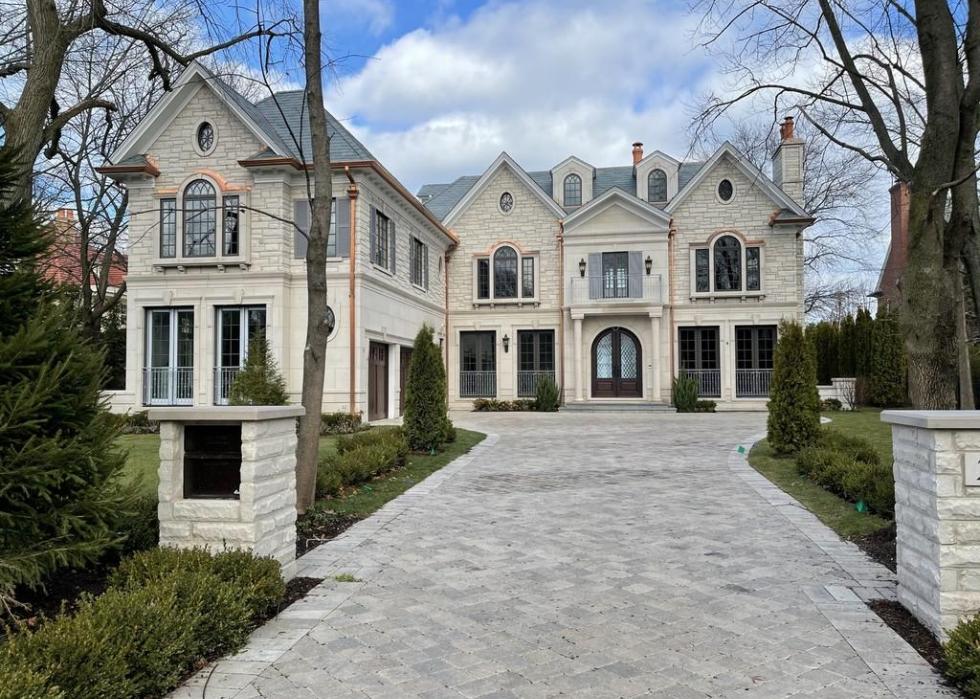
#21. Western Springs
- 1 year home value change: +1.7%
- 10 year home value change: +21.3%
- #1,203 most expensive city nationwide
- Pictured: 4736 Grand Ave, Western Springs ($2.5 million, 6 bedrooms)

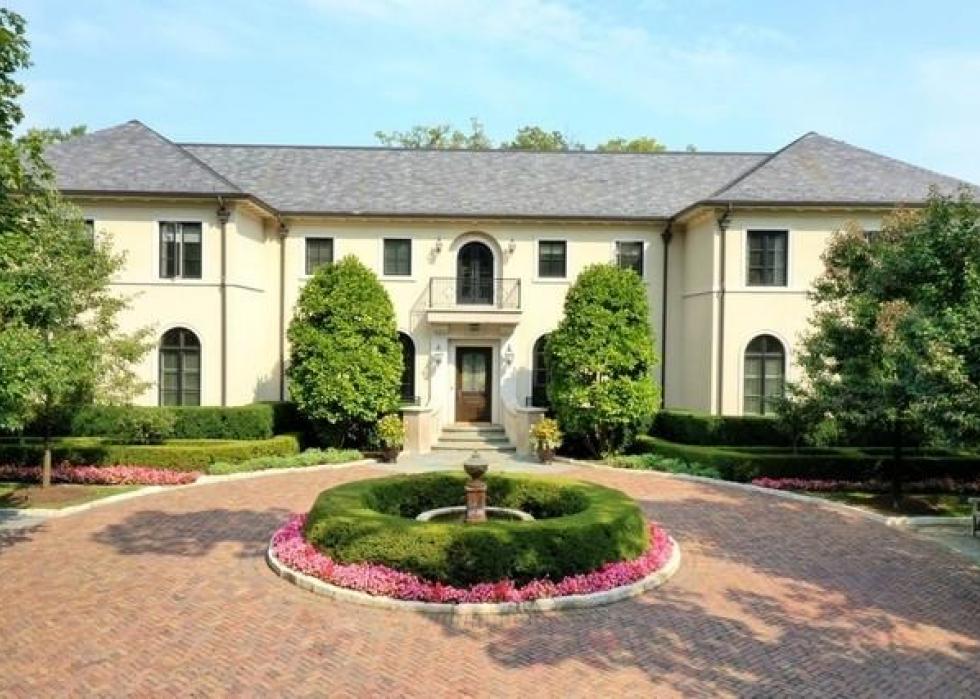
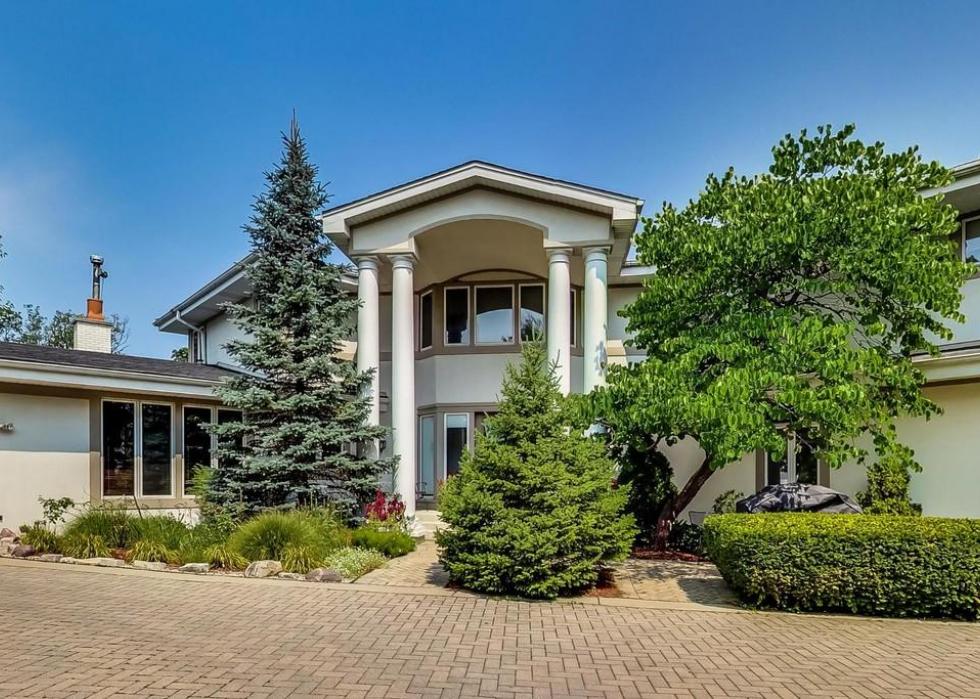
#20. Inverness
- 1 year home value change: +1.8%
- 10 year home value change: +1.5%
- #1,194 most expensive city nationwide
- Pictured: 55 New Abbey Dr, Inverness ($2.5 million, 5 bedrooms)

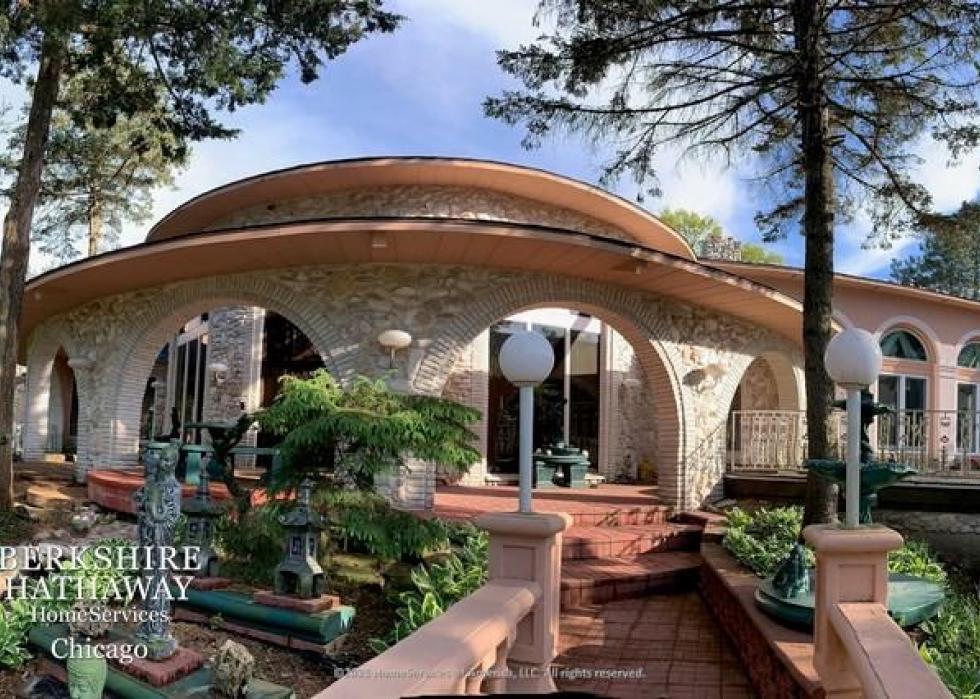
#19. Kildeer
- 1 year home value change: +2.8%
- 10 year home value change: +1.5%
- #1,178 most expensive city nationwide
- Pictured: 22396 N Greenmeadow Dr, Kildeer ($1.4 million, 6 bedrooms)
#18. Mettawa
- 1 year home value change: +4.2%
- 10 year home value change: +3.0%
- #1,131 most expensive city nationwide
- Pictured: 27104 Southwoods Ln, Libertyville ($2.0 million, 5 bedrooms)
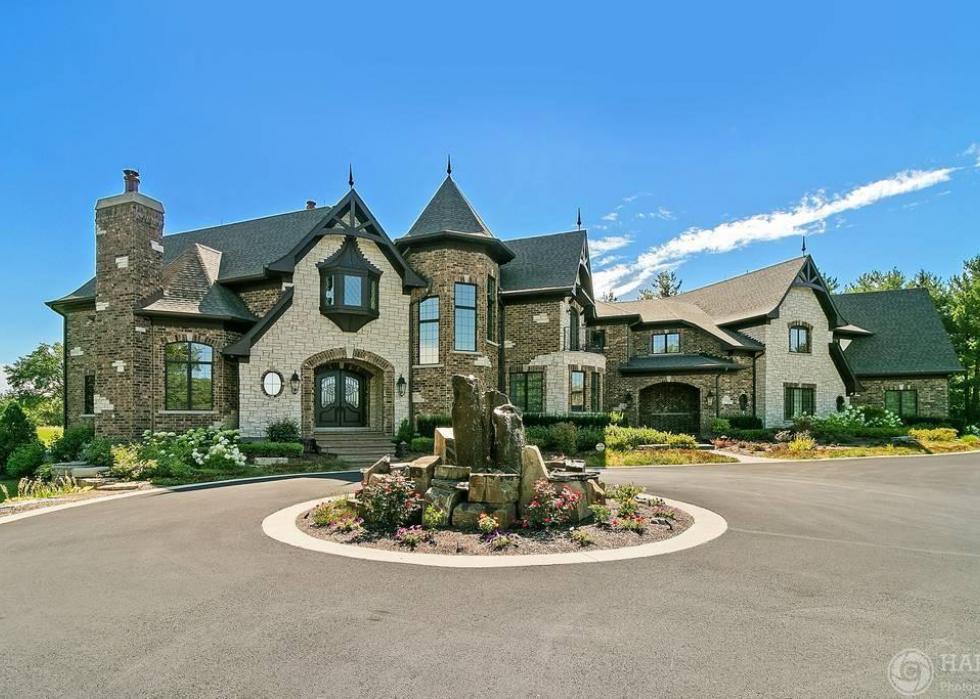
#17. North Barrington
- 1 year home value change: +5.4%
- 10 year home value change: +0.1%
- #1,111 most expensive city nationwide
- Pictured: 51 Hillburn Ln, North Barrington ($2.4 million, 5 bedrooms)

#16. Long Grove
- 1 year home value change: +3.4%
- 10 year home value change: -0.6%
- #1,055 most expensive city nationwide
- Pictured: 3149 Cuba Rd, Long Grove ($3.3 million, 5 bedrooms)
#15. Burr Ridge
- 1 year home value change: +1.6%
- 10 year home value change: +3.6%
- #1,054 most expensive city nationwide
- Pictured: 11300 79th St, Burr Ridge ($3.7 million, 5 bedrooms)

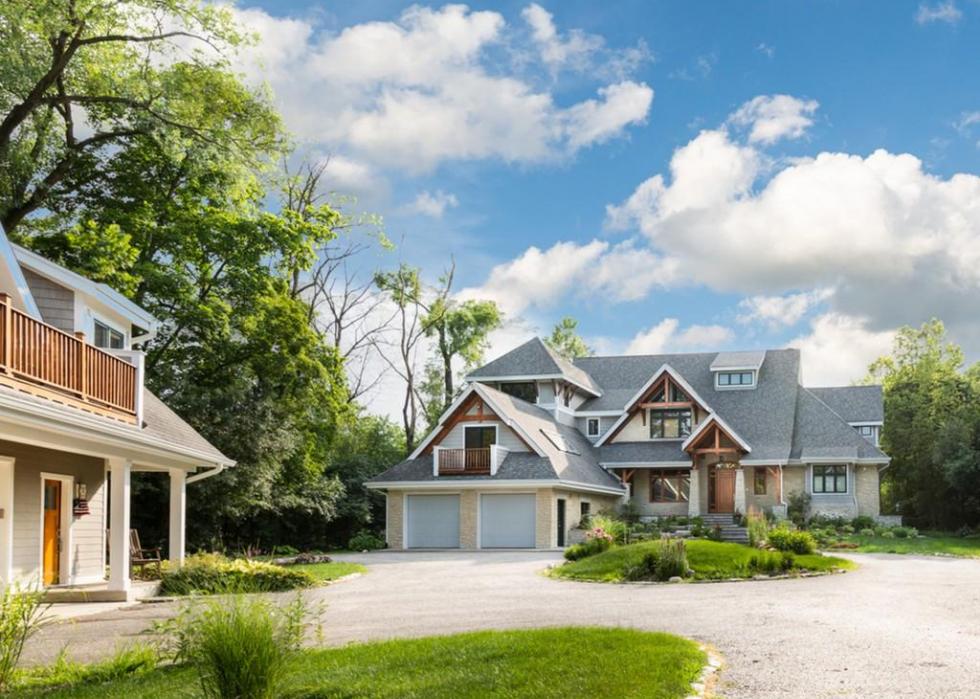
#14. Riverwoods
- 1 year home value change: +4.5%
- 10 year home value change: -0.8%
- #1,012 most expensive city nationwide
- Pictured: 720 Thornmeadow Rd, Riverwoods ($1.5 million, 5 bedrooms)
#13. River Forest
- 1 year home value change: -0.2%
- 10 year home value change: +12.8%
- #996 most expensive city nationwide
- Pictured: 1105 Park Ave, River Forest ($2.0 million, 5 bedrooms)
#12. Northfield
- 1 year home value change: -1.7%
- 10 year home value change: +15.8%
- #855 most expensive city nationwide
- Pictured: 225 Shadowood Ln, Northfield ($5.3 million, 6 bedrooms)
#11. Oak Brook
- 1 year home value change: +2.7%
- 10 year home value change: +8.6%
- #772 most expensive city nationwide
- Pictured: 2901 31st St, Oak Brook ($6.0 million, 5 bedrooms)

#10. Wilmette
- 1 year home value change: -0.1%
- 10 year home value change: +20.4%
- #682 most expensive city nationwide
- Pictured: 84 Indian Hill Rd, Winnetka ($6.4 million, 7 bedrooms)

#9. Barrington Hills
- 1 year home value change: +2.0%
- 10 year home value change: -4.7%
- #653 most expensive city nationwide
- Pictured: 7 Fox Hunt Rd, Barrington Hills ($17.8 million, 8 bedrooms)
#8. Golf
- 1 year home value change: -5.6%
- 10 year home value change: +12.2%
- #620 most expensive city nationwide
- Pictured: 1 Henneberry Ln, Golf ($1.8 million, 5 bedrooms)
#7. Lake Forest
- 1 year home value change: +3.7%
- 10 year home value change: +1.5%
- #601 most expensive city nationwide
- Pictured: 77 Stone Gate Ln, Lake Forest ($11.0 million, 6 bedrooms)
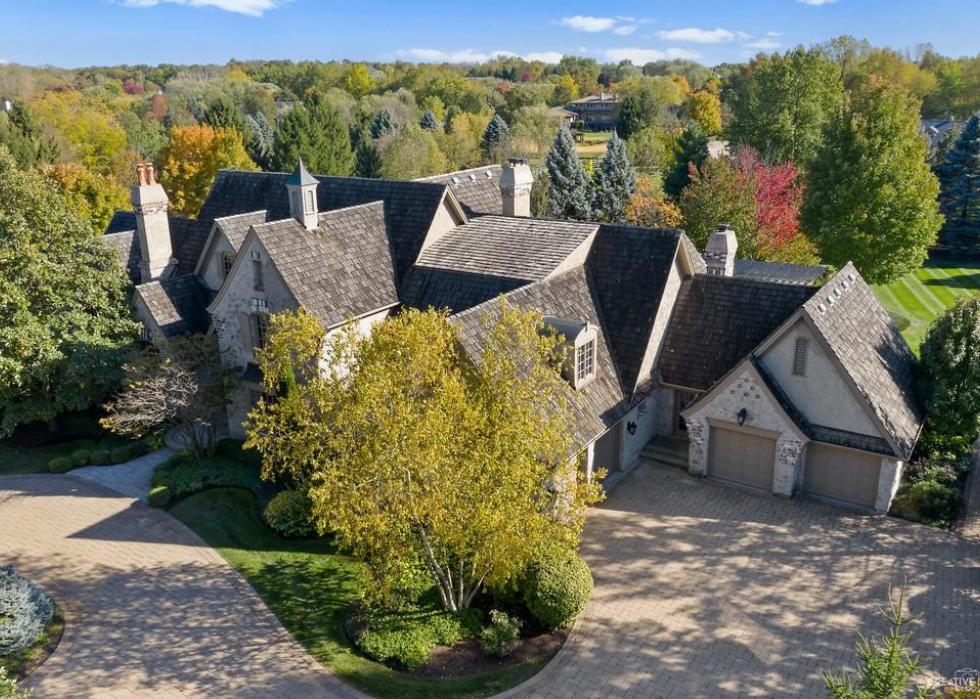
#6. South Barrington
- 1 year home value change: +3.5%
- 10 year home value change: -0.1%
- #552 most expensive city nationwide
- Pictured: 14 Vandenberg Dr, South Barrington ($2.9 million, 5 bedrooms)

#5. Bannockburn
- 1 year home value change: +6.7%
- 10 year home value change: +7.1%
- #478 most expensive city nationwide
- Pictured: 2500 Telegraph Rd, Bannockburn ($4.0 million, 5 bedrooms)

#4. Hinsdale
- 1 year home value change: +0.1%
- 10 year home value change: +10.6%
- #424 most expensive city nationwide
- Pictured: 219 E 1st St, Hinsdale ($7.0 million, 5 bedrooms)

#3. Glencoe
- 1 year home value change: +1.8%
- 10 year home value change: +7.0%
- #278 most expensive city nationwide
- Pictured: 443 Sheridan Rd, Glencoe ($18.0 million, 9 bedrooms)

#2. Winnetka
- 1 year home value change: +3.5%
- 10 year home value change: +17.9%
- #192 most expensive city nationwide
- Pictured: 84 Indian Hill Rd, Winnetka ($6.4 million, 7 bedrooms)
#1. Kenilworth
- 1 year home value change: +4.0%
- 10 year home value change: +data not available
- #160 most expensive city nationwide
- Pictured: 233 Sheridan Rd, Kenilworth ($10.0 million, 7 bedrooms)


