
Cities with the most expensive homes in Rhode Island
Cities with the most expensive homes in Rhode Island
Buying a home is an investment—and an increasingly expensive one. The median value of a home in the United States today is more than a quarter of a million dollars with a mortgage, and $167,000 without one. Meanwhile, the median monthly housing cost for a home with a mortgage is $1,558 and $490 without a mortgage.
Stacker compiled a list of cities with the most expensive homes in Rhode Island using data from Zillow. Cities are ranked by the Zillow Home Values Index for all homes as of January 2021. Listings and images are from realtor.com.
Home buyers have a lot to consider when house-hunting or looking to invest in rental properties, from the state of the housing market itself to taxes and potential resale value. The housing market grew robust and pricey in the decade following the 2008 recession, and more recently saw a boom during the coronavirus pandemic. Another consideration is the house itself, including what kind of upkeep it requires and those associated costs. Depreciation affects all homes at an average rate of 3.636% each year, which can be a help come tax season if you use your home for business or rentals but may cost you later in capital gains taxes when you sell. Meanwhile, land value tends to increase over time depending on several factors including where the house is located and what amenities and homes are nearby. More desirable neighborhoods allow sellers to charge more; the mantra "location, location, location" has never been more relevant.
Do you live in the area with the most expensive real estate market in your state? Keep reading to find out.
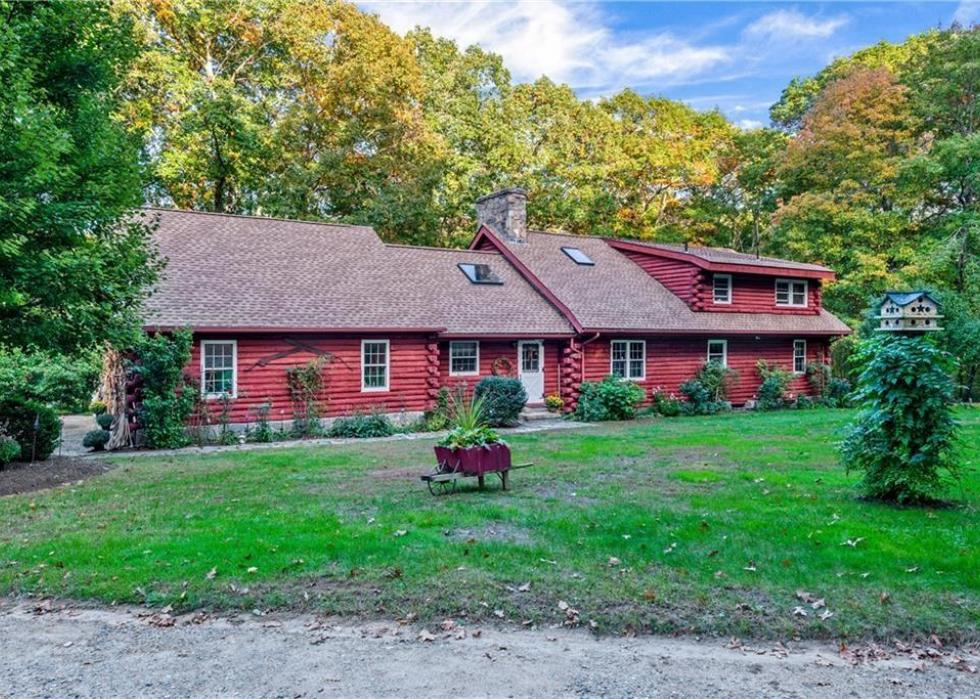
#30. Burrillville
- 1 year home value change: +9.9%
- 10 year home value change: +36.0%
- #4,535 most expensive city nationwide
- Pictured: 425 Mowry St, Burrillville ($825,000, 3 bedrooms)
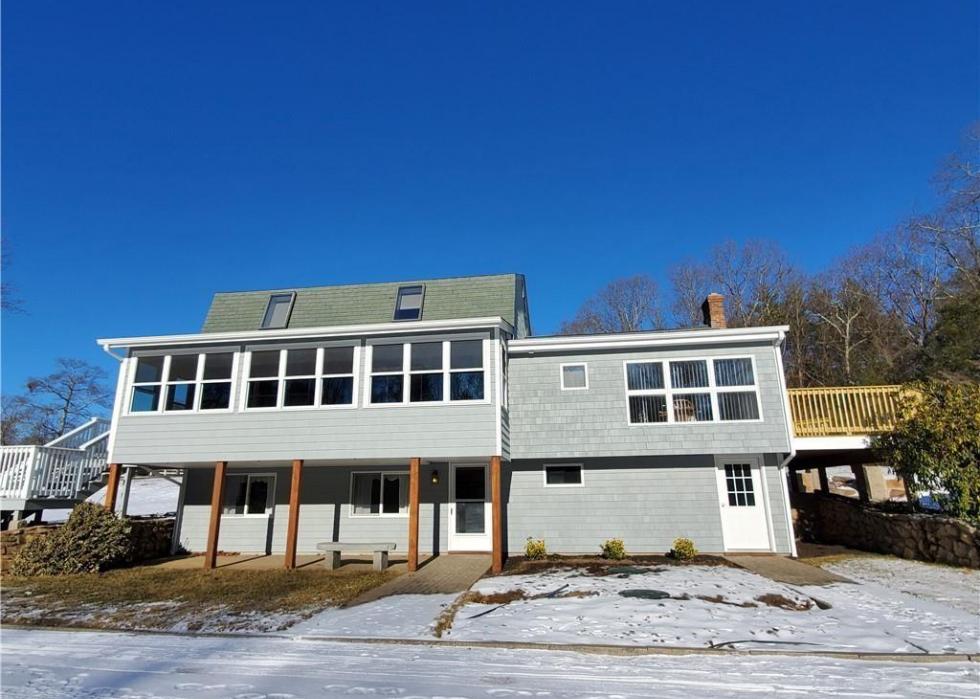
#29. Hopkinton
- 1 year home value change: +13.4%
- 10 year home value change: +23.5%
- #4,381 most expensive city nationwide
- Pictured: 34 C Smith Ln, Hopkinton ($650,000, 5 bedrooms)
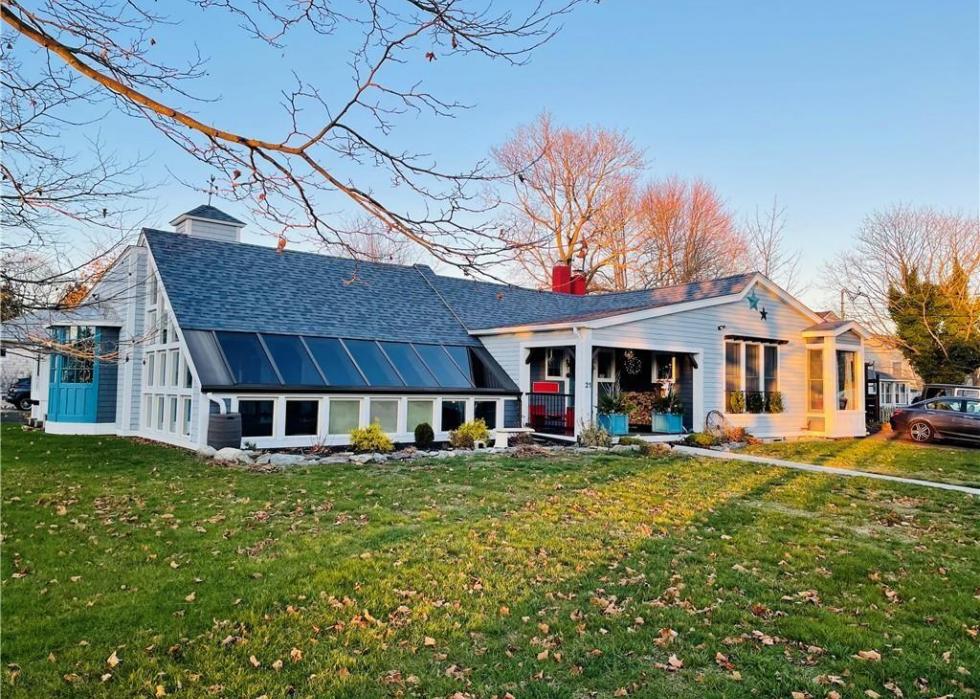
#28. Warren
- 1 year home value change: +12.9%
- 10 year home value change: +58.0%
- #3,986 most expensive city nationwide
- Pictured: 21 Brownell St, Warren ($860,000, 4 bedrooms)
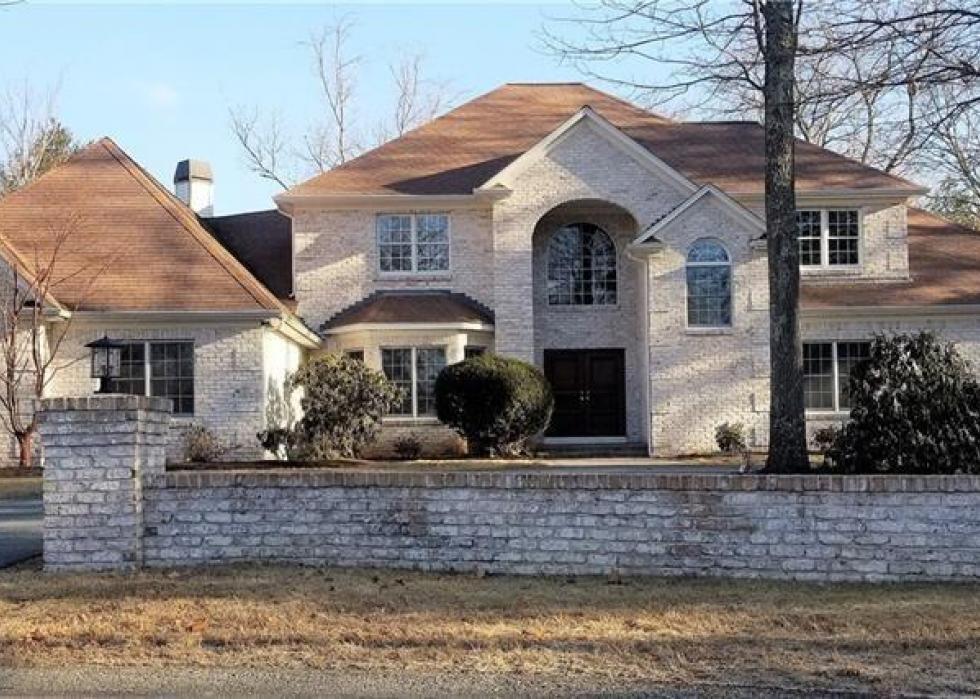
#27. Smithfield
- 1 year home value change: +10.0%
- 10 year home value change: +40.6%
- #3,810 most expensive city nationwide
- Pictured: 3 Mellissa Cir, Smithfield ($1.0 million, 5 bedrooms)
#26. Glocester
- 1 year home value change: +15.2%
- 10 year home value change: +35.8%
- #3,774 most expensive city nationwide
- Pictured: 18 James St, Glocester ($575,000, 4 bedrooms)
#25. Richmond
- 1 year home value change: +12.1%
- 10 year home value change: +33.7%
- #3,714 most expensive city nationwide
- Pictured: 107 Woodville Rd, Richmond ($1.6 million, 4 bedrooms)
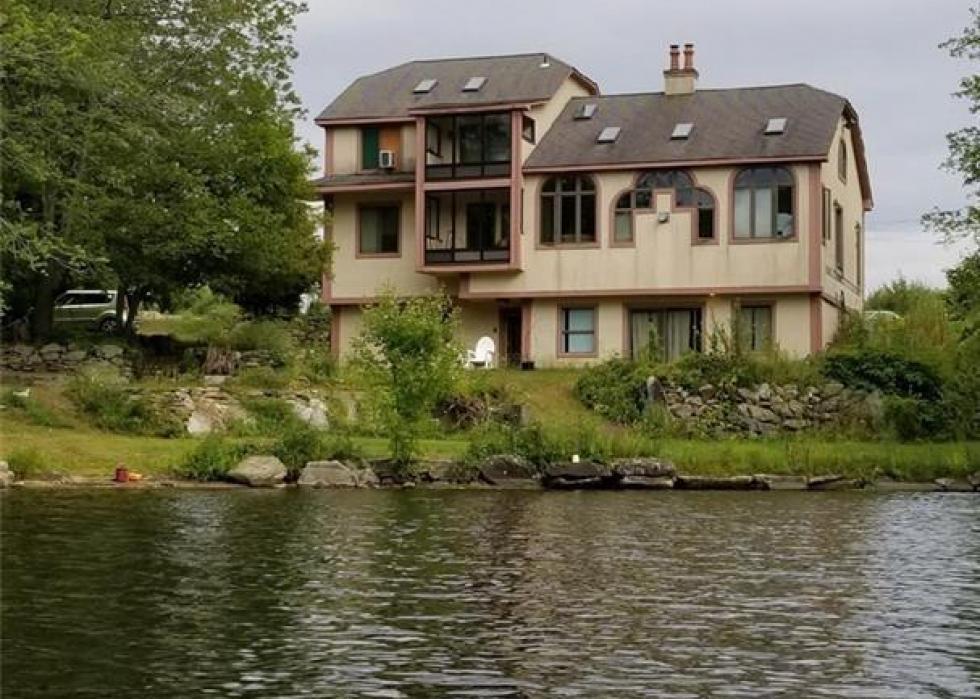
#24. Tiverton
- 1 year home value change: +9.2%
- 10 year home value change: +21.7%
- #3,650 most expensive city nationwide
- Pictured: 112 Riverscape Ln, Tiverton ($2.7 million, 4 bedrooms)
#23. Cumberland
- 1 year home value change: +12.5%
- 10 year home value change: +41.3%
- #3,579 most expensive city nationwide
- Pictured: 51 Reservoir Rd, Cumberland ($1.2 million, 4 bedrooms)
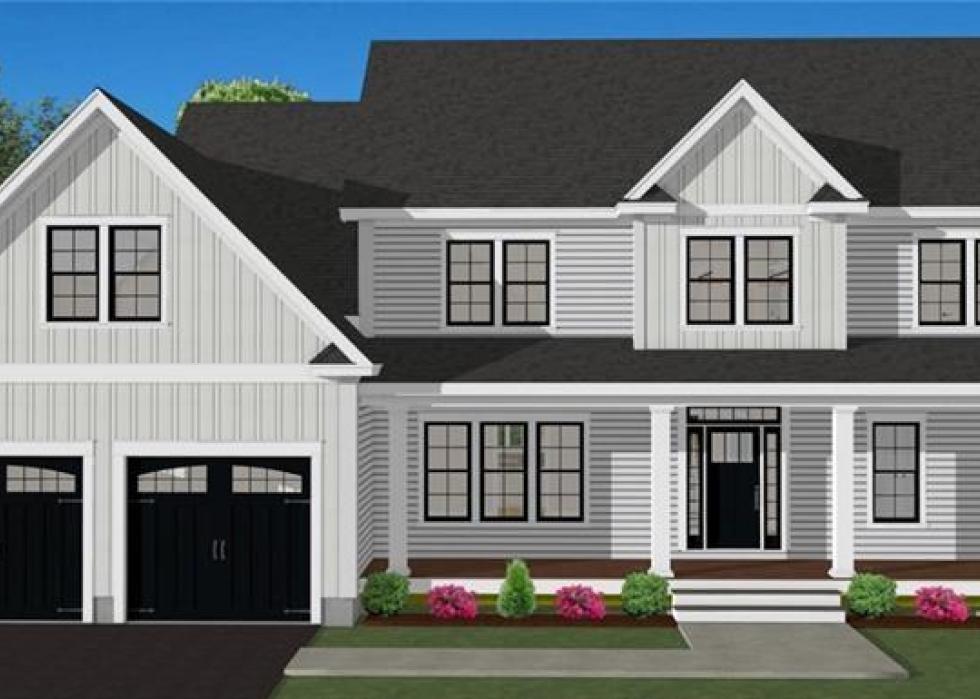
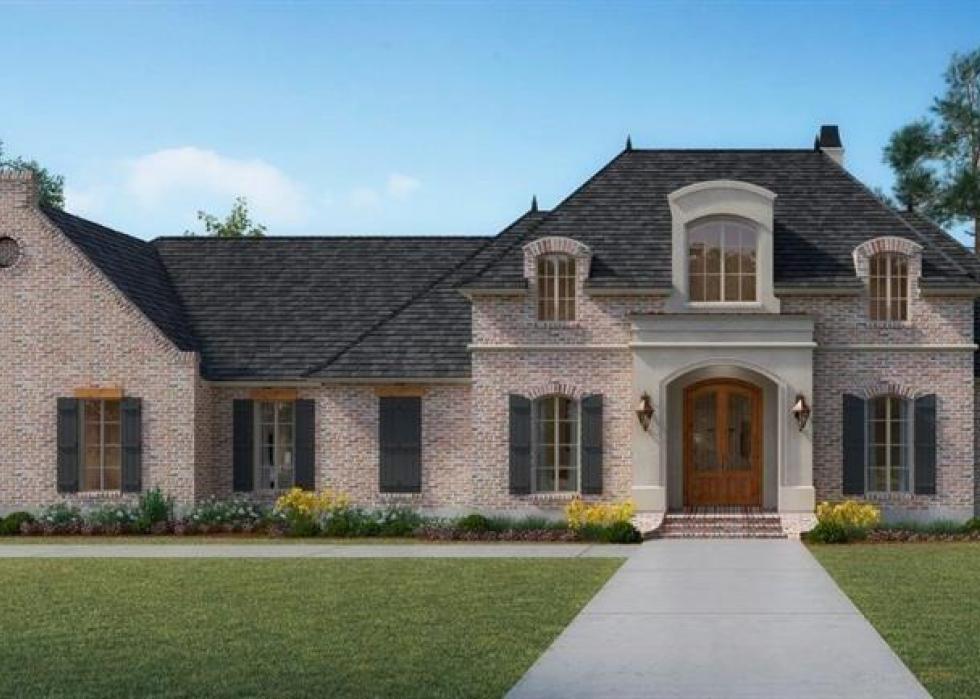
#22. North Smithfield
- 1 year home value change: +9.2%
- 10 year home value change: +34.9%
- #3,533 most expensive city nationwide
- Pictured: 18 Mowry Farms Ln, North Smithfield ($699,999, 3 bedrooms)
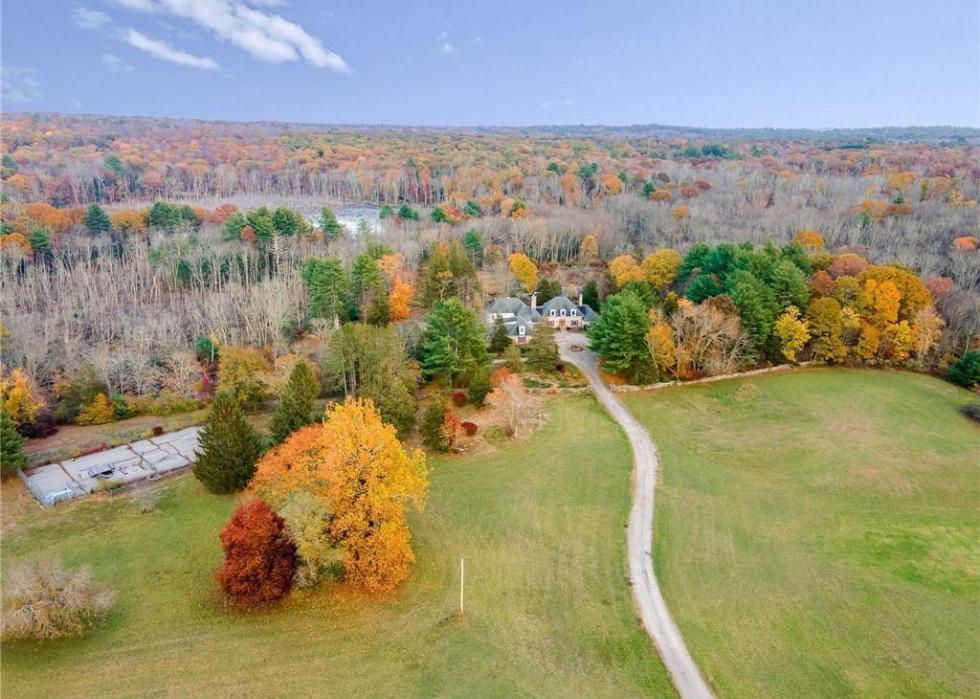
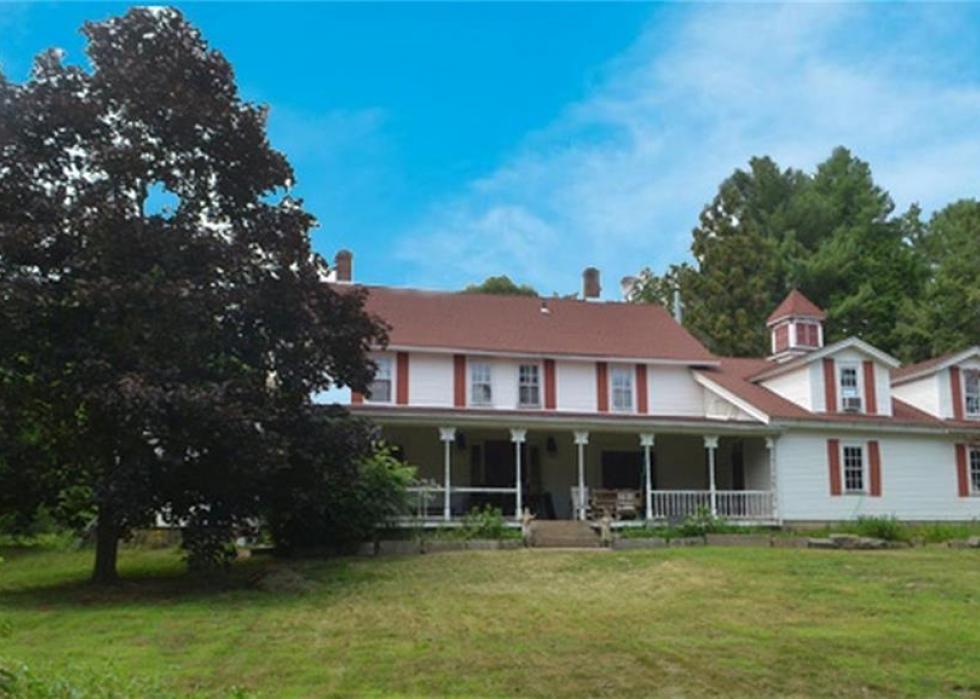
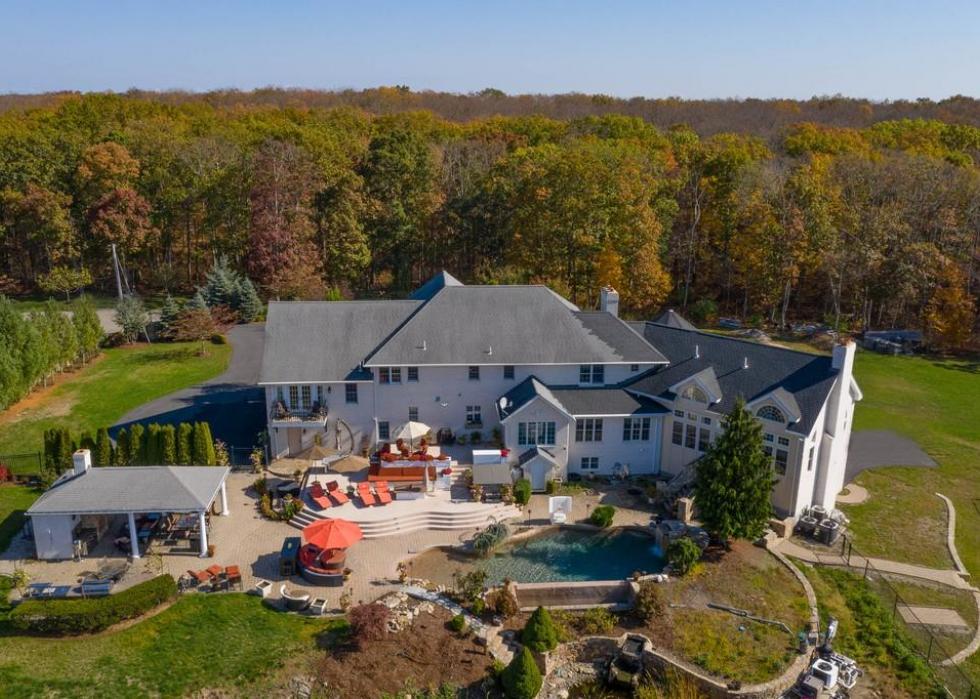
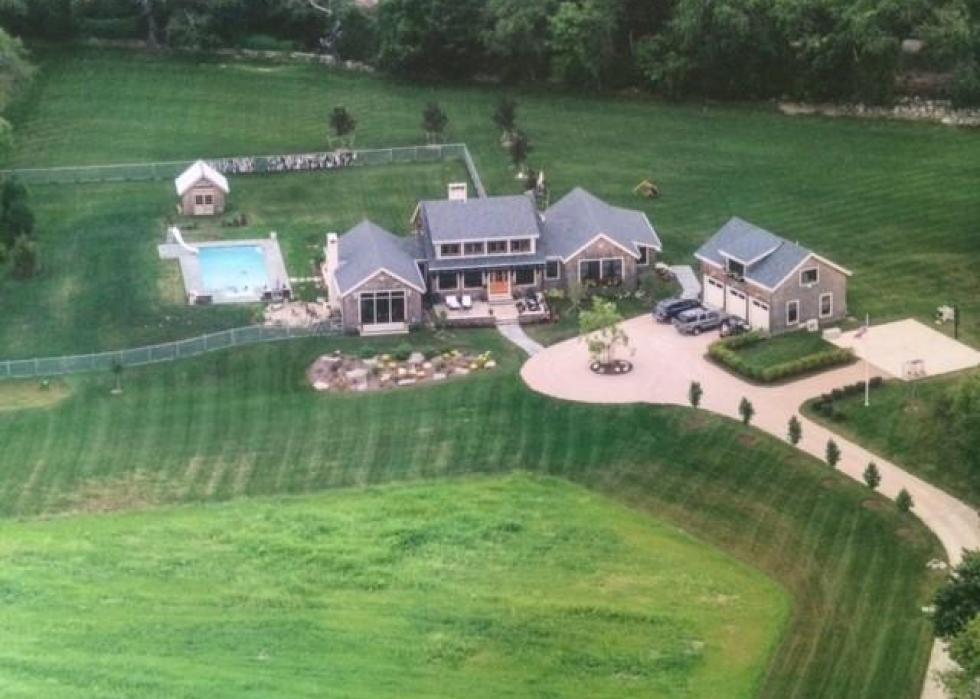
#21. Foster
- 1 year home value change: +9.7%
- 10 year home value change: +37.8%
- #3,506 most expensive city nationwide
- Pictured: 41 Johnson Rd, Foster ($1.5 million, 7 bedrooms)
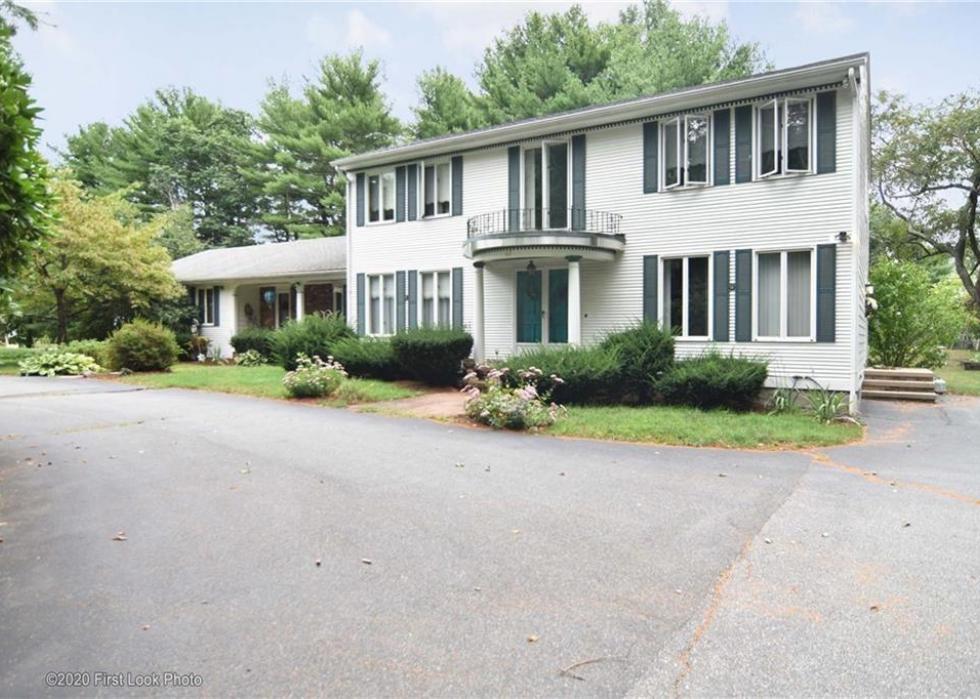
#20. Greenville
- 1 year home value change: +12.9%
- 10 year home value change: +45.6%
- #3,505 most expensive city nationwide
- Pictured: 67 Pleasant View Ave, Smithfield ($550,000, 5 bedrooms)
#19. Lincoln
- 1 year home value change: +12.9%
- 10 year home value change: +46.8%
- #3,135 most expensive city nationwide
- Pictured: 0 Dennell Dr, Lincoln ($1.6 million, 4 bedrooms)
#18. Scituate
- 1 year home value change: +9.6%
- 10 year home value change: +41.0%
- #3,108 most expensive city nationwide
- Pictured: 23 Overlook Trl, Scituate ($1.8 million, 5 bedrooms)
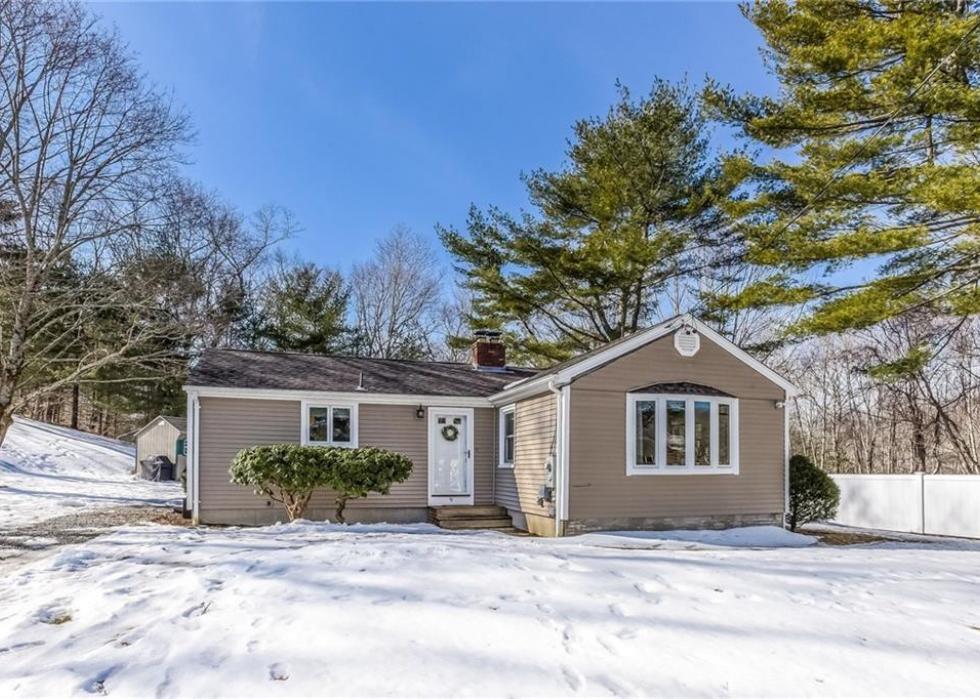
#17. Exeter
- 1 year home value change: +8.8%
- 10 year home value change: +32.2%
- #2,991 most expensive city nationwide
- Pictured: 9 Birch Dr, Exeter ($250,000, 2 bedrooms)
#16. Bristol
- 1 year home value change: +11.5%
- 10 year home value change: +53.6%
- #2,955 most expensive city nationwide
- Pictured: 9 Monkey Wrench Ln, Bristol ($3.3 million, 6 bedrooms)
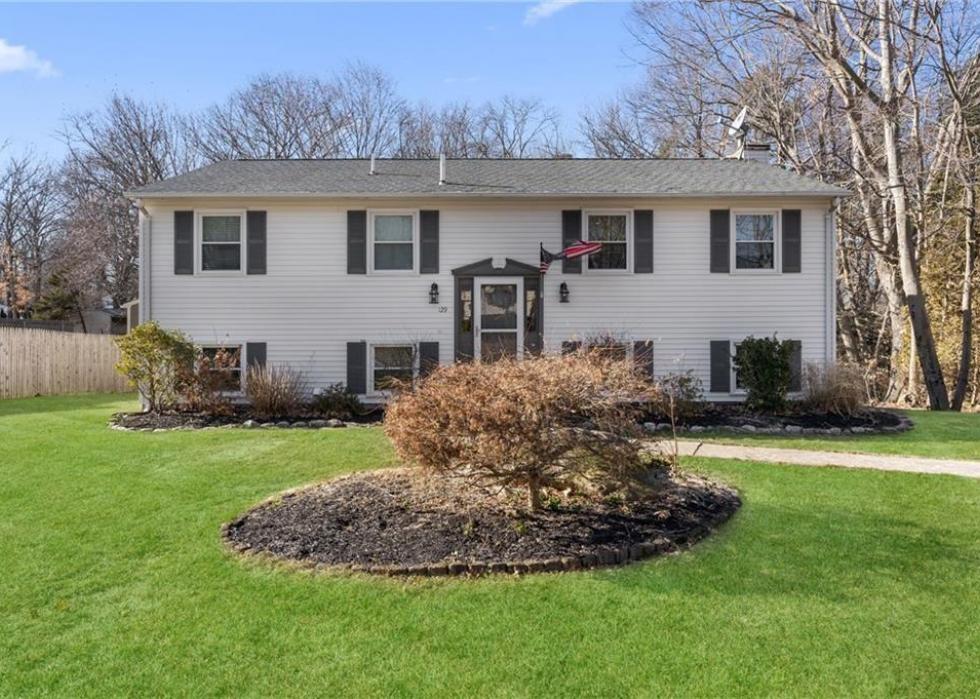
#15. West Greenwich
- 1 year home value change: +10.2%
- 10 year home value change: +40.9%
- #2,828 most expensive city nationwide
- Pictured: 129 Nottingham Dr, West Warwick ($349,900, 3 bedrooms)
#14. Westerly
- 1 year home value change: +11.0%
- 10 year home value change: +26.7%
- #2,794 most expensive city nationwide
- Pictured: 12 Arraquat Rd, Westerly ($9.2 million, 10 bedrooms)
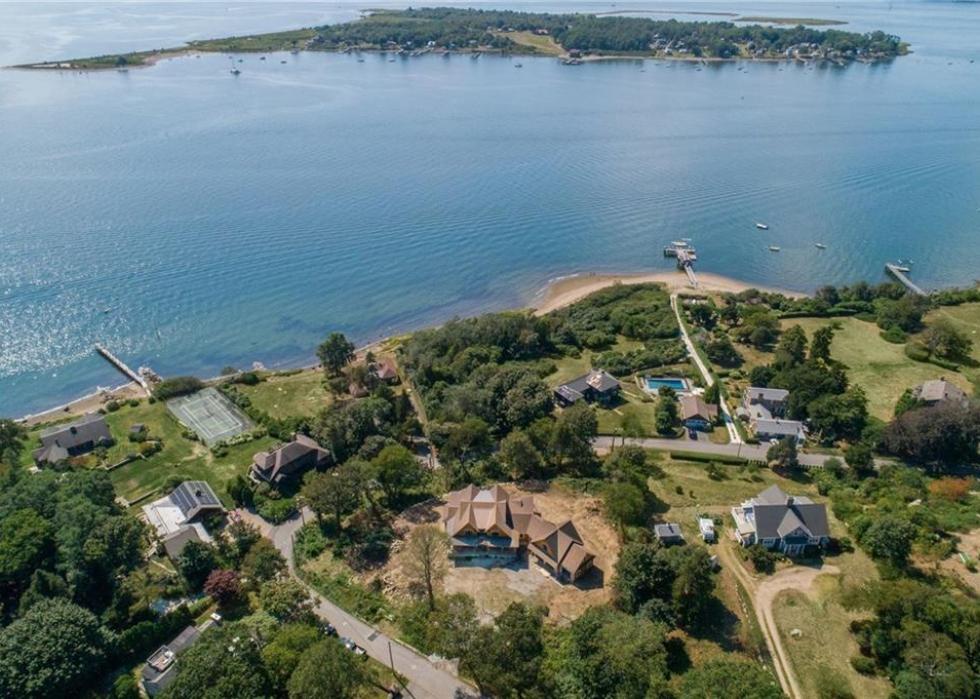
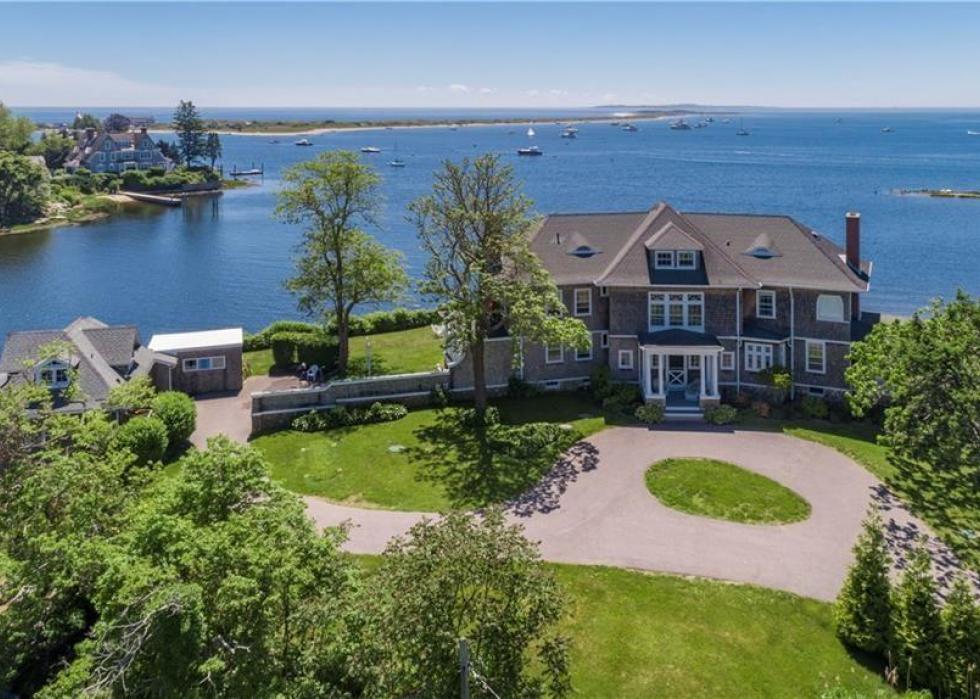
#13. North Kingstown
- 1 year home value change: +11.9%
- 10 year home value change: +36.8%
- #2,544 most expensive city nationwide
- Pictured: 46 Pojac Point Rd, North Kingstown ($3.5 million, 5 bedrooms)
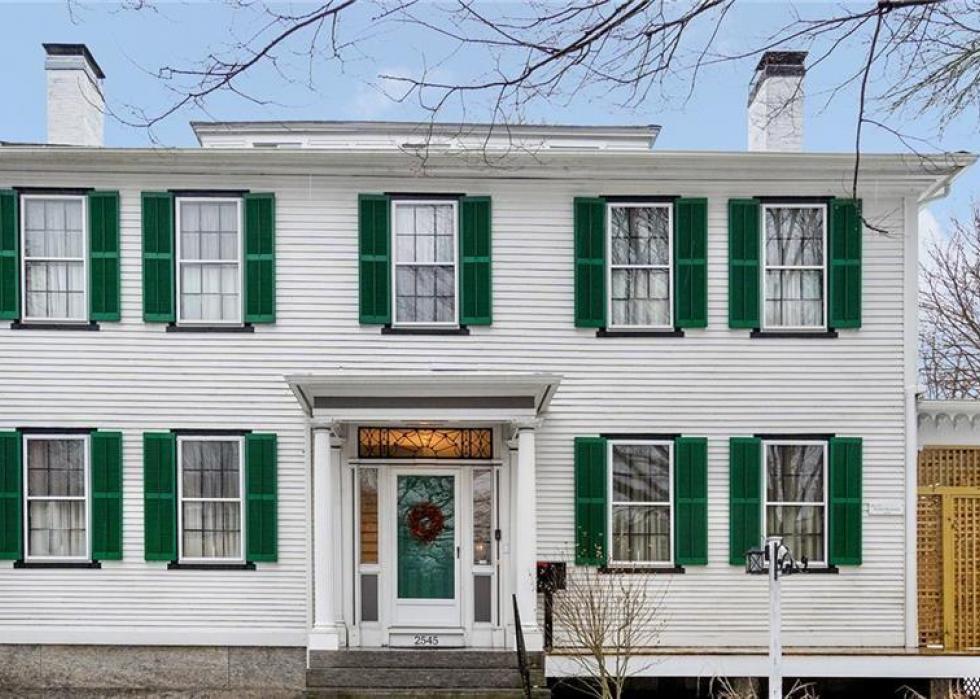
#12. Kingston
- 1 year home value change: +12.3%
- 10 year home value change: +37.6%
- #2,475 most expensive city nationwide
- Pictured: 2545 Kingstown Rd, South Kingstown ($615,000, 5 bedrooms)
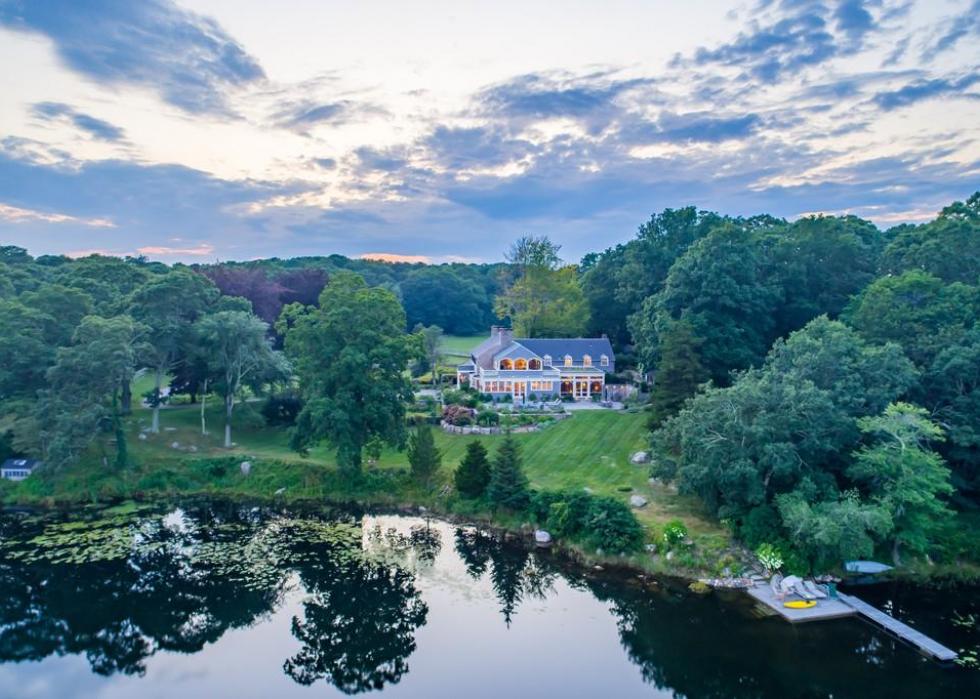
#11. South Kingstown
- 1 year home value change: +11.4%
- 10 year home value change: +39.2%
- #2,113 most expensive city nationwide
- Pictured: 527 Ministerial Rd, South Kingstown ($8.0 million, 8 bedrooms)

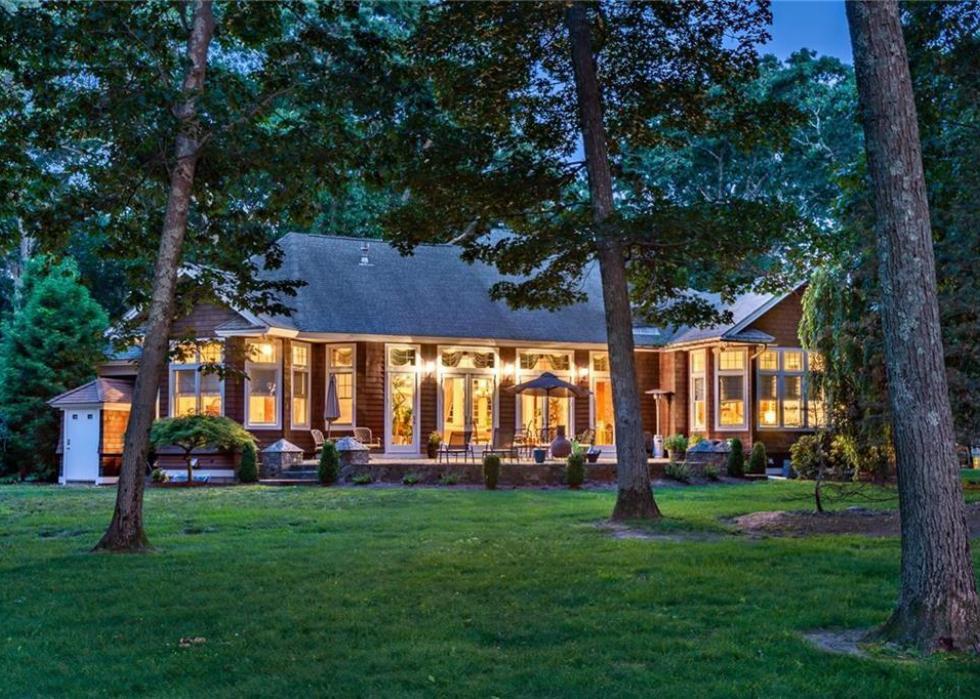
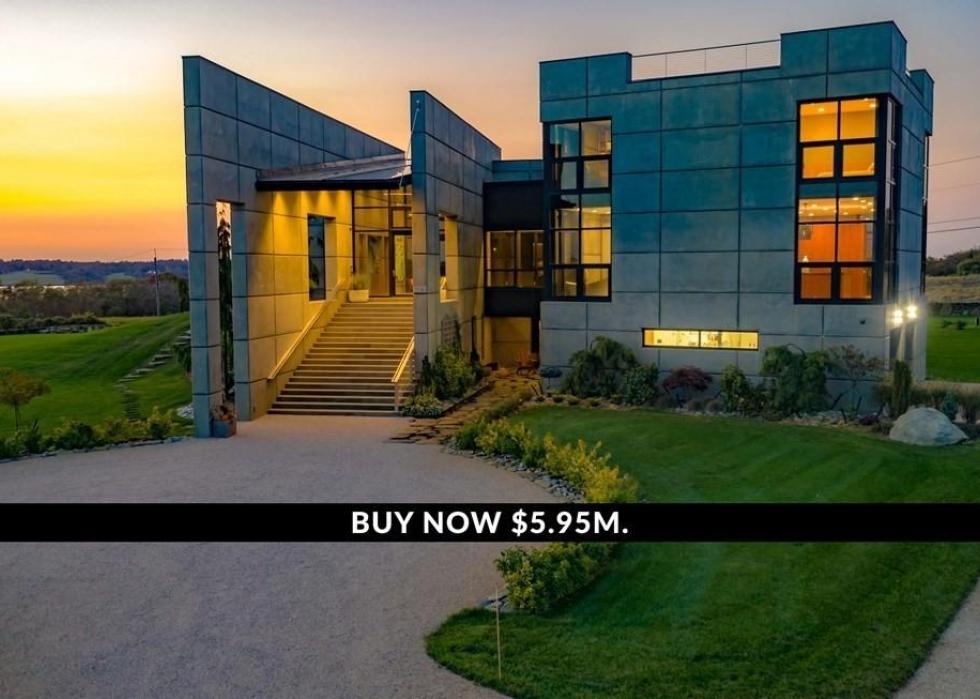
#10. Charlestown
- 1 year home value change: +16.2%
- 10 year home value change: +33.0%
- #1,998 most expensive city nationwide
- Pictured: 160 C Ross Hill Rd, Charlestown ($6.0 million, 3 bedrooms)

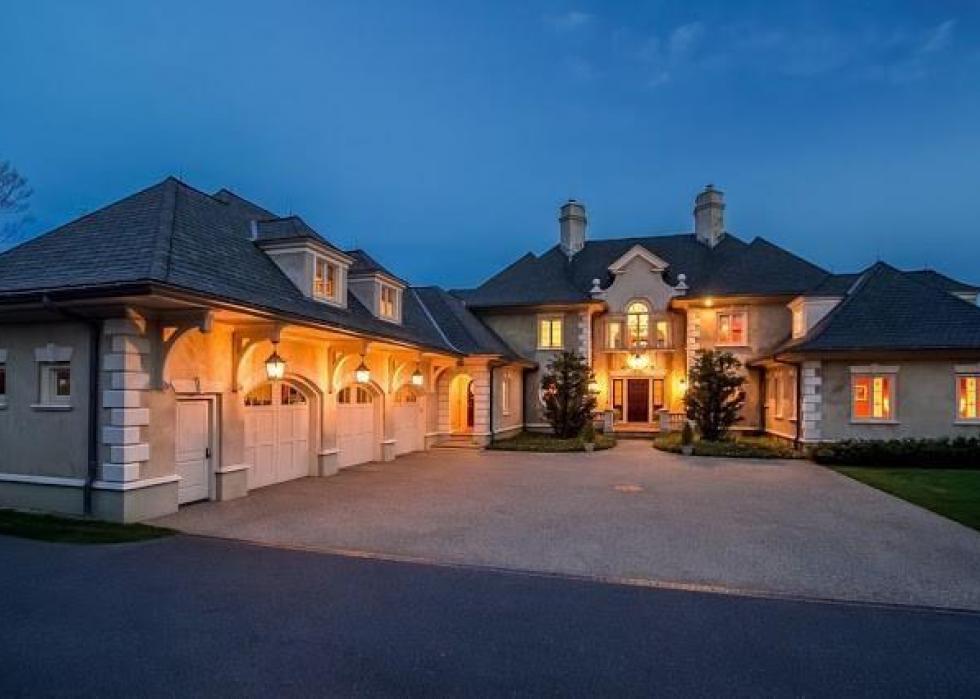
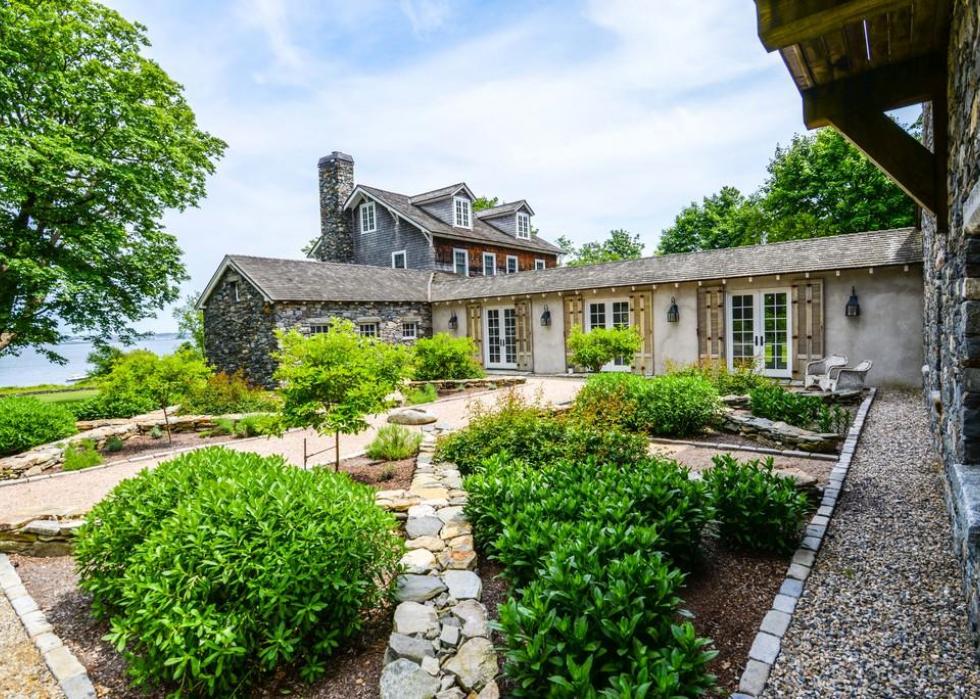
#9. Portsmouth
- 1 year home value change: +11.7%
- 10 year home value change: +17.0%
- #1,996 most expensive city nationwide
- Pictured: 272 Carnegie Harbor Dr, Portsmouth ($8.0 million, 6 bedrooms)
#8. Middletown
- 1 year home value change: +6.9%
- 10 year home value change: +18.6%
- #1,850 most expensive city nationwide
- Pictured: 233 Berkeley Ave, Middletown ($2.9 million, 4 bedrooms)
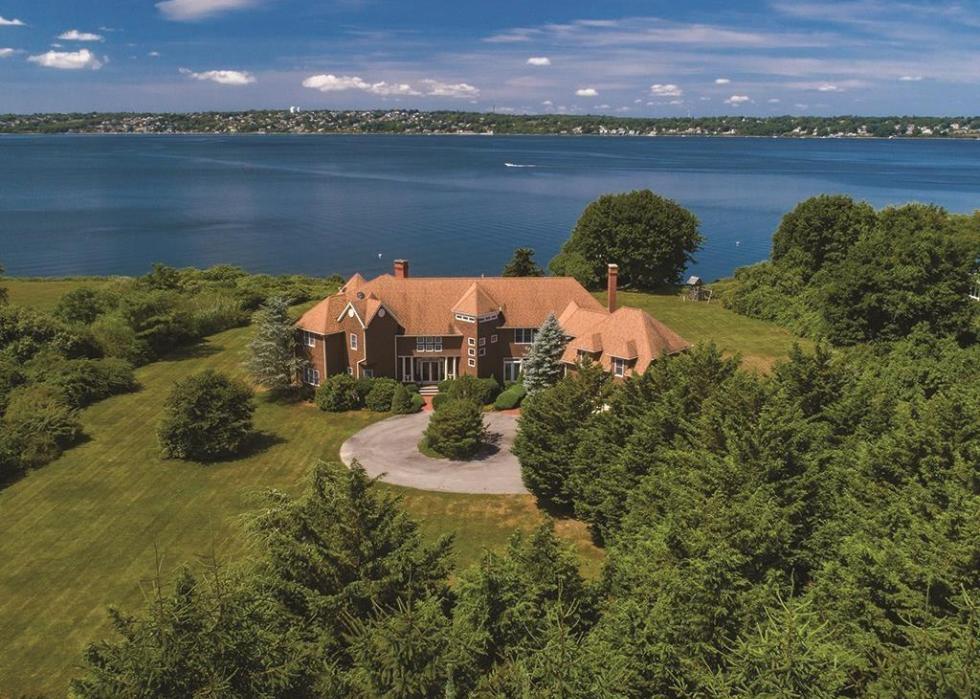
#7. Barrington
- 1 year home value change: +12.4%
- 10 year home value change: +55.5%
- #1,616 most expensive city nationwide
- Pictured: 85 Nayatt Rd, Barrington ($5.0 million, 7 bedrooms)
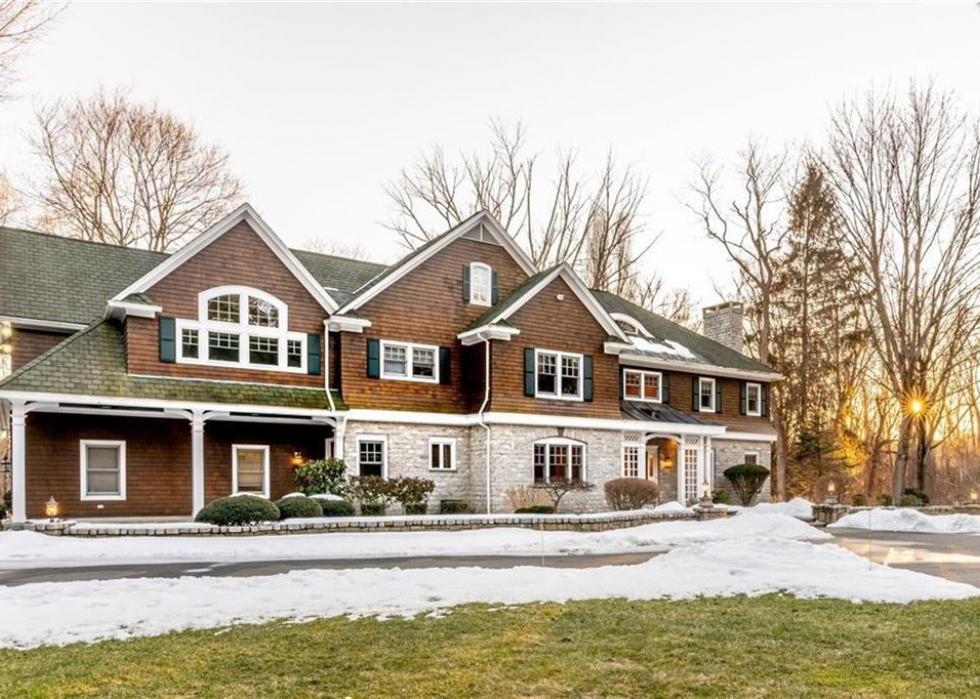
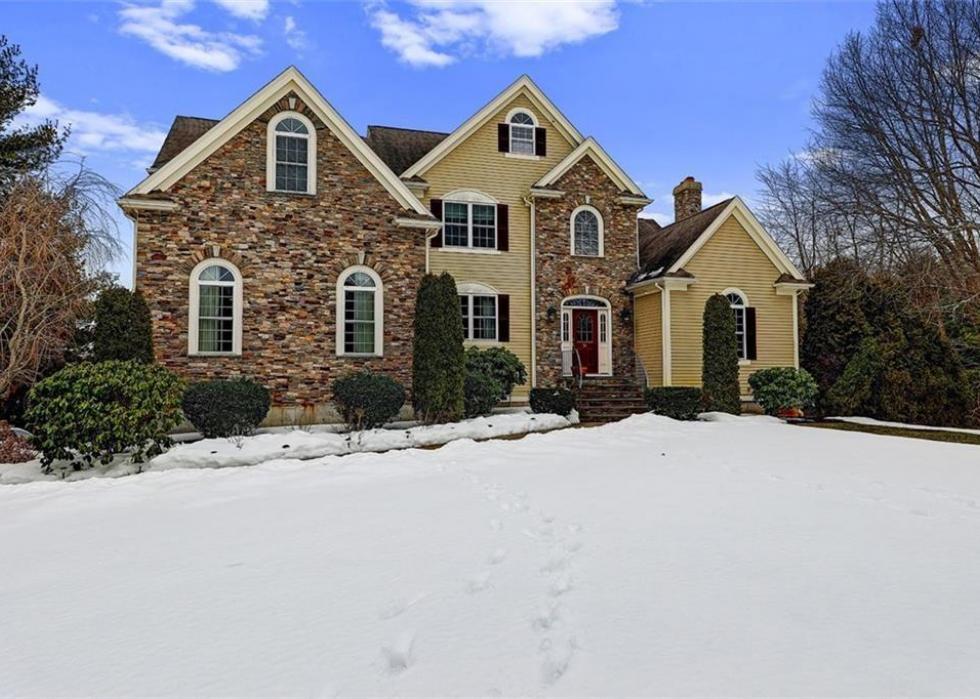
#6. East Greenwich
- 1 year home value change: +9.8%
- 10 year home value change: +28.6%
- #1,570 most expensive city nationwide
- Pictured: 4 Cedar Rock Dr, East Greenwich ($2.0 million, 5 bedrooms)
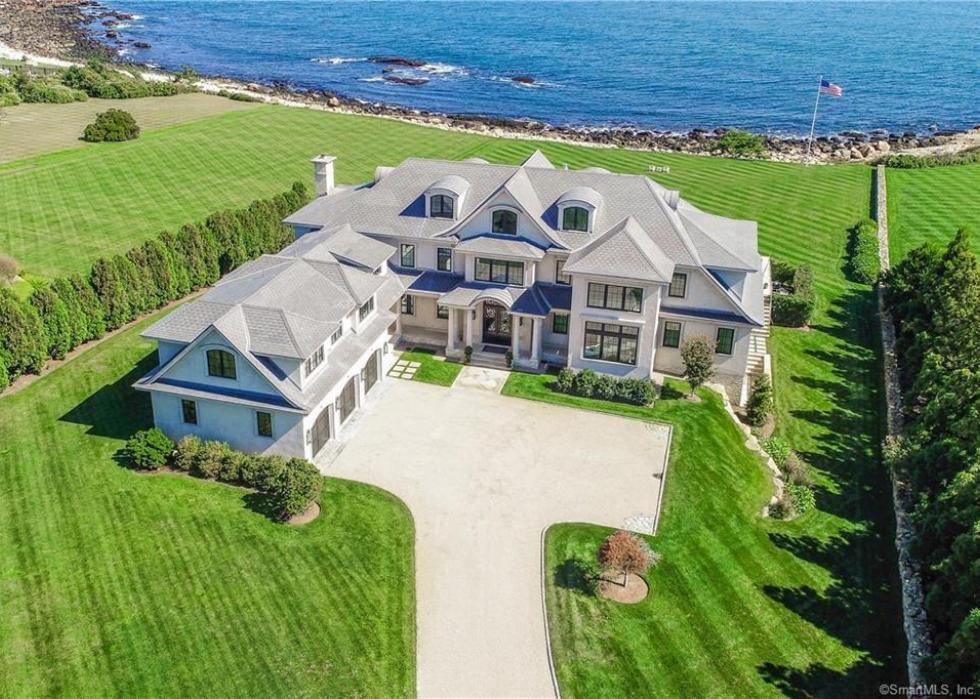
#5. Narragansett
- 1 year home value change: +13.0%
- 10 year home value change: +42.5%
- #1,258 most expensive city nationwide
- Pictured: 518 Ocean Rd, Narragansett ($14.0 million, 5 bedrooms)

#4. Newport
- 1 year home value change: +10.4%
- 10 year home value change: +27.4%
- #1,086 most expensive city nationwide
- Pictured: 180 Narragansett Ave, Newport ($14.0 million, 14 bedrooms)
#3. Little Compton
- 1 year home value change: +12.6%
- 10 year home value change: +15.6%
- #947 most expensive city nationwide
- Pictured: 155-D W Main Rd, Little Compton ($7.8 million, 3 bedrooms)
#2. Jamestown
- 1 year home value change: +7.6%
- 10 year home value change: +17.4%
- #743 most expensive city nationwide
- Pictured: 256 E Shore Rd, Jamestown ($7.0 million, 7 bedrooms)

#1. New Shoreham
- 1 year home value change: +11.0%
- 10 year home value change: +12.3%
- #238 most expensive city nationwide
- Pictured: 1501 Beacon Hill Rd, Block Island ($6.8 million, 5 bedrooms)


